Market capitalization is one of the indicators of a company's value.
It allows you to find out approximately how much a given company is worth on the stock market. Traditionally, market capitalization is also called the cost of capital in the stock market, and it is a basic mathematical calculation. However, it is only one of the guidelines in assessing the value of an enterprise. Let's look at what components make up this characteristic, how it is calculated, and what differences it has from other assessment methods that can be used when selecting specific stocks for investment.
Calculation
To calculate market capitalization, the number of all shares must be multiplied by the current value of one security. In formula form it looks like this:
Market capitalization = Number of all shares of the company × Current value of one share.
For example, a joint stock company has issued 200,000 shares, the current value of one security is 2,000 rubles. Consequently, the market capitalization of this joint stock company is 400 million rubles.
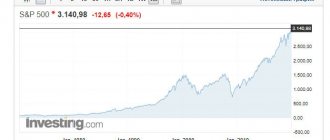
The price of shares is constantly changing and is determined by supply and demand in the market. When a company is productive and its economic situation is stable, the value of securities increases. During a crisis, the price of shares decreases and the company's capitalization also decreases. Since market capitalization differs from marketing capitalization in that the increase in capital does not depend on the actions of the company’s managers, but on transactions on the stock exchange, it is also called fictitious.
The value of a company cannot be judged by the price of a share. A company with a share price of 2,000 rubles may be cheaper than a company with a share price of 200 rubles. Capitalization is used by investors to compare the size of a business. However, it is calculated without taking into account the company's debts. To determine the real value of the enterprise, you will need to sum up the capitalization and total debt, adjusted for available funds.
Market capitalization calculation
To calculate capitalization, you need to know the exact number of shares issued by it for the entire time, from its entry into the stock market to the current moment. Now such information is quickly found in specialized publications like Reuters, as well as in financial statements published directly by the company itself. This figure is multiplied by the price at which one share is sold.
Let's say you want to calculate how much the stock market currently values Apple Corporation at. As of March 23, 2018, the company had issued 5,074,010,000 shares at a price of $168.39 each. We multiply the numbers and see that the market capitalization of Apple Corporation is $854,412,543,900.
Kinds
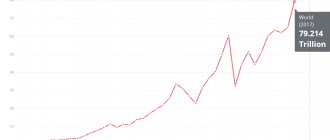
The level of capitalization of an enterprise helps to approximate its size and success in the market. There is a classification of JSCs according to the category of this indicator:
| Capitalization category | Sum |
| Micro | $300 million |
| Low | Up to 1 billion dollars |
| Average | From 2 to 10 billion dollars |
| Large | More than 10 billion dollars |
| Mega | More than 200 billion dollars |
This classification is very conditional; other meanings may occur. Many investors divide companies into three main categories rather than five. But there is an opinion that the above-described segmentation is the most convenient, since investing in enterprises with micro and mega capitalization differs significantly from investing in other companies.
Possible risks are reduced when shares of companies with different levels of market capitalization are included in the investment portfolio.
Market capitalization compared to other valuation benchmarks
Capitalization is a floating short-term figure that shows only how the market values the company at the current time. When calculating it, the internal financial indicators of a particular enterprise are not taken into account. Some investors consider a company's corporate value to be the real value. It includes characteristics such as debt, cash and assets that affect the price that could be charged if the company were sold to another owner.
Another way to assess the value of an enterprise is its book value. This is the amount shareholders can expect to receive if the company is sold completely and all debts are paid off (deducting debt obligations from all company assets). Book value is usually lower than market value because the latter is essentially a forward-looking estimate of value that takes into account the future flow of earnings.
How to determine the market price of goods (works, services)
<< Home
Comparable market price method
The comparable market prices method can be used:
- if the organization has data on several comparable transactions (including among its transactions) and information on the prices used in them;
- if the organization has data on only one comparable transaction with price information. In this case, the financial and (or) economic conditions of such a transaction must either be completely identical (comparable) to the conditions of the analyzed transaction, or comparability is ensured through adjustments.
In addition, the organization that entered into a comparable transaction should not occupy a dominant position in the relevant market of goods (works, services).
This is stated in paragraphs 1 and 2 of Article 105.9 of the Tax Code of the Russian Federation.
Please note that pricing information must be current. Use data that is closest in time to the date of the transaction being analyzed, or information for which it is confirmed that comparable prices were applied in the period in which the transaction was being analyzed. This follows from paragraph 4 of Article 105.9 of the Tax Code of the Russian Federation.
To determine whether the price of the analyzed transaction corresponds to the market level, follow the following algorithm:
- determine the interval (minimum and maximum value) of market prices;
- determine whether the price of the analyzed transaction is in this interval or not.
Determining the price range has some features, namely:
- if an organization has data on only one comparable transaction, then the price of this transaction will be both the minimum and maximum value of the market price (market price interval);
- if stock exchange quotations are used as comparable prices, then the range of market prices will be the minimum and maximum values of prices for identical (similar) goods registered on a certain date;
- if data from information and pricing agencies are used to compare prices, then the market price interval will be the minimum and maximum price values in the corresponding time period specified in the publication.
This is stated in paragraphs 2, 5 and 6 of Article 105.9 of the Tax Code of the Russian Federation.
In other cases, determine the market price interval in the following order.
1. Arrange the prices of comparable transactions in ascending order (from lowest to highest). It is allowed for such a sample to have two or more identical price values.
2. Assign a sequential number to each price, starting with the lowest price.
3. Determine the minimum interval value. To do this, divide the number of price indicators included in the interval by four.
If the division results in an integer, then determine the minimum value of the interval using the formula:
| Minimum interval value (minimum price) | = | (price with serial number N + price with serial number (+1)) | : | 2 |
where N is the number obtained by dividing the number of price indicators by four.
If the division results in a fractional number, then determine the minimum value of the interval using the formula:
| Minimum interval value (minimum price) | = | A price with a serial number equal to the value N, rounded down to the nearest whole number and increased by one, |
where N is the number obtained by dividing the number of price indicators by four.
4. Determine the maximum interval value. To do this, multiply the number of price indicators included in the interval by a factor of 0.75.
If the multiplication results in an integer, then determine the maximum value of the interval using the formula:
| Maximum interval value (maximum price) | = | (price with serial number N + price with serial number (+1)) | : | 2 |
where N is the number obtained by multiplying the number of price indicators by a factor of 0.75.
If the multiplication results in a fractional number, then determine the maximum value of the interval using the formula:
| Maximum interval value (maximum price) | = | A price with a serial number equal to the value N, rounded down to the nearest whole number and increased by one, |
where N is the number obtained by dividing the number of price indicators by four.
This procedure is provided for in paragraph 3 of Article 105.9 of the Tax Code of the Russian Federation.
5. Compare the price of the controlled transaction with the resulting interval. If the price is within the interval, then it is considered market price. If the price of a controlled transaction is below the minimum, then for tax purposes accept the minimum value of the interval. If the transaction price is higher than the maximum value of the interval, for tax purposes, take not the transaction price, but the maximum value of the interval.
This is stated in paragraph 7 of Article 105.9 of the Tax Code of the Russian Federation.
It should be noted that the use of the maximum or minimum value of the interval should not lead to a decrease in tax revenues to the budget (paragraph 4, paragraph 7, article 105.9 of the Tax Code of the Russian Federation). This is a general principle that must be taken into account in all calculation methods.
For example, if the transaction price is higher than the maximum value and the seller decides to apply the maximum value of the interval for taxation, this will lead to a decrease in tax revenue to the budget. Therefore, the seller is obliged to apply the transaction price. To avoid such situations, it is better for the parties to the transaction to agree in advance on a contract price that for each of them will correspond to the market price (i.e., be within the range of market prices).
An example of how to determine whether the price of a controlled transaction corresponds to the market level using the comparable market prices method
During the year, Alpha sold goods to Proizvodstvennaya OJSC for further processing. "Alpha" and "Master" are interdependent persons. Both organizations are registered in Russia, are VAT payers (without exemption) and are not MET payers. The total income from transactions between them, recognized in the reporting year, amounted to RUB 3.3 billion. According to the terms of the transaction, the contract price of the goods sold is 3,000 rubles. per ton. The goods were sold in the amount of 1,100,000 tons.
Since the transaction between Alpha and Master is considered controlled, the contract price of the transaction must be checked for compliance with the market price. For this purpose, Alpha's accountant obtained data on the terms of similar transactions from competitors and compared this data with the terms of the transaction between Alpha and Master. As a result of the market analysis, the accountant had the following comparable price indicators (sample): 2950 rubles/t, 3150 rubles/t, 3100 rubles/t and 3200 rubles/t.
When determining the range of market prices, the accountant arranged price indicators in ascending order, assigning them serial numbers: 1. 2950 2. 3100 3. 3150 4. 3200
The number of price indicators is four, so when divided by four the result is an integer (4 : 4 = 1). To determine the minimum value of the interval, the accountant used two indicators: price with serial number 1 – 2950 rubles/t; price with serial number 2 – 3100 rub./t.
The arithmetic mean of these values is 3025 ((2950 + 3100) : 2).
This indicator is equal to the minimum value of the market price interval.
To determine the maximum value of the interval, the accountant multiplied the number of price indicators included in the interval by a factor of 0.75. The result is the integer 3 (4 × 0.75 = 3).
To calculate the maximum value of the interval, the accountant used two indicators: price with serial number 3 – 3150 rubles/t; price with serial number 4 – 3200 rub./t.
The arithmetic mean of these values is 3175 ((3150 + 3200) : 2).
This indicator is equal to the maximum value of the market price interval.
Thus, the range of market prices for goods ranges from 3025 rubles/t to 3175 rubles/t. Consequently, the price applied in the transaction between Alpha and Master (3,000 rubles/t) does not correspond to the market price. For tax purposes, Alpha must apply a price of RUB 3,025/t (the minimum value of the price range).
During the year, Alpha's accountant used the norms of paragraph 7 of Article 105.3 of the Tax Code of the Russian Federation and calculated income tax based on the contract price of the transaction (3,000 rubles/t). As a result, at the end of the year the tax base for income tax was underestimated. Therefore, the accountant decided to adjust the taxable profit.
The amount of income from the transaction based on the market price of the goods is RUB 3,327,500,000. (3025 rub./t × 1.1 million tons). The accountant took this amount (instead of the amount of 3,300,000,000 rubles) into account as income from sales and reflected it in the income tax return for the year. When calculating income tax for the payment period until March 28 of the following year, the accountant calculated the amount of tax taking into account market income on the transaction.
Penalties on the amount of profit tax on additionally accrued income from sales are not charged (clause 6 of Article 105.3 of the Tax Code of the Russian Federation).
Resale price method
The subsequent sales price method is a priority in a situation where goods purchased under a controlled transaction are subsequently resold without any processing to persons who are not recognized as interdependent (clause 2 of Article 105.10 of the Tax Code of the Russian Federation). In this case, it is necessary to compare the gross profitability of the one who resells the goods with the interval of gross profitability of comparable resale transactions (Clause 1 of Article 105.10 of the Tax Code of the Russian Federation). As a result, it is possible to determine whether the transaction price for the purchase of goods corresponds to the market level.
When determining the gross profitability of a resale transaction, there is one thing to consider. If an organization that resells a product sells it at different prices, it is first necessary to calculate the weighted average price. And based on the price received, determine the gross profitability of the resale transaction.
This is stated in paragraph 3 of Article 105.10 of the Tax Code of the Russian Federation.
To determine the gross margin interval, use the same algorithm as for the comparable prices method. In this case, instead of price indicators, include in the calculation indicators of gross profitability of products sold. Calculate this gross profitability using the formula:
| Gross return on products sold | = | Gross profit | : | Revenue from sales of goods (works, services) |
If, based on the results of the comparison, the gross profitability turns out to be lower than the market one (the minimum value of the interval), then the transaction price for tax purposes will have to be reduced to the minimum value of the interval. When the gross profitability, on the contrary, is too high, adjust the price taking into account the maximum value of the interval. In doing so, adhere to the general principle of transfer pricing for tax purposes.
This is stated in paragraphs 4, 5, 6 and 7 of Article 105.10 of the Tax Code of the Russian Federation.
An example of how to determine whether the price of a controlled transaction corresponds to the market level using the resale price method
During the year, the Alpha organization sold goods to the Master organization for further processing. "Alpha" and "Master" are interdependent persons. Both organizations are registered in Russia, are VAT payers (without exemption) and are not MET payers. The total income from transactions between them, recognized in the reporting year, amounted to RUB 3.3 billion. According to the terms of the transaction, the contract price of the goods sold is 2,000 rubles. per ton. The goods were sold in the amount of 1,100,000 tons.
“Master” resells the goods (without any processing) at a price of 5,000 rubles. per ton to several buyers who are not interdependent persons with the Master organization. The gross profitability of Master's products sold is 0.60.
Since the transaction between “Alpha” and “Master” is considered controlled, it is necessary to check whether the contract price of the transaction corresponds to the market price. For this purpose, Alpha’s accountant calculated the gross profitability of products sold for organizations comparable to Master. He took all the data from the financial statements. Comparable gross profitability indicators were as follows: 0.32; 0.39; 0.35 and 0.41.
When determining the interval of gross profitability, the accountant arranged the obtained values in ascending order, assigning them serial numbers: 1) 0.32; 2) 0.35; 3) 0.39; 4) 0.41.
The number of gross margin ratios is four, so dividing by four results in a whole number (4 : 4 = 1).
To determine the minimum value of the interval, the accountant used two indicators: profitability with serial number 1 - 0.32; profitability with serial number 2 – 0.35.
The arithmetic mean of these values is 0.34 ((0.32 + 0.35) : 2).
This indicator is equal to the minimum value of the gross profitability interval.
To determine the maximum value of the interval, the accountant multiplied the number of gross margin indicators included in the interval by a factor of 0.75. The result is the integer 3 (4 × 0.75 = 3).
To calculate the maximum value of the interval, the accountant used two indicators: gross profitability with serial number 3 - 0.39; gross profitability with serial number 4 – 0.41.
The arithmetic mean of these values is 0.40 ((0.39 + 0.41) : 2).
This indicator is equal to the maximum value of the gross profitability interval.
Thus, the range of gross profitability is from 0.34 to 0.40. The gross profitability of “Master” does not correspond to the market one (0.60 > 0.40). Consequently, the price applied in the transaction between Alpha and Master (RUB 2,000/t) does not correspond to the market price. Based on the maximum profitability value of 0.4, the markup (sales price - purchase price) of the Master organization should be equal to 2000 rubles/t (5000 rubles/t × 0.4).
Accordingly, the market price of the goods in the transaction between “Alpha” and “Master” should be 3,000 rubles/t (5,000 rubles/t – 2,000 rubles/t).
Cost method
The cost method is based on the same principle as the comparable price method - the principle of compliance with a certain interval. The only difference is that the calculations take into account gross cost return indicators. The seller's gross cost margin is compared with the gross cost margin of comparable organizations. The calculation of indicators is made on the basis of financial reporting data, taking into account the features specified in paragraphs 5, 6 and 7 of Article 105.8 of the Tax Code of the Russian Federation.
As a general rule, for comparison it is necessary to take the indicators of at least four organizations. However, if information on such a number of organizations is not available, it is acceptable to use a smaller number of indicators. To calculate gross cost margin, use the formula:
| Gross cost return | = | Gross profit | : | Cost of goods sold (work, services) |
This is stated in subparagraph 2 of paragraph 1 and paragraph 3 of Article 105.8, paragraph 1 of Article 105.11 of the Tax Code of the Russian Federation.
To determine the profitability interval, use the same algorithm as with the comparable prices method. At the same time, instead of price indicators, include profitability indicators in the calculation.
If, according to the calculation results, the seller’s gross profitability is lower than the market one (the minimum value of the interval), the transaction price must be adjusted for tax purposes. To do this, use the actual cost indicator and the minimum interval value indicator. If the actual gross margin is too high, the price is adjusted taking into account the maximum value of the interval. In this case, adjustments must comply with the general principle of transfer pricing for tax purposes.
This is stated in paragraphs 4, 5 and 6 of Article 105.11 of the Tax Code of the Russian Federation.
An example of how to determine whether the price of a controlled transaction corresponds to the market level using the cost method
During the year, the Alpha organization sold goods to the Master organization for further processing. "Alpha" and "Master" are interdependent persons. Both organizations are registered in Russia, are VAT payers (without exemption) and are not MET payers. The total income from transactions between them, recognized in the reporting year, amounted to RUB 3.3 billion. According to the terms of the transaction, the contract price of the goods sold is 3,000 rubles. per ton. The goods were sold in the amount of 1,100,000 tons. The cost of goods sold is 2800 rubles. per ton. Gross cost return – 0.075.
Since the transaction between “Alpha” and “Master” is considered controlled, it is necessary to check whether the contract price of the transaction corresponds to the market price. For this purpose, Alpha's accountant calculated the gross cost return indicators for transactions of comparable organizations. He took all the data from the financial statements. Comparable gross profitability indicators were as follows: 0.062; 0.072; 0.069 and 0.085.
When determining the interval of gross profitability of costs, the accountant arranged profitability indicators in ascending order, assigning them serial numbers: 1) 0.062; 2) 0.069; 3) 0.072; 4) 0.085.
The number of profitability indicators is four, so when divided by four, the result is an integer (4 : 4 = 1).
To determine the minimum value of the interval, the accountant used two indicators: profitability with serial number 1 - 0.062; profitability with serial number 2 – 0.069.
The arithmetic mean of these values is 0.066 ((0.062+ 0.069) : 2).
This indicator is equal to the minimum value of the gross profitability interval.
To determine the maximum value of the interval, the accountant multiplied the number of profitability indicators included in the interval by a factor of 0.75. The result is the integer 3 (4 × 0.75 = 3).
To calculate the maximum value of the interval, the accountant used two indicators: profitability with serial number 3 - 0.072; profitability with serial number 4 – 0.085.
The arithmetic mean of these values is 0.079 ((0.072 + 0.085) : 2).
This indicator is equal to the maximum value of the gross profitability interval.
Thus, the range of gross profitability of costs is from 0.066 to 0.079. The seller's gross profitability corresponds to the market (0.066 < 0.075 < 0.0079). Therefore, the price applied in the transaction between Alpha and Master (3000 rubles/t) also corresponds to the market price. The accountant did not adjust the transaction price for tax purposes.
Comparable profitability method
The comparable profitability method is generally identical to the cost method. There are only two differences. Firstly, based on the results of the comparison of profitability, it is not the transaction price that is adjusted (if necessary), but the profit (income, revenue) from it. Secondly, any of the following market profitability indicators are used for calculation:
— profitability of sales;
— profitability of costs;
— profitability of commercial and administrative expenses;
— return on assets;
- another indicator of profitability.
To calculate indicators, use the following formulas:
| Return on sales | = | Revenue from sales | : | Sales revenue (net of VAT and excise taxes) |
| Cost return | = | Revenue from sales | : | Cost of goods sold (work, services) | + | Commercial and administrative expenses associated with the sale of goods (works, services) |
| Profitability of commercial and administrative expenses | = | Gross profit | : | Commercial and administrative expenses associated with the sale of goods (works, services) |
| Return on assets | = | Revenue from sales | : | Current market value (in the absence of information - book value) of current and non-current assets that are directly or indirectly used in a controlled transaction |
Such rules are established by paragraph 1 of Article 105.8 and paragraph 3 of Article 105.12 of the Tax Code of the Russian Federation.
Select a specific profitability indicator for the purpose of comparison, taking into account the features specified in paragraphs 4, 5, 6 and 7 of Article 105.12 of the Tax Code of the Russian Federation.
An example of how to determine whether the price of a controlled transaction corresponds to the market level using the comparable return on sales method
The Alpha organization sold goods to the Master organization for a year. "Alpha" and "Master" are interdependent persons. Both organizations are registered in Russia, are VAT payers (without exemption) and are not MET payers. The total income from transactions between them, recognized in the reporting year, amounted to RUB 3.3 billion. According to the terms of the transaction, the contract price of the goods sold is 2,000 rubles. per ton.
The goods were sold in the amount of 1,100,000 tons. Return on sales – 0.30. Profit – 660,000,000 rubles. Thus, the actual return on sales was 0.30 (RUB 660,000,000: 1,100,000 t × RUB 2,000/t).
Since the transaction between “Alpha” and “Master” is considered controlled, it is necessary to check whether the contract price of the transaction corresponds to the market price. For this purpose, Alpha's accountant calculated the profitability of sales of comparable organizations. He took all the data from the financial statements. Comparable indicators of return on sales were as follows: 0.32; 0.39; 0.35 and 0.41.
When determining the range of profitability of sales, the accountant arranged profitability indicators in ascending order, assigning them serial numbers: 1) 0.32; 2) 0.35; 3) 0.39; 4) 0.41.
The number of profitability indicators is four, so when divided by four, the result is an integer (4 : 4 = 1).
To determine the minimum value of the interval, the accountant used two indicators: profitability with serial number 1 - 0.32; profitability with serial number 2 – 0.35.
The arithmetic mean of these values is 0.34 ((0.32 + 0.35) : 2).
This indicator is equal to the minimum value of the return on sales interval.
To determine the maximum value of the interval, the accountant multiplied the number of profitability indicators included in the interval by a factor of 0.75. The result is the integer 3 (4 × 0.75 = 3).
To calculate the maximum value of the interval, the accountant used two indicators: - return on sales with serial number 3 - 0.39; — profitability of sales with serial number 4 – 0.41.
The arithmetic mean of these values is 0.40 ((0.39 + 0.41) : 2).
This indicator is equal to the maximum value of the return on sales interval.
Thus, the range of return on sales is from 0.34 to 0.40. The seller's return on sales does not correspond to the market (0.30 < 0.34). Consequently, the price applied in the transaction between Alpha and Master (RUB 2,000/t) does not correspond to the market price. For tax purposes, Alpha's accountant adjusted the profit on the transaction with Master based on the minimum profitability value of 0.34. As a result of the adjustment, the profit amounted to RUB 748,000,000. ((1,100,000 t × 2,000 rubles/t × 0.34). The accountant additionally included 88,000,000 rubles in non-operating income (748,000,000 rubles – 660,000,000 rubles).
Profit distribution method
The essence of the method is that the actual distribution of profit between the parties to a controlled transaction is compared:
- or with the distribution of profits between the parties to a comparable transaction;
- or with an estimated distribution of profits between the parties to the same controlled transaction.
This method can be used in two versions: distributing the total profit of the parties to the transaction or distributing the residual profit of the parties to the transaction (clause 6 of Article 105.13 of the Tax Code of the Russian Federation).
To use the first option, it is enough to determine the amount of total profit - this is the sum of the operating profit of all parties to a controlled transaction for the analyzed period (clause 7 of Article 105.13 of the Tax Code of the Russian Federation).
In the second option, it is additionally necessary to find the residual profit indicator. To do this, use any of the considered methods (except for the profit distribution method) to determine the estimated profit (loss) of each party to the controlled transaction. Then add up the resulting indicators. The result of the addition must be subtracted from the total profit. The remaining amount will be the residual profit (loss). This procedure is provided for in paragraph 8 of Article 105.13 of the Tax Code of the Russian Federation.
Distribute the total (in the second option, residual) profit taking into account the degree of participation of each party in the controlled transaction. In turn, determine the degree of participation of the parties based on indicators that affect the amount of profit (loss) for a controlled transaction. An approximate list of such indicators is given in paragraph 10 of Article 105.13 of the Tax Code of the Russian Federation.
Among them:
- the amount of costs for the creation of intangible assets used in the transaction and affecting its financial result;
- characteristics of personnel (number, qualifications, labor costs, amount of labor costs);
- the market value of assets used in the transaction and affecting its financial result.
After distribution of profit (total - according to the first option, residual - according to the second), taking into account the degree of participation of each party to the controlled transaction, the calculation according to the first option is ready. And for the second option, only one of the indicators is ready - the residual profit of each of the parties to the transaction.
When calculating according to the second option (distribution of residual profit), you additionally need to find the total profit of each party to the transaction. To do this, for each side of the transaction, add up the residual profit and the estimated profit, respectively (clause 9 of Article 105.13 of the Tax Code of the Russian Federation). In this way, the necessary indicators for comparison under the second option will be determined.
After this, you need to compare the actual distribution of profit (loss) with the calculated one. If the actual profit (loss) of a controlled transaction differs from the calculated ones, adjust the tax base for income tax in accordance with the procedure set out in paragraph 13 of Article 105.13 of the Tax Code of the Russian Federation. In this case, adjustments must comply with the general principle of transfer pricing for tax purposes.
How can you artificially regulate a company's market valuation?
Market capitalization rises and falls based on factors that may actually have nothing to do with the internal processes of the company. Such as supply or demand. For example, if investors invest in index mutual funds, these funds require buying shares in the corresponding index. This leads to an increase in share price. Otherwise, general panic in the stock market may lead to a decrease in the price of the company’s shares, although the internal value of the “cheaper” company shows a different dynamic.
Source
Use when investing
Market capitalization is a convenient investment tool that allows you to assess the scale of an enterprise. Enterprises with a value of more than $10 billion are the dominant industrial players with consistent revenues. A strong contrast between such companies are small organizations that are valued by the stock market at up to $2 billion and young aggressive startups, investments in which have a wide amplitude of risk/reward. Medium-risk shares are offered by organizations located between giant enterprises and small firms.
When calculating capitalization, the benefits and risks of investing in shares are assessed without analyzing the balance sheet, residual assets after paying off debts and total debt. Please note that:
- Large capitalization companies are considered stable, able to use many sources of financing, pay dividends relatively regularly, but do not have the potential for growth;
- Small-cap stocks have the potential to grow, but investing in their stocks is risky. At the same time, dividends may be low or not paid at all;
- Mid-capitalization organizations have an intermediate position between the two categories above.