Based on numerous requests from traders.
Hello, friends! Today we will talk about one way to find out what positions large speculators and investment funds take. After all, as you know, the Forex market is driven by money. Namely, big money. More precisely, we will talk about the analysis of COT (Commitments of Traders) reports provided by the CFTC (US. Commodity Futures Trading Commission). From the material below you will learn: what kind of reports these are, when and where to get them, and most importantly, how they can help us in trading.
How to understand market sentiment
This is the main task of a trader, the eternal search for who is at the helm - bears or bulls. To determine the market trend, we use a lot of tools, however, indicators are based on past data, trend lines, support/resistance and other tools are also not made of reinforced concrete. Here a whole class of methods comes to the rescue, based on direct assessment of the mood of market participants, without any intermediaries.
For stock markets, such a tool has long existed - trading volumes. They are always available and open; a trader can see at any time how many other traders bought or sold a particular asset. If price rises but volume falls, this is a popular overbought signal. Conversely, if a falling price suddenly reverses on high volume, this is a signal for a trend change.
There’s just one problem: we’re not in the stock market. The real forex currency market, also known as the interbank market for foreign exchange transactions, does not have data on volumes. Because currencies are not traded on exchanges and accurate data on these trades was not supplied. Banks trade through many ECN systems, through anonymous dark pools and other strange things. There are no volumes in Forex - this is an axiom. Any volumes for currency pairs are simply synthetic, a conditional oscillator.
But real statistics are available on stock exchanges such as NYSE, CBOE, CME, etc. Why not use it? This is where such a cool exchange tool as Commitment of Traders (COT) comes to the rescue, which roughly translates as “trader sentiment.”
COT reports
From these reports we can find out what position major Forex players currently occupy. And, using this data, make more informed decisions about your own entries and transactions to analyze the current trading situation on the market.
So why do we need major player movements? The fact is that the market is driven by money. And big money drives it. Naturally, we won’t change anything with a lot of, say, 0.1. But the big players: large traders, investment funds, banks, etc., pouring hundreds of millions of dollars into the market, cause significant movements. And going against such force is often unwise. Therefore, it may be useful for us to know which side of the market the “big guy” is on.
COT as CFTC report
What is COT? This is a report from the CFTC (Commodity Futures Trading Commission), which comes out weekly, every Tuesday. In terms of time, this is GMT -5 in winter and GMT -4 in summer, where GMT is Greenwich Mean Time.
This report provides complete information on the positions of all participants in the futures market, be it large speculators, commercial traders and any small riffraff that also works with the market. By observing the behavior of these guys, we can get a clear picture of what is happening with the foreign exchange market.
Hey, wait a second, you ask. Futures market? Futures on real exchanges... have arrived. Why the hell do I need this data if I, like an Abyzian, recklessly press the Up/Down buttons in binary and Forex, drawing various crooked things on the chart? Does what happens on stock exchanges somehow affect currencies that, as you know, are not traded on exchanges?
Now attention. There is no data on volumes in Forex. But they are... in futures. Including - watch your hands - in currency futures. On real exchanges, it is not the currencies themselves that are sold and bought, but futures and options contracts on them. This is the most direct connection with the foreign exchange market.
By observing how the major players deal with currency futures, we can get a clear picture of the market sentiment for our currency pair. This clue is the Commitment of Traders report, which we will now deal with.
Open the COT (Commitment of Traders) report
First, let's open the report itself and look at it. Official address:
https://www.cftc.gov/MarketReports/CommitmentsofTraders/index.htm
Below you will see a bunch of signs, scroll down. We want the Chicago Mercantile Exchange row, where in the Futures only column we'll click on the Short Format column.
A completely hellish-looking table will open. But there’s no need to be scared, we’ll figure it out now:
Yes, in the 21st century, data in this format... well, the CFTC clearly employs sadists who print this information on dot matrix printers. It doesn’t matter, fortunately, with the help of Ctrl + F we can easily find what we need.
Let's find, say, the Russian ruble. Press Ctrl + F (browser search), enter Ruble and here it is (shock, someone on the American CME buys and sells ruble futures, spiritual bonds are in danger):
Or Canadian dollar:
Now we just have to figure out what this plate shows. There is nothing complicated there. Let's look at the example of the Japanese yen:
- Commercial : These are large speculators, commercial traders. Big guys. They use these currency futures to protect against excessive fluctuations in exchange rates.
- Non-commercial : Individual traders, hedge funds and financial institutions here. As a rule, these are ordinary speculators. In short, our people.
- Long : number of contracts to buy (long).
- Short : number of contracts to sell (shorts).
- Open interest : The number of contracts that have not yet been executed.
- Number of traders : The total number of traders that report their trades to the CFTC.
- Reportable positions : the number of open positions in options and futures that are required to be reported to the CFTC by regulation.
- Non-reportable positions : the sum of long/short positions for previous (reportable) positions is subtracted from the total open interest. The resulting number are traders, which according to the classification do not belong to the already mentioned types. That is, the smallest thing.
How to analyze all this?
It is worth paying attention to the situation as a whole. That is, watch for hedgers (Commercials) and large speculators (Large Speculations), as well as small speculators. First of all, I want to warn you that using the COT index as a separate system is incorrect.
If you rely only on COT reports, then you are unlikely to be able to trade profitably based solely on this information. It happens that the signals are false, and you will have to trade on weekly charts. Recognizing this requires a great deal of training and experience. Plus the time factor. You will have to hold the position for a very long time and use huge stop losses.
Therefore, I advise using COT reports as a filter to your system. That is, assess the situation using technical analysis, and check transactions and the general state of the market using COT reports. In this case, you need to use all the information, not just some specific group of traders. And also pay attention to open interest, that is, how hot the market is.
Open interest is located at the bottom of the chart as a histogram. Let me remind you that OpenInterest is the amount of money in the market. Let's look at an example of what happened in the market. I draw your attention to the points when open interest is in critical positions. That is, either he is very low or high.
How high and how low we can only determine by looking at the graph as a whole. At these points we pay attention to what the other groups of speculators are doing. Namely, large hedgers (Commercials) and small players (Small Speculations).
As you can see from the picture above, low Open Interest is similar to a flat; the lack of liquidity does not allow any of the participants registered in COT to gain large positions in the euro.
The chart further shows that the situation of low volumes in futures and options was the “calm before the storm.” The Brexit referendum, the US elections, and the Fed's policy reversal caused strong movements on Forex, which was reflected in active trends and increased liquidity.
Critically high open interest means the market is overheated. Hedger positions (Commercials) are below. The positions of large (Large Speculations) and small traders (Small Speculations) are at the peak of purchases. What could happen here? Small speculators can easily be put under the knife. Large speculators are likely to take profits by selling their positions to small speculators who will be willing to buy them. There is too much money, the potential for growth is currently exhausted.
The fall of the euro is not long in coming: small speculators (Small Speculations), as always, did not guess the movement, large players and hedgers “exchange” volumes, the indicator curves meet each other halfway, some positions go into the cache, which is reflected in the fall in Open Interest.
The positions of hedgers (Commercials) and speculators (Large Speculations) can also be used as signals of overbought or oversold. The minimum and maximum values of accumulated futures volumes often coincide with an abnormal rise or decline in Open Interest.
As can be seen from the figure below, they accurately predict changes (reversals) in the exchange rate of a currency pair.
The main thing is to remember the rule: large speculators (Large Speculations) always increase long positions according to the trend of the pair’s exchange rate. Hedgers always go against the trend. Small traders are almost always victims - they are often wrong, but the indicator curve must be traded in a system against the crowd, so sometimes they can be quite useful. That's all.
COT Charts
Where can you see abbreviated data about these positions directly on the chart? Sometimes you can’t do without tables, but graphical display is often enough. There are some great resources.
TimingCharts
Located at https://www.timingcharts.com/
In the menu at the top, click on the COT button and customize the chart to your liking, say candles and a light theme.
On the side you select which data should be displayed. You can leave it as default. Choose as in the screenshot – Futures Only and Net Positions. Click the COT button again to close the side menu.
In the Symbol menu, select the desired currency.
Lines on the graph:
- blue - Commercial;
- green - Non-commercial Large (large players);
- red - Non-commercial Small (small players).
We’ll talk about exactly how to use these lines and what kind of players these are a little later.
FinViz
Another graph showing COT data. Located at https://finviz.com/futures_charts.ashx?t=6E&p=d1
Here:
- green line - Commercial (hedgers);
- red - Non-commercial (large speculators);
- blue - Non-reportable (small speculators).
Oanda
The chart is located at https://www.oanda.com/forex-trading/analysis/commitments-of-traders . Oanda immediately displays Non-commercial positions from large speculators. Those who do not need futures and options to hedge their transactions.
They close/open positions when they need to make speculative profits, not like some long-term hedgers.
Well, open interest is shown below - the total number of purchase/sale contracts, without dividing them into their types. In essence, this is a real volumetric indicator.
Tradingview
Thanks to Tradingview's partnership with data provider Quandl, much of the data from the COT tables is available in graphical form.
Using the link https://blog.tradingview.com/?p=472 you need to select the appropriate report option, say, COT (Legacy): Noncommercial Interest Change (contracts of large speculators).
At the bottom of the chart, click on the Add to Favorite Scripts button and the script will appear in your favorite library:
And here it is on the chart. In the settings, uncheck the unnecessary boxes, leave Net (total value) or Long/Short (number of long/short contracts):
How to find out the positions of major players?
One way is through COT reports provided by the US CFTC.
The US CFTC is an organization that ensures that there are no violations in trading in the futures market. And all major players in the futures market report to this organization. In turn, this commission makes publicly available reports called “Commitments of Traders”. We can simply go to their website and view these reports without any hindrance. This is free information in the public domain. Naturally, these reports are from the futures market. And the futures market is not all players in the foreign exchange market. But even from these data we can draw quite significant conclusions.
What Happens in a COT Report
Let's now figure out who all these Commercial/Non-commercial are, what they do on CME and why it will be useful for us to monitor their activities.
We have already figured out that the report displays three types of traders:
- Commercial: hedgers;
- Non-commercial: large speculators;
- Non-reportable: small speculators.
Let's wash the bones with them.
Commercial: Masters of Hedging
Hedgers do not work with options and futures to make speculative profits. They don't play on the markets. These guys need hedging - protection of colossal capital from unexpected price movements.
Let's say, such commercial market participants are farmers and agricultural companies that insure themselves against changes in prices for their goods, be it grain or soybeans. There are also the world's main banks and transnational corporations, which protect themselves from sharp changes in exchange rates.
The main thing you need to understand about these guys is that they are bulls at the bottom of the market and bears at its peak.
How does hedging work?
Let's look at a simple and understandable example. Let’s imagine that some American company needed a product from Japan, geisha or sushi, it doesn’t matter. The main thing is that you will have to buy often and a lot, and pay by buying yen for dollars, because the customer is from the USA.
It takes six months to train a good geisha. Therefore, the American customer says to the Japanese: “Listen, those who like to pester schoolgirls in the subway, I need a guarantee that it’s not in vain that we’ll wait six months for your Japanese beauties. Therefore, we will conclude a contract now and pay in six months, when they are ready. And we will pay, of course, in yens.”
At the same time, the company knows that if the USD/JPY rate falls (that is, the yen strengthens), the geishas will cost them more in dollars than when concluding the contract. To protect itself, namely, to hedge its currency risk , the company buys yen futures on the CME exchange.
If the USD/JPY rate falls in six months, the company will make money on futures on the strengthening of the yen and thereby reduce its dollar losses on the geisha delivery contract.
Hedging is a simple instrument: when the price of one instrument falls, it is compensated by an increase in the price of another.
If everything happens the other way around and USD/JPY rises, which means that geishas will cost less, then the fall in their prices will compensate for the losses on the futures contract.
Non-commercial: large speculators
But speculators do not hedge anything; they are not interested in it at all. They are only interested in money and nothing else. Money, money, rubbish money - that's all they need. They don't need the commodity futures, just the price.
These guys love trends as they often buy on uptrends and sell on downtrends. They increase the size of their market positions until the market finally turns around. These guys always have hefty deposits, because they speculate on the futures market on a large scale.
As a result of their actions, the futures market often unfolds in the most dramatic way. By the way, large speculators love moving averages, because they work according to trend strategies (note to the hostess).
Non-reportable: small speculators
Well, these are small traders. These are small hedge funds and just guys like you and me (very small fish). They are always in a hurry and often enter against the trend and generally against the market. And therefore, by the way, according to statistics, they are much less successful than hedgers or large speculators.
However, if they do follow the trend, they prefer to open positions at the top/bottom of the market positions, because they love support/resistance lines.
Introduction
It is no secret that movements occurring in financial markets largely depend on the actions of major participants, professionals, who often have the opportunity and desire to influence the market situation. In medium- and long-term trading, when positions are held for weeks or months, it is important to understand in which direction large players are holding positions, whether they are increasing them, or, on the contrary, gradually reducing them. The price movement chart does not reflect this information, and its shape is a consequence of the actions of market participants. CFTC reports dismantle the reasons for the formation of price movements.
This additional dimension in analytics helps the trader make more informed decisions about the reasons and possible direction of further price movements. Compared to small traders, large traders always have more valuable information and express their opinion about the market by selling or buying. Because of this, CFTC reports are invaluable. At the same time, as experience shows, most traders do not take them into account in their trading practice because they are not aware of their existence. CFTC statistics will allow you to understand the opinion of major players about the trends prevailing on the daily and weekly timeframes.
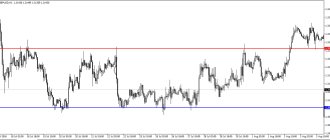
Rice. 1. Large speculators have been selling the pound since the beginning of June, the market is declining
Private traders have the opportunity to see statistics on transactions of large speculators for most financial instruments (commodity and currency markets, stock indices).
This information allows you to more accurately determine:
- “false” breakouts
- direction of market exit from flat or triangle
- trend strength - the opinion of major players about the prevailing trend in the market
- points of origin of new trends
How to use Commitment of Traders charts
As we already understood, COT reports are released weekly, so their main purpose is to determine long-term market trends. What you need to work with multiframe analysis. The main method of using COT reports in our trading is to search for extreme points, strong positions open for market growth or decline (long/short).
Finding such positions is a good signal that the market will reverse. Because if everyone is selling currency, who, sorry, will ultimately buy it? A buyers/sellers bias will begin, which leads to a reversal of the market trend.
And vice versa, everyone buys - there is no one to sell. This is exactly what we can see in the graphs. Below we will use the Timing Charts for examples.
At the top we have the price, at the bottom we have data on the positions of hedgers and speculators. Let's remember:
- blue line - hedgers;
- green - large speculators;
- red - small speculators.
We are not interested in hedgers, nor are small speculators; they do not influence anything. What are we always looking at then? To the green line. COT reports are used mainly to track the positions of large speculators:
You can also leave only this to make it really good:
Bah, you say. Yes, this reminds me... of an oscillator. But unlike an oscillator built on a synthetic formula, here we are dealing with real trading data, real exchange volumes.
When the green line is at the very bottom of the chart, it means that the number of short positions (down) is increasing. There are more and more of them, market participants are selling and shorting. This game cannot go on forever, and as market sentiment changes, the number of contracts to go long increases. Accordingly, the price turns around.
In fact, we can use the COT report data as a banal oscillator in overbought/oversold zones. It perfectly shows market sentiment. Like any oscillator, this data should not be taken blindly - always use basic technical analysis tools to interpret this data.
Discrepancy between two indicators
Now let's return the blue line to the chart. We are also very interested in the situation where the green and blue lines diverge radically, like this:
If hedgers and speculators disagree, great, this is a good signal for a reversal. Hedgers, remember, buy at the bottom of the market, and speculators sell along the trend when the market is already falling.
Conversely, hedgers start shorting when the market approaches its high, while speculators buy with the trend.
Eventually:
- speculators point to a trend;
- hedgers for its reversal.
If hedgers are constantly buying (increasing long positions), and speculators are constantly selling (short positions), then somewhere out there a reversal of the general trend upward is looming. And vice versa, hedgers sell (short), speculators buy (long) - the market is heading towards a downward reversal.
Yes, using this data it is not so easy to find the exact turning point - here you will have to use all the skills that you learned at School. Just don't forget that speculators are good at following a trend, but they are always wrong about its reversal. And it’s exactly the opposite with hedgers - a reversal is much easier for them than working with the trend.
Therefore, depending on your strategy, you can use this data to your advantage. Are you following the trend? Make friends with speculators, use technical analysis, candlestick patterns to find the exact entry zones along the trend - usually on pullbacks.
At the same time, do not forget that the mere fact that the indicator is in the overbought/oversold zone does not mean that the market will reverse instantly. This is a general indicator of mood, it is called market sentiment, where sentiment is precisely “mood.”
Traders in Financial Futures Report (TTF)
TTF data allows you to make a more detailed analysis of the interests of large players, which can be useful for trading stocks, indices and commodity futures:
TFF report data.
- Dealer/Intermediary - analysis of COT reports classifies this group of market makers as “Sell Side”. Their main activity is executing orders to buy from other participants for a certain commission or spread. Typically these are large investment funds, commercial banks and dealers that sell structured instruments that provide maximum risk diversification. They see almost all positions on the market, including deferred ones, so they can perform the most effective inter-market analysis. A change in their open interest is the strongest signal of future trends. Analysis of COT reports classifies the following three categories as “Buy Side” and they are clients of the first group:
- Asset Manager/Institutional – institutional investors and managers: pension funds, insurance companies, mutual funds and other private holders of external assets. The main task is to preserve funds with moderate profits.
- Leveraged Funds - analysis of COT reports on henge funds, licensed trading consultants for exchange-traded products (CTA, Commodity trading advisor) and trading pool operators (CPO, Commodity pool operator), providing support for export/import operations of organizations and not having direct access to the exchange . The CFTC also includes speculative traders and prop departments of investment banks focused on maximizing profits from trading, arbitrage and swap transactions.
- Other Reportables - analysis of COT reports classifies into this category organizations that use the exchange as a means of hedging banking, trading and industrial business risks: central banks and treasuries, credit and mortgage organizations.
The classification of an organization may change when the next COT report is released for a number of reasons: a new strategy affecting adjacent market segments, an expansion of the range of trading instruments, additional information that, in the opinion of the Commission, changes the rating and status of an exchange player, and other factors.
In addition, the total number of participants in each CFTC category is generally larger than the reporting entities. This is due to the fact that the same player can simultaneously hold both short and long positions, work with swaps or provide hedging for commodity transactions. This factor should be taken into account when analyzing, especially the dynamics of speculative positions.
Click the button to go through a step-by-step guide to “COT Reports” and master this tool in a few simple steps Explore »
Percentage of speculative positions
As we remember, simply finding the line up/down gives only an idea, but not a direction, so we need something more precise.
For example, you can calculate the percentage of speculative long/short positions, which will allow you to better understand where the market is, at its bottom or peak. To do this you need an extremely simple formula:
Let's look at the example of Canadian dollar futures. As we can see, on August 19, 2008, speculators shorted 28,085 more contracts. We arrived at this number by taking the number of Non-commercial short contracts for that day (66,726) and subtracting the number of long contracts from it (38,641).
Then, on March 20, 2009, they shorted less - only 23,950 contracts. All hints are that the market bottomed in August because more people were shorting it then, but... is it really that simple? Not at all.
Let's look at the main statistics, for which we will download the Excel file for that year.
We need the NonComm_Positions_Long_All and NonComm_Positions_Short_All columns.
In total (large + small speculators) on August 19, 2008, 66,726 contracts were opened short, and 38,641 contracts were opened long, for an increase.
According to the formula, we get that of all open speculative positions, 63.3% were opened down ((66726 / (38641 + 66726)) = 0.633 = 63.3% .
On March 17, 2009, 8,715 up trades were opened, and 32,665 down trades. A simple calculation gives us 78.9% ((32655 / (8715 + 32665)) of speculative down positions.
What does this mean? The fact that the chances of a market bottom are clearly higher at 78.9% than at 63.3%, right? This is what we see, in the end, on the graph.
It’s not surprising, because a simple formula based on real volumes gives us the market ratio of bulls and bears.
Linking COT and currency pairs
Don't forget that on the COT charts you see the volumes of futures contracts for one currency. This is not a quote for currency pairs. The scale on the side shows the number of contracts on a relative scale. The “bottom of the market” and the “market” in general should be understood as the market for currency futures contracts on the CME exchange.
As we know, CAD in Forex is traded in conjunction with a lot of other currencies. However, it is worth nothing to look at a chart of, say, USD/CAD over the same period. We will immediately see all CAD journeys that were tracked through COT volumes.
As we can see, after the “true bottom” according to COT data, a multi-month strengthening of CAD began. I think it goes without saying how valuable a tool such data can be and how it can complement technical analysis.
For example, here we clearly see a clear bearish divergence in stochastics, which directly affects COT volumes.
Commitments of Traders indicator for Metatrader 4
When trading through MetaTrader, I want to simplify the process of using COT data as much as possible, which is understandable.
Previously, such indicators could be downloaded for free from the MQL library, however, COT is constantly changing the data format and such indicators quickly become outdated.
Now all COT indicators for MT4 are mostly paid, or are ordered from programmers purely for their own needs.
Is this necessary? The free sources described above are quite sufficient. The indicator in MT4 will be needed for scalping when there is no time to be distracted, but scalping and such data? No, this makes no practical sense. In the end, there is no point in paying for such an indicator for MT.
COT practice
Remember that this data provides excellent hints, but not an indication of an exact reversal. Sometimes COT data gives an incredibly juicy and sweet reversal signal, sometimes it’s just an assumption that needs to be clarified with other tools.
Fundamental analysis is very valuable here. What about key rates? With inflation? Is the economy growing or declining? Professional traders, whose data we observe in the Commitment of Traders, focus strictly on basic economic indicators when opening their positions. And you should do the same by following them.
Study COT volumes, learn to see the correlation between them, economic data and graphical analysis. Remember that the market is a cauldron in which millions of people are boiling. They all react to the economy, politics and a nagging wife, they are emotional and constantly greedy. Use the Commitment of Traders as a useful tool to get inside their heads and see where they're going with this.
- Back: News Trading
- Next: Dollar Index
Why are COT reports released a week late?
The largest participants in the oil, dollar, S&P and bond markets report their positions every day. The CFTC's net speculative position totals are released on Tuesday, but the COMMITMENTS OF TRADERS REPORT itself is typically released on Friday, although due to holidays, release dates may vary. The website has a release schedule for reports. Thus, we receive data a week late, but actually for the last week, and not for the current one.
It is worth noting that the report covers not only futures, but also options.