About company
Shareholder structure of FGC UES FGC UES is a federal grid company of the unified energy system, a subsidiary of .
More than 80% belongs to Rosseti.
FGC UES was created in 2002 as a result of reforming the electric power industry of the Russian Federation.
Federal Grid Company FGC UES is an energy company that manages and transmits energy through the unified national electrical grid of Russia. In this type of activity, the company is a subject of a natural monopoly.
FGC UES is also involved in:
- sale of electrical energy to wholesale market entities
- sale of services for connection to the electrical network
- maintaining electrical networks in proper condition
- technical supervision of the condition of network facilities
FGC UES operates in 80 regions of the Russian Federation. It is the world's largest public utility company in terms of line length and transformer capacity.
Brief description of the issuer
FGC UES is the operator of the Unified National (All-Russian) Electric Network (UNEG).
The length of power transmission lines is 148.6 thousand km, transformer capacity is 352.2 GVA. In 2021, it came under the operational control of the parent company of the Rosseti holding. We assume that after the merger of the executive offices of Rosseti and FGC UES, the creation of a common treasury may follow. The transition to a single share or the repurchase of FGC UES shares may occur during the planned additional issue of Rosseti in 2022, and until then FGC UES will probably remain a public subsidiary.
Capital structure . The controlling stake, 80.13%, belongs to the state. The Federal Property Management Agency holds 0.59% of the shares. The company has issued ordinary shares and GDRs and is listed on the London Stock Exchange. Free float of ordinary shares - 18%.
Company operating results
From its establishment in 2002 until 2014, the company quite actively modernized its facilities, re-equipping it with new equipment and increasing capacity. Over these years, the number of FGC UES substations has increased by 7.5 times, and the length of power transmission lines has increased by 3.5 times.
Operating indicators of FGC UES for 2015-2020
This pace has been lost in the last 5 years. The company's operating performance is currently stagnating.
Owners and management
As of 2021, 80.13% shares
Owns the corporation:
- PJSC Rosseti (80%).
- Rosimushchestvo (0.58%).
- Minority shareholders (19.3% shares).
There are nine MES divisions in the corporation structure:
- East.
- Siberia.
- Western Siberia.
- Ural.
- North-West
- Center.
- Volga.
- South.
In each there are up to eight MES enterprises.
Company financial results
Financial results of FGC UES for 2011-2020
Despite the stagnation in the company's operating results, after the fall in 2012, FGC UES is slowly but surely increasing its equity capital. In absolute terms, the company's liabilities do not decrease and remain within 370 billion rubles. But due to capital growth, the ratio of the company's liabilities to total assets decreases.
There is a fairly positive trend.
Shares on the stock market
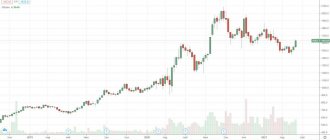
FEES shares are trading better than the Russian electricity index, but are noticeably lagging behind the market. We see the reasons for the lag as increased inflation expectations, which, without control of operating expenses, can lead to a decrease in the profitability of tariff companies, as well as positive investor sentiment regarding export cyclical companies.
Source: Reuters
Company's debt load
A company's debt load is a very important factor for an investor.
Debt load of FGC UES for 2011-2020
Everything is pretty good here. Starting from 2021, the net debt of FGC UES has been decreasing, albeit at a slow pace. Based on the results of the 3rd quarter of 2020, it amounts to 178 billion rubles.
The DEBT/EBITDA indicator is very comfortable - 1.35. This is normal service level.
The company has almost 25 billion in cash on its balance sheet.
How to buy energy stocks
Buying energy stocks is easy. For this it is enough:
- Choose a broker.
To buy shares of Russian energy companies you need a reliable broker that provides access to the Moscow Exchange. At the moment I am trading through Tinkoff Investments. this broker for long-term investors in Russian stocks. Why - read the article “ Tinkoff Investments reviews ”.
At the moment I’m thinking of testing VTB Investments (they also have a mobile application + good reviews from investor friends) and Alfa Direct. As soon as I test the companies, I will immediately publish a review.
According to the Moscow Exchange rating, the leading companies are:
reviewed the Finam broker earlier and even traded through them at the beginning of 2021, but the company has more disadvantages than advantages.
- Apply for opening an account by uploading the necessary documents.
- Wait for the documents to be verified and a brokerage or individual investment account .
- Download the application or terminal for trading shares and familiarize yourself with the functionality. Almost all companies have a video on working with the terminal, where they tell you how to make transactions, select stocks, place protective and pending orders.
- Select shares to buy.
These articles will help you with this:
- Russian dividend stocks
- What stocks to buy in a crisis
- How to trade stocks
When the shares rise in price, all that remains is to take profits.
Company cash flows
Cash flows of FGC UES for 2011-2020
The revenue of FGC UES grew exactly until 2021. This is due to the increase in operating performance in previous years. But since 2021, the company has been in complete stagnation. Revenue is not growing, and net profit has been declining since 2017. However, the situation with free cash flow has improved slightly, which over 3 years has grown by more than 30% compared to the 2021 level.
Operating profit and EBITDA of FGC UES for 2011-2020
If you look at operating profit and EBITDA, the situation is similar - stagnation lasting 5 years.
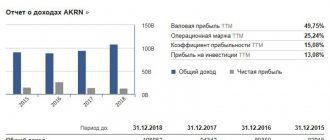
Analysis of the revenue structure of FGC UES for 2019-2020
At the end of 9 months of 2021, FGC UES increased revenue by 1.6% in annual terms, but lost 4.6% in annualized adjusted net profit.
Or use your account
Search for quotes:For example: Gazprom | the usual flight of a log over a cliff |
| Who cares, remember when the annual report will be? |
| Until 30.03 RAS Until 30.04 IFRS.. |
| Did you check out the lovely and usual March snot they drew for us yesterday on our *Aries’ chart? Last year these days we were at the peak, apparently the same scenario is repeated year after year, only thinner and lower. By the way, the 3rd red monthly candle in a row is looming. The last time this happened was in 2015. Oh yes, a piece of paper. And it’s also surprising that despite all the “investments” (including digitalization and automation of everything) – the date for reporting (the end of March!!!!) does not move to the left in any way. Apparently they spend 3 months on accounting. fraud in terms of leading to the agreed and required top financial results. |
| one thing is reassuring that there are no dolls |
| It looks like 21 cops will also break through and go down. |
| m03/05/2021 13:03:11 FGC UES REDUCED NET PROFIT ACCORDING TO RAS IN 2021 TO RUB 39.97 BILLION – COMPANY |
| RUSSIA-FSK-RAS 03/05/2021 13:09:07 The net profit of FGC UES according to RAS in 2021 decreased to 39.97 billion rubles, EBITDA - to 126.6 billion d Moscow. 5th of March. INTERFAX – The net profit of PJSC FGC UES (MOEX: FEES) under RAS in 2021 decreased by 31.3% compared to 2021, to RUB 39.97 billion, the company reported. EBITDA decreased by 2.2%, to RUB 126.6 billion. Revenue amounted to 230.6 billion rubles. (-5%). |
| We are waiting for IFRS, maybe they will announce it sooner too |
| the report is so-so... fly to the floor... |
| This is a fiasco, bro needs a magic kick |
| Soon the shorts will be approximately fskishort from 15 as red said |
| Gandoshat non-stop. Every day in the red. |
| It’s just that the price of FSK’s shares has become, after falling into the clutches of Rosseti, a regulated abstract value that is manipulated for their own purposes. It was necessary to draw the required profit for Rosseti for 2021 - they lifted the FSK cap a little. The year is cut off - it’s enough, you can continue leaking. History repeats itself every year. |
| I wish I had a report according to IFRS as soon as possible and at least some information from the top leaders on the divas. It would be easier to wait. |
| Doesn't anyone have an opinion about the fall? |
There has been no fall yet; this figure on the chart is called the Krasnomyrdin plateau.
|
Huge investments in BAM hang like the sword of Damocles. Besides, the 4th quarter was a failure. That's all the opinion. The issue with divas also does not raise high expectations. |
| “Finam” discovered a trading idea: buy shares of FGC UES with a target of 0.2335 rubles https://funkyimg.com/i/3btzK.jpg https://funkyimg.com/i/3btzL.jpg “Finam” opened a trading idea to “buy shares of FGC UES” with a target of 0.2335 rubles. per piece” with an investment horizon of 1-2 months. Entry price: current market, potential return: 11%, stop order: 0.20 rubles, says the investment company in a commentary. “If you pay attention to the entire electric power industry, you can see that many companies have not fully recovered after their decline in March 2021. Gradually, you can bet on companies that are financially stable, have revenue growth potential, have a low debt load and a large share of free cash on the balance sheet. Among such companies, it is worth highlighting FGC UES, which, in addition to its growth potential, pays high dividends,” write experts from the investment company. Analysts also note that, from a technical point of view, the security is trading at a strong support level. “It’s worth opening positions from current levels with a target of 0.2335 rubles. When buying at 20% and placing a stop order at the level of 0.20 rubles. the risk on the portfolio will be 1%,” they indicate. https://www.finmarket.ru/shares/analytics/542755… |
| On 22-23 I will go out quietly, if they give it of course) |
The moved message will not be deleted, only this copy will be deleted.
clarification of relations rudeness duplication of messages veiled obscenities abuse of video during bidding abuse of pictures during bidding capslock swearing deliberate distortion of words news without reference to the source discussion of moderation in the wrong place insults response to a deleted off-topic during bidding transmission of a message from a blocked user getting personal repeat advertising repost of a message deleted by the moderator trolling threats flood rudeness
Use this form to report a selected message (such as "spam" or "harassment").
Add user to ignore
What monument should be erected on Lubyanka Square?(secret, author: DELETS, until March 26, 2021)
Dzerzhinsky
| 31 | |
| Alexander Nevsky | 4 |
| To the unknown victim of political repression | 29 |
| Total votes: | 64 |
Maximum price of Gazprom shares in April as of 04/30/2021
(author: soroF, until March 31, 2021)
Exchange rates
| EUR | 1.19459 | −0.00057 (−0.05%) | 00:17 |
| GBP | 1.3918 | +0.0001 (+0.01%) | 00:17 |
| JPY | 109.003 | +0.024 (+0.02%) | 00:17 |
| CAD | 1.24761 | +0.00041 (+0.03%) | 00:17 |
| CHF | 0.92855 | −0.00068 (−0.07%) | 00:17 |
| CNY | 6.5081 | +0.0006 (+0.01%) | 00:12 |
| RUR | 73.3931 | +0.1171 (+0.16%) | 00:17 |
| EUR/RUB | 87.387 | −0.0964 (−0.11%) | 00:12 |
| AUD | 0.7749 | −0.00079 (−0.10%) | 00:17 |
| HKD | 7.7625 | +0.00033 (0%) | 00:12 |
Attention! Dear visitors to the mfd.ru website, we warn you about the following: Moscow Exchange OJSC (hereinafter referred to as the Exchange) is the source and owner of all or part of the Exchange information indicated on this page. You do not have the right, without the written consent of the Exchange, to further distribute or provide Exchange information to third parties in any form and by any means, broadcast it, demonstrate or provide access to such information, as well as its use in gaming, educational and other systems that provide for the provision and /or distribution of Exchange information. You also do not have the right, without the written consent of the Exchange, to use Exchange Information to create Modified Information intended for further provision to third parties or public distribution. In addition, you do not have the right to use Exchange Information in your Non-display systems without the written consent of the Exchange.
Company profitability
The profitability of FGC UES for 2011-2020
FGC UES can please us with fairly high business profitability. Based on the results of 3 quarters of 2021:
- EBITDA margin - 54%
- operating profitability - 38%
- net profitability - almost 30%
Profitability of FGC UES
| EBITDA margin (%) | Operating margin (%) | Net profitability (%) | |
| Profitability of FGC UES | 54 | 38 | 30 |
Warning about Forex and BO
Expert opinion
Vladimir Silchenko
Private investor, stock market expert and author of the Capitalist blog
Ask a Question
If you want to increase your income by trading Forex, carefully analyze the decision. The shares have no relation to the interbank foreign exchange market. Access to them is provided only by brokers licensed by the Russian Federation.
They sell unregulated CFDs here. By purchasing such a product, you do not become the owner of FGC UES securities. The same applies to binary options, which are essentially casinos. There are bets here, not purchases and sales. Remember: the casino doesn't lose!
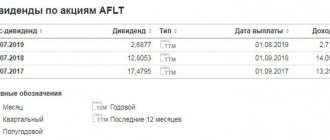
Company dividends
This is, frankly, every investor's nightmare.
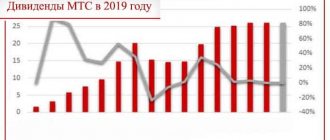
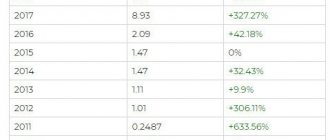
FGC UES dividends for 2007-2019
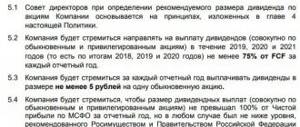
The dividend policy at FGC UES provides for the payment of at least 50% of net profit under IFRS. But this amount of net profit excludes a whole regiment of various points:
- income and expenses from revaluation
- investments made at the expense of net profit received from regulated activities as part of the implementation of investment programs approved by the Ministry of Energy of Russia in the prescribed manner
- net profit received from activities related to technological connection to electrical networks
Thanks to such a series of exceptions, the final basis for calculating dividends may turn out to be completely unpredictable, as well as the dividends themselves.
Over the past few years, the dividend size has been more or less stable - 1.6-1.8 kopecks per share. As a result, in recent years the annual dividend yield on FGC UES shares has been about 8%. That's pretty good in an era of low interest rates.
There is clearly a lack of stability and certainty in the dividend policy of FGC UES.
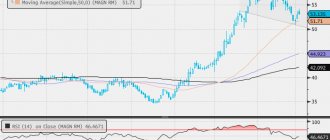
Technical picture
On the weekly chart, FEES shares are trading within an upward channel. We consider it appropriate to open long positions in the area of the lower border of the figure and the support level of 0.21 with a target of 0.25–0.26 with a short stop. If a correction develops, support will be provided by the line 0.19.
Source: finam.ru
0
PFC at 05/12/2021 / Trading - financial market news / 1 comment
Company multipliers
FGC UES looks quite cheap, like all companies in the utility sector. P/E is less than 4, EV/EBITDA is 3.75. The company remains quite undervalued relative to its net income.
FGC UES multipliers
| P/E | EV/EBITDA | |
| FGC UES multipliers | 4 | 3,75 |
Valuation of FGC UES
FGC UES is valued cheaper than all its interregional distribution network analogues. At the same time, its level of net profitability is the highest in the industry. This is a point worth paying attention to.
Stock return
Over the past three years, returns have remained stable with minor changes:
- 2017 – 8.1%;
- 2018 – 7.8%;
- 2019 – 7.9%.
2019 will bring 50% of profits to pay out to shareholders. This is significantly higher compared to previous years. A significant part of the growth of FGC UES came from the main business - electricity transmission.
Income also comes from repairs and maintenance of third-party owners’ facilities, sale of electricity, construction, etc. Experts estimate the cost at 0.22 rubles. on an annual basis.
How to buy shares and receive dividends
To purchase FGC UES securities, you must open a brokerage account. Study the offers and trading programs of large companies and indicate the name of the chosen one. The minimum purchase is 1 lot equal to 10,000 shares.
Best brokers
Investing helps increase your own income. The broker will provide information about the market, calculate liquidity and help minimize risks. It is more profitable to choose brokers with minimal commissions.
Reliable Russian brokers
| Name | Rating | pros | Minuses |
| Finam | 8/10 | The most reliable | Commissions |
| Opening | 7/10 | Low commissions | Imposing services |
| BKS | 7/10 | The most technologically advanced | Imposing services |
| Kit-Finance | 6.5/10 | Low commissions | Outdated software and user interface |
conclusions
FGC UES is one of the most stable companies on the Russian market in terms of revenue generation.
FGC UES is a wholesale player that does not work directly with small consumers. This reduces the risks of non-recoverable receivables—the debts of ordinary retail consumers to the company—to virtually zero. This happens regularly at IDGC.
For 2021, FGC UES gave a yield of 8.17%. In this case, the amount distributed as dividends is 27% of net profit minus all exceptions. In previous periods, payments also remained within 8%. This gives FGC UES the status of a quasi-bond. If the company raises the payout ratio to 50% without any exceptions, then the dividend yield will be about 16% at current prices. This sounds quite attractive.
Dividend policy of FGC UES
| Current (%) | In case of increase in payout ratio (%) | |
| Dividend yield | 8 | 16 |
Fundamentally, the company is quite stable:
- small debt
- good cash balance
- low ratio of the company's liabilities to its total assets
The problem is that, from the point of view of operational growth, the business of FGC UES is now stagnating. The only option for its development is to increase tariffs. But FGC UES is not allowed to increase tariffs.
Corporate events
- FGC UES tariff differentiation may be postponed until at least mid-2021 amid complaints from industry. Previously, it was proposed to increase the tariff for industrial consumers of the UNEG annually for 3 years, while at the same time reducing it for distribution networks by an average of 4.5%.
- The company requested budget subsidies of 134 billion rubles. for the 2nd stage of electrification of the BAM and Trassib (2021–2024), the total cost of which is estimated at almost 185 billion rubles. FGC UES plans to finance the difference using its own and borrowed funds. In the absence of subsidies, the project can be paid for by indexing tariffs above 10%, which, in our opinion, is unlikely, by increasing debt and (or) refusing to pay dividends. The parent company needs the dividend flow, and since this project is a kind of social burden for FGC UES, and it can only bring returns in the long term, subsidies seem to be a priority option for both the state and the issuer.
Forecast for key financial indicators of FGC UES
| billion rubles, unless otherwise indicated | 2016 | 2017 | 2018F | 2019F | 2020P |
| Revenue | 255,6 | 242,2 | 254,0 | 260,3 | 272,7 |
| Revenue from technical connection | 39,1 | 19,4 | 21,5 | 12,0 | 12,8 |
| EBITDA | 120,6 | 131,6 | 140,4 | 137,4 | 144,9 |
| Height, % | 22,8% | 9,1% | 6,7% | -2,1% | 5,5% |
| EBITDA margin | 47,2% | 54,3% | 55,3% | 52,8% | 53,1% |
| Net profit of shareholders | 68,2 | 87,7 | 92,8 | 84,9 | 86,6 |
| Height, % | 52,2% | 28,7% | 5,8% | -8,6% | 2,1% |
| Net Margin | 26,7% | 36,2% | 36,5% | 32,6% | 31,8% |
| Net debt | 221,8 | 215,3 | 205,4 | 211,5 | 183,1 |
| Ch.debt/EBITDA | 1,84 | 1,64 | 1,46 | 1,54 | 1,26 |
| CFO | 111,5 | 120,8 | 124,1 | 141,9 | 136,4 |
| Investment program | 79,8 | 88,0 | 91,0 | 127,1 | 90,5 |
| FCFF | 0,0 | 32,8 | 33,1 | 10,4 | 42,0 |
| Dividends | 18,2 | 20,3 | 20,9 | 17,5 | 19,7 |
| DPS, rub. | 0,014 | 0,016 | 0,016 | 0,014 | 0,015 |
| Height, % | 7,1% | 11,6% | 3,0% | -16,4% | 12,5% |
| DY | 8,1% | 8,5% | 9,9% | 8,3% | 9,3% |
Source: data
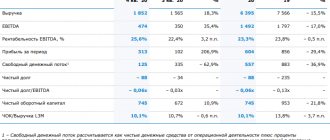
Key financial indicators of FGC UES
| Income indicators, million rubles, unless otherwise stated | 4K 2018 | 4K 2017 | Change, % | 2018 | 2017 | Change, % |
| Revenue | 79 584 | 82 106 | -3,1% | 253 979 | 242 186 | 4,9% |
| EBITDA | 49 010 | 45 948 | 6,7% | 140 357 | 131 561 | 6,7% |
| EBITDA margin | 61,6% | 56,0% | 5,6% | 55,3% | 54,3% | 0,9% |
| EBITDA adj. | — | — | — | 138 109 | 142 682 | -3,2% |
| Net profit of shareholders | 34 877 | 35 305 | -1,2% | 92 809 | 87 744 | 5,8% |
| Net profit adj. | — | — | — | 91 011 | 96 641 | -5,8% |
| CFO | — | — | — | 124 137 | 120 767 | 2,8% |
| FCFF | — | — | — | 33 147 | 32 786 | 1,1% |
| 4K 2018 | 3K 2018 | 4K 2017 | k/k | YTD | ||
| Net debt | 205 380 | 204 323 | 215 315 | 0,5% | -4,6% | |
| Net debt/EBITDA | 1,46 | 1,52 | 1,64 | -0,06 | -0,17 |
Source: company data, calculations by FINAM Group