Many beginners use graphical analysis as their main tool for assessing market movements. This is a completely reasonable decision, because all graphic patterns are quite simple, easy to identify and practically do not have any variability in interpretation. Accordingly, this allows us to reduce any doubts to a minimum , this is facilitated by the presence of clear criteria by which one or another figure can be distinguished. All the rules were formed a long time ago; you can verify their effectiveness simply by looking at the graphs and noting familiar figures.
, the connection of price extremes with a straight line is used as a basis . Such an analysis began back in the last century; Elliott proposed using a trend line as a guideline for marking movements in accordance with his wave theory. Now almost everyone knows what a trend line is, how to build it, what meaning it carries and how to trade along it. In the figures of graphical analysis, a straight line is also used, but it is only local in nature and is often accompanied by another, thus forming a price range.
What is a triangle technical analysis figure?
The triangle figure in technical analysis is a classic trading pattern that allows you to trade with a good mathematical expectation . The figure is determined visually, and a trend line is used for construction .
The big advantage of the model is the frequency of formation and good performance.
Its uncertainty lies in the fact that the entry point can form in any direction.
The popularity and effectiveness are confirmed by a large number of traders who successfully use the formation in various markets :
- Stock exchange (shares).
- Forex.
- Options.
- Futures.
The article contains a detailed description, the main types of patterns, basic trading strategies and methods for setting stop loss, as well as take profit.
Rising model
An ascending triangle is a figure formed when the price often hits a resistance level, but does not update its lows . a breakdown of the triangular consolidation occurs . A buy signal appears when it consolidates at the resistance level. Then further hike up. The diagram with the breaking rules is shown in the figure below:
The diagram shows the following features :
- There may be more or less price rebounds from resistance and support than the figure shows.
- Take profit is equal to the height of the figure. It is equal to the length between the maximum and minimum of the technical analysis construct.
- Stop loss is placed after the last break from support.
- A bullish trend precedes formation.
An ascending triangle in trading is a figure of market growth and continuation of movement in an uptrend.
Working out the bullish formation
On the GBPUSD currency pair, a bullish candlestick structure was formed for four days, then it left the boundaries and within a day the price reached take profit. The trade would have earned twice the potential risk.
However , there are exceptions when this pattern forms at the bottom of the market . If we see a picture like the one below, then a reversal is formed . However, you should not count on big profits when trading a breakout in the opposite direction.
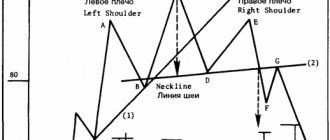
Some examples of the Head and Shoulders figure
Here are a couple more examples of this pattern. Be sure to note that each time the price structure is formed uniquely, however, all the necessary elements are still present in it.
In the last example, the neck line will rarely look like a horizontal level, although more often than not it will be slanted.
Descending model
This type of triangle is an inverted mirror analogue of the ascending triangle . A descending triangle is a figure formed when the price often hits a support level, but does not update its highs. Next comes a breakdown, consolidation at the support level and a move further down . A diagram of how to properly build a formation is shown in the figure below:
The rules and nuances of the formation are mirrored from the ascending formation. A bearish trend precedes, and there are also different numbers of rebounds from the levels.
A descending triangle in trading is a figure of a market decline and continued movement in a bearish trend.
On a real chart, there is a case when a protracted downward trend is accompanied by the appearance of two structures in a row.
Reliable entry technique
The price often pulls back after breaking the neckline. However, you can see the strength of buyers in advance before entering a long position. To do this you need:
- Find a potential double bottom.
- Wait until the price starts moving up.
- See the formation of a pullback in the form of a tight consolidation.
- Open a trade when the price breaks out of the range.
This is a reliable entry technique that will give you the opportunity to enter the market with an optimal risk to reward ratio.
When there is a weak pullback that turns into a tight consolidation, it suggests there is no selling pressure. You can set a stop loss below the low of the range boundaries.
However, sometimes the price will move up without any pullbacks. What to do in this case?
Symmetrical model
Other names for this pattern are equilateral, isosceles or converging triangle . A symmetrical figure is formed with a large number of touches at the cost of inclined lines, which are built at approximately the same angle relative to the horizontal . Standard entry point:
- The price is squeezed into a narrowing price channel , alternately bouncing off the edges of the formation.
- Next we see the breakout of one of the lines and a retest. The entry point is a return to the trend line or a stop order (mark 1) at a distance of several points from the border. The difficulty of placing a hold is that you need to constantly move the order as the price moves.
- Stop loss is placed beyond the nearest extremum of the opposite border
Setting take profit for a symmetrical formation
If we look at the two standard ways to set take profit , the following stand out:
- Take equal to the height of the structure.
- Setting a take on a parallel support line (bullish candlestick combination) built from the high.
These two options can be at the same point, as shown:
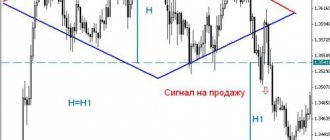
Working on the chart
Formation of a reversal figure at the top of the market on the GBPUSD currency pair. The reverse upward movement of the price gave an entry point on the lower edge , and the take profit was greater in the second method .
Expanding model
The pattern is the opposite of a tapering triangle. The recommended number of touches at the price of one trend line is at least three. If you see fewer touches, then it is better to refrain from entering the market. The diagram of the entrance and how to correctly draw the model is shown in the figure.
The profit taking level does not differ from the standard pattern.
An example of a divergent real market formation
A good example of a divergent triangle has formed on the GBUSD asset. The trend has changed globally and it was possible to take much more profit than following the example.
Don't Make This Mistake When Trading the Double Bottom Pattern
Many traders open positions on the breakdown of the neckline after the formation of a double bottom. However, they do not pay attention to the market context. So be careful.
If the market is in a strong downtrend and forms a small double bottom, the market is likely to continue its decline.
You can use an additional filter to avoid this situation:
- Add a 20-period moving average (MA) to the chart.
- If the price is below the 20 MA, do not enter the market.
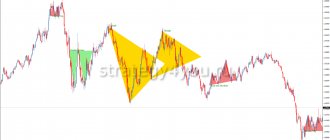
The main differences between a triangle and a wedge and a pennant
a triangle and a pennant on a chart. Visually, they look exactly the same, but they are trend continuation figures . The main differences between technical analysis:
- Time of figure formation . For a pennant, the banner forms faster.
- The entry point is different , the Pennant is trading on a breakdown of the upper consolidation point, and the triangle is on a retest to the trend line.
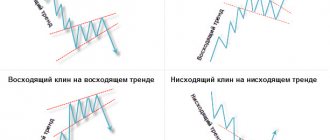
In trading, a wedge represents an inclined reversal pattern ; it occurs at the peaks of the chart, changing the trend. They have the same entry point with the triangle on the return . The wedge shape always angles upward to one side in a bullish pattern.
conclusions
In general, we can say that the Forex triangle indicates a short-term equilibrium between sellers and buyers, when neither party can move the market in its direction. In turn, “Klin” says that large players are preparing for speculative actions, squeezing out smaller ones and increasing volume to begin a reversal or resumption of the trend. Accordingly, volumes increase sharply.
The ability to find a triangle in time and work it out correctly should be in the arsenal of all traders, and no matter what asset he is trading on, the rules remain the same. Even if the profit is small, trading will become much more stable and with fewer losses.
How to determine take profit and stop loss
Stop loss for each type of figure is placed behind the nearest extreme point before the breakout.
Take profit can be set according to the classic version, or you can use the following methods:
- Take profit at the nearest technical analysis level.
- Use the Fibonacci grid to determine the price target. The extreme height points of the pattern should be at levels 0 and 100 of the indicator. The level of 261.8 is the expected profit.
- Use a computer analysis indicator.
- Do not use take profit, but wait for a return signal . Exit from the transaction is carried out at Price Action, another technical analysis figure, or at the indicator's turning point.
- At the intersection of the take profit line for purchases (sales) parallel to the support (resistance) line.
Triangle in Elliott Wave Trading
Ralph Elliott wrote the wave theory, which remains relevant today. The underlying fact is that history always repeats itself.
Let's look at the features of Elliott theory applicable to a technical pattern on the chart:
- Each subsequent wave is shorter than the previous one (a is shorter than b, the length of b is greater than c, and so on).
- The waves may have an uneven, zigzag appearance . That is, within one movement there can be several waves. Usually there are at least three such zigzags.
- The triangle is often included in other technical analysis patterns on a higher time period.
- The last two waves d and e can turn into horizontal accumulation . It is important that a, b and c have a clear direction.
- Wave e can have its own structure of five waves on a smaller time frame.
In a divergent trend reversal model, the wavelengths increase to form a technical analysis graphical figure.
Indicator for finding the triangle pattern on charts
The PricePatterns indicator is used by traders to find the main patterns of technical analysis . In addition to the triangle, the Japanese candlestick chart displays head and shoulders, double top, and wedge.
download the file with the indicator from the link pricepatterns
Using the PricePatterns indicator
How to determine market reversals with the greatest accuracy?
To determine the highest probability of a market reversal using the double top pattern, you can use the multiple time frame strategy. Here's how it works.
Determine that the market is in a downtrend. Let the price approach the nearest resistance area. Look for a double top formation on the lower time frame.
Here's an example. The price is approaching the resistance level on the 4-hour timeframe.
A double top is formed on the hourly timeframe.
Basic mistakes when trading
Let's look at the mistakes and difficulties that traders face:
- Searching for a reversal pattern when you need to look for a trend continuation . Such technical analysis constructs are considered weak.
- Short time for the pattern to appear.
- Large stop loss - for the farthest extreme . Trading without stop loss
- Long decision-making time or late detection of the pattern. As a consequence, opening an order when the chart has already gone far beyond the boundaries of the formation.
- Aggressive trading when touching the sloping line. Touching does not mean a breakout of the pattern.