One of the classic technical analysis tools is the Parabolic SAR indicator. This is a visual graphical way to determine the current trend, which allows you to predict a change in trend.
Modern traders most often use the parabolic indicator not separately, but in combination with other indicators. Selecting the right strategy takes considerable time, but as a result, it allows you to get a stable profit by correctly predicting changes in the price of cryptocurrency and other assets.
What is Parabolic SAR?
Developed by Welles Wilder, creator of the RSI and DMI, the parabolic sets moving price stops for long or short positions. Also called a stop and reversal indicator (full name is "Parabolic SAR" - parabolic stops and reversals), the parabolic is best suited for placing stop orders rather than establishing direction of movement or trend.
This indicator is classified as a trend indicator. It is a line very similar to a parabola (hence, in fact, the name of the indicator), which is superimposed on the price chart and, based on their (parabolic and rate chart) relative position, appropriate conclusions are drawn about the state of the market and the prospects for its development.
If the price crosses the Parabolic SAR lines, then the indicator turns, and its next values are located on the other side of the price. With this “reversal” of the indicator, the reference point will be the maximum or minimum price for the previous period. A reversal of the indicator is a signal of either the completion (transition to correction or flat) of a trend, or its reversal.
Wilder recommended first identifying a trend and then trading parabolic in the direction of that trend. If the trend is upward, then you should buy when the indicator moves below the price. If the trend is downward, then you should sell when the indicator moves above the price.
Long positions should be closed when the price falls below the technical indicator line, and short positions should be closed when the price rises above the Parabolic SAR line. That is, it is necessary to monitor the direction of movement of Parabolic SAR and keep positions open on the market only in the direction of this movement. This indicator is often used as a trailing stop line.
Description of parabolic
Well, you should already know how to turn it on, no small ones. We switched to the live chart and selected Parabolic SAR.
The parabolic creates on the chart... surprise, a parabola. And this parabola is below the price in an uptrend and above the price in a downtrend.
As you remember, SAR stands for Stop and Reverse. In practice this means a very simple thing. Parabolic is a trend indicator and works exclusively on trends .
Parabolic always follows the trend. There is no need to force it during low-volatility, sideways movement.
Entry on the trend and against the trend
Let's look at a specific example for a downward trend.
The blue long rectangle simply marks the downward trend. Like any other trend, it consists of waves - microtrends.
The parabolic at the top simply confirms this trend. But when it starts below, it is a signal of a small micro-reversal, against the trend.
Any technical analysis book will tell you that you cannot enter against the trend. But, strictly speaking, there are no rules in technical analysis that cannot be adapted to a specific situation. Otherwise, everyone, you know, would trade based on one intersection of the stochastic.
Therefore, in this particular example, the entry on the red arrows in Put goes with the trend, and the green arrows in Call go against the trend. In the case of greens, of course, you need to be careful with expiration, otherwise it will be easy to fly by and it will be a shame. You'll have to break plates and yell at your neighbors, and that all takes time.
Indicator history
The indicator was developed and described in 1976 by Welles Wilder. Initially, the name of this indicator was SAR, as a combination of capital letters “stop and revers” - “stop and reversal”. Due to the complexity of the calculation, the indicator found active use in the era of dominance in technical analysis of computer technology. In Russian transcription, this indicator is sometimes also called the “Parabolic System”. It is named so because the closing signals given as prices change, as you probably already understood, draw something like a parabola.
Wilder was looking for a system that could capture most of the winnings in a trending market without relying on any external methods of retaining profits. Parabolic calculations result in a series of trailing stops, which, if triggered, signal a trend reversal. Stops are recalculated daily (or for each time frame you use) and get closer as the trend progresses. If the trend could not continue, the indicator readings will change position to the opposite and a new time period will begin.
Pros and cons of the tool
The review shows that the parabolic indicator has both pros and cons. Its tangible advantages include:
- It shows general trends well, especially on large timeframes at a level not lower than hourly.
- Easy to understand for both experienced and novice traders.
- Easily combined with almost all other indicators – trend and others.
- Does not require significant adjustments to the settings - in most cases, traders recommend using the default basic settings.
However, the tool is not without its drawbacks:
- The tool works well only in conjunction with other indicators.
- To create a truly effective strategy, it will take considerable time - making entries simply based on parabolic readings is risky.
- Parabolic works quite well only in a trending market. Practice shows that flat situations often arise on the stock exchange, when the price cannot decide on the direction of movement for several hours or even days.
- Finally, the indicator does not work during news releases, which is a common flaw in technical analysis. In such situations, you should use strategies based on fundamental analysis, which takes into account not mathematical algorithms, but the market reaction to important socio-economic and political events.
Indicator parameters
Parabolic works best during strong trending periods, which Wilder himself estimates occurs about 30% of the time. Therefore, a trader must first determine if there is any trend in the market using other indicators such as Wilder's ADX line and then trade using the parabolic in the direction of the trend.
To configure the indicator, only two variables are set: step and maximum step. The higher the step is set, the more sensitive the indicator will be to price changes. If the step is set too high, the indicator will fluctuate above and below the price too often, making it quite difficult to interpret. The maximum step controls the adjustment of the parabolic while the price moves. The lower the maximum step value is set, the further the moving stop will be from the price. Wilder recommended setting the step value to 0.02 and setting the maximum step value to 0.20.
In his book, Wilder made the following important observation:
“I have tried many different acceleration factors and have found that incremental increments of 0.02 work best, however, if you want to give the system a personal touch to change breakpoints that may be used by other traders, use a incremental range between 0.018 and 0.021. Any incremental increase in this range will work well.”
Installing on a chart and setting up Parabolic
To install this tool on a chart, you do not need to first search the Internet and download it. The indicator is included in the package of standard tools of any trading terminal and can be pulled out onto the terminal chart from the “Insert” menu:
Installing Parabolic SAR on a chart in MT4
After clicking on the instrument, you will see a window with its settings on the chart:
Setting the properties of the Parabolic SAR indicator
In the picture above you see two tabs with the properties of this tool - “Options” and “Display”.
Options Tab
Allows you to configure three properties of Parabolic ATS:
1) Step – the set parameter here is responsible for sensitivity to price changes. By default its value is "0.02". If you want to change the step, remember that:
- by setting a lower value, you will receive more reliable signals from Parabolic SAR, but they will appear with a delay;
- setting a higher value makes the indicator more sensitive to price changes, it will be able to determine the direction of the trend earlier, but you will receive more false signals from it.
2) Maximum – this parameter defaults to “0.2”. It corrects the “step”, smoothing out its distortions in well-defined trends. Changing its value will not have much effect on its operation.
3) Style – here you can set the color and line thickness for optimal visualization of the Parabolic SAR curve on the graph.
Display Tab
Allows you to set the time period (TF) over which the indicator curve will be displayed. Remember that the author of the tool recommended working with it on the H1 time frame.
A few recommendations for setting up:
- When changing the “Step” parameter, change the “Maximum” parameter in proportion to it. If, for example, you gave the first a value of 0.07, then the second should also have a corresponding value – “0.7”.
- Here you can experiment with Parabolic SAR. Optimal settings of its parameters can be achieved by comparing them on trading results, depending on your chosen trading style and type of trading strategy.
- Remember that the changed Parabolic ATS settings have different effects on trading efficiency, depending on the currency instrument you choose and the time period (TF).
It should be added that the indicator works according to a complex algorithm, which is based on complex mathematical calculations. There is no point for us to go deeper into these calculations and build the Parabolic curve manually when any terminal has a ready-to-use instrument - just install it on the chart and start working.
Indicator calculation
The indicator value increases if the price of the current bar is higher than the previous one in a bullish market and vice versa. In this case, the acceleration factor (ACCELERATION) will double, which will cause the Parabolic SAR and price to converge. In other words, the indicator approaches the price faster, the faster it rises or falls.
For long positions:
SAR (i) = ACCELERATION * (HIGH (i – 1) – SAR (i – 1)) + SAR (i – 1)
For short positions:
SAR (i) = ACCELERATION * (LOW (i – 1) – SAR (i – 1)) – SAR (i – 1)
Where: SAR (i – 1) — the value of the Parabolic SAR indicator on the previous bar; ACCELERATION (hereinafter AF) - acceleration factor; HIGH (i – 1) — maximum price for the previous period; LOW (i – 1) — minimum price for the previous period.
On the first day of the game, the acceleration factor is 0.02. This means that the output is shifted by 2 percent of the distance between the original level and the extreme value. AF increases by 0.02 each time a rise makes a new high or a decline makes a new low, up to a maximum of 0.20.
If during a long trend the market makes three new rising highs, AF becomes equal to 0.08 (0.02+3*0.02), and if the market makes nine new highs, then AF reaches its maximum possible value of 0.20 (0 .02+9*0.02). In the latter case, the price moves daily by 20 percent of the distance between its last position and the extreme for the day.
Many people change the acceleration factor. They adjust the initial step size (0.02) and the maximum value (0.20). Some increase them to make the system more sensitive, while others decrease them to make the system react more slowly. The initial pitch typically lies between 0.015 and 0.025, and the maximum AF value ranges from 0.18 to 0.23.
How to install the indicator
The parabolic sar indicator can be found in any program - for example, in the MT4, MT5 terminal or on a live chart.
To install in MT4/MT5 you need:
- Log in to the MT4 terminal.
- Select the "Insert" tab.
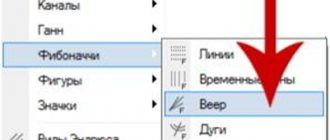
- Then – “Indicators”.
- Go to the “Trending” section.
- Select "Parabolic SAR".
- Specify the required parameters - you can leave the basic ones in increments of 0.02 and a maximum of 0.2. It is better to change the color to black for easier perception.
- As a result, the parabolic will appear in the form of points above and below the asset candles.
Unlike the terminal, you do not need to download the Live Chart program - just go to the desired platform and select a parabolic.
The instructions are simple:
- Click on the icon with a wave and a plus sign.
- Find the indicator in the list or enter “Parabolic SAR” in the search line.
- Select a tool.
- After which the parabolic will appear on the platform.
- Its settings can also be changed. To do this, click on the “gear” icon.
- And then select the desired parameters Start, Increment and Value, click OK.
If the indicator is not available on the trading platform, it can be downloaded and installed from any resource. The file is downloaded as a document, which is then installed in the terminal.
To do this, you need to open MT4 and follow this path:
- File.
- Open the data directory.
- MQL4 or MQL5.
- Indicators – the downloaded file is copied to this folder.
Then you need to restart the MT4 terminal - that is, close the program and open it again. The further sequence of actions for adding parabolic sar is exactly the same.
Application in trading to determine the trend
The Parabolic SAR indicator is very easy to use to determine the short-term trend. If the price chart is located above the indicator curve, this indicates an uptrend. If the price is below the indicator curve, it is a downtrend. If the price chart has deviated greatly from the indicator line, then most likely they will soon converge and the trend will change to the opposite, or the market will enter a flat stage.
It is most convenient to determine the trend at higher periods. Let's say, if you trade intraday, you should look at the parabolic on the daily.
Practical application of PSAR
Now we will consider in detail, in order, all the options where you can use the PSAR indicator.
Trend Determination
Everything is very simple here:
- The parabolic curve of the indicator lies above the price curve – we are observing a downward trend;
- The Parabolic ATS curve is formed below the price curve - we are facing an upward trend.
Determining trend direction using PSAR
A reversal of the Parabolic SAR curve indicates a change in trend. Thus, the appearance of another point on the opposite side of the price means the possible completion of the current trend and its formation in a new direction. The reference points of the “on the gap” indicator are the maximum/minimum price of the previous period.
When the price touches and crosses the Parabolic curve, the indicator moves to the other side relative to the price and changes its direction. This suggests that the direction of the trend has also changed . When using this feature of Parabolic ATS, be sure to consider the following points:
- The stronger the trend, the wider apart the points are that form the parabolic curve. It is not worth entering the market in such a situation, so as not to get caught in a possible price rollback.
- The probability of a price reversal is higher as the distance between the points of the PSAR curve decreases.
- Work with Parabolic SAR only on higher (from H1 and higher) timeframes to get rid of false signals that are typical when working with this indicator on lower TFs.
- When trading on junior TFs, enter the market after constructing 3-4 consecutive points at the beginning of the formation of the next parabolic curve Parabolic SAR. These points confirm the entry signal in the new price direction:
Entering the market with “PSAR” on TF M15
Market entry points
Good results with this tool can be obtained during a strong trend or at its completion stage. A signal to enter the market should be considered the intersection of the price with the Parabolic SAR curve and its “break” with a transition to the opposite side relative to the price chart. If the entry signal was correct, in a strong trend the trader will be able to take maximum profit from the market.
1) Buy signal
It is important here that if there is an obvious break in the Parabolic ATS curve, the first point of the forming parabolic curve should be under the forming candle. At the same time, the last point of the old indicator curve should lie, accordingly, above the previous bar:
Signal "PSAR" to enter the market with a purchase (TF H1)
2) Sell signal
On the break of the Parabolic SAR curve, the first point of the forming parabolic curve lies above the forming bar, the last point of the old indicator curve lies under the previous candle:
Signal "PSAR" to enter the market with a purchase (TF H1)
As can be seen from the figures above, a signal to enter the market in both directions is a signal for a trend reversal. The choice of the direction of the opened position depends on the location of the last and first break points of the opposite curves of the Parabolic ATS indicator.
They say PSAR doesn't mind:
- purchases if the price lies above its curve;
- selling if the price is below its curve.
Some traders enter the market immediately at the intersection of the price with the indicator curve, believing this moment to be the end of the current trend and the beginning of a new trend. I think that it is more logical and safer to enter the market after receiving confirmation of a signal for an established trend.
Search for points to close positions
It is very convenient to use this indicator to determine closing points for positions, setting Stop Loss and Trailing Stop orders. There is a simple technique that traders, working with PSAR, use to close transactions as profitably and break-evenly as possible.
After opening a position and setting Stop Loss, you should monitor the price and the drawing of indicator points. You just need to move the Stop Loss on the chart to the level of the next formed point lying:
- higher than the price on an uptrend (for sales);
- below the price in a downtrend (for purchases).
If the price moves in your direction, you will close the field of price intersection with the Parabolic SAR curve and when the first point appears on the opposite side. In the event of a sharp and strong price rollback, your transaction will be closed at a “floating” Stop, but with a profit.
Features of the indicator in a flat
It was already mentioned above that trading sideways with this instrument is not recommended due to the large number of false signals. If you like flat trading, then the PSAR indicator can be useful here too, but in combination with some other technical analysis tool . It is desirable that the auxiliary tool perform another function.
If PSAR shows the direction of the trend, then it would be wiser to choose a tool to help it, showing, for example, the strength of the trend. Otherwise, both indicators will duplicate signals, and it will be difficult for you to filter out false signals here . Such a tool could be, for example, the ADX indicator (strength index), which shows the strength of the current trend.
Parabolic ATS as an element of a trading strategy
The author of the tool recommended using it together with other technical indicators. The selection of several instruments that perform different functions, but are aimed at solving one problem, is called a trading strategy. You can combine the PSAR indicator with tools built into the terminal or use custom tools you find on the Internet. The main thing is that in the “union” they fulfill the task you set.
Very often, the Stochastic oscillator, the ADX strength indicator, and the Moving Average trend indicator are used with Parabolic SAR (3 of its moving averages with different periods are used). Let's look at an example of how one of these tools works in tandem with our PSAR.
5.1 Indicator “PSAR” + “Stochastic Oscillator” + “EMA100”
We choose any TF, starting from H1, and any currency instrument with good volatility. We install indicators on the chart with the following settings:
- For Parabolic SAR (step size = 0.01, maximum exponent = 0.2);
- For Stochastic Oscillator (Period %K = 10, Period %D = 7, Slowdown = 4, levels – 37 and 63);
- For Moving Average (period = 100);
We have three configured indicators on the chart; using their signals, we look for an opportunity to enter by buying. We need only three conditions to be met for a purchase:
- The red Stochastic curve lies in its window above the “63” level;
- We fix the closing of the previous candle above the EMA100 level;
- The Parabolic indicator formed the next point under the price curve.
All three signals have been received – we open for a buy:
Entry with a purchase based on the signals of three indicators
A sell entry is made on the same signals, but with mirror precision and vice versa :
- The red Stochastic curve lies in its window below the “37” level;
- The close of the previous candle was recorded under EMA100;
- The Parabolic indicator has formed a new point above the price curve.
As for closing positions, Take Profit does not need to be set here at all. It is better to close a position with maximum profit manually when the first point is formed on the opposite side. Stop loss must be set at the level of the signal bar in order to further move it to the level of each new Parabolic SAR point. You can also use a manual trailing stop.
Closing a buy position
Thus, if you entered the market correctly, in any case your transaction will be closed with a profit or at breakeven.
As for combining Parabolic SAR with other instruments, there is a good trading strategy using PSAR and three EMAs with periods of 10, 25 and 50. Trading with this indicator paired with the strength index (ADX) is very interesting. You can independently choose any other tool to create your own trading strategy.
Generating signals to enter a position
Initially, the parabolic was a pure reversal system. When a trader worked bullishly and an order to exit the market was activated, he was asked to sell with a double lot. At the same time, he automatically entered into a decline. When a trader was working short and a stop occurred, he was asked to submit a buy order with a double lot. At the same time, he automatically entered the promotion.
In general, a signal for making a transaction is the intersection of the price chart and Parabolic SAR, which indicates a complete or temporary end or reversal of the trend. When the indicator is “flipped”, its next values are located on the other side of the price, and the maximum or minimum price for the previous period will serve as the new reference point.
The very convenient thing about this indicator is that it is easy to use. Initially, if the dots are below the candles, then it is a buy signal, and when the dots are above the candles, it is a sell signal. This is probably the easiest indicator to use, as it assumes that the price is moving either up or down. Still, this tool is best used in trending markets, which are characterized by long rallies and similar pullbacks, and in no case should it be used during sideways movements.
If you hit a false signal twice in a row, then this is a sign of a stationary market. Stop using the parabolic, but continue to monitor it and wait until it gives you two good signals on paper.
Practice of application according to the trend
The parabolic shows not just the trend, but also its strength, and hints when the trend will end. For example.
The trend is going down, big red candles, that's it. But look - the distance between the parabolic signs is getting larger . This suggests that the trend is running out of steam.
Finally, the last parabolic sign came close to the candle (red arrow) - the trend ended. As usual, after a trend, a new one does not immediately begin - the price can rest and sit in a sideways movement, which is indicated by a rectangle.
Having rested, the price decides to win back and a small upward trend begins, with a green arrow and the first parabolic sign. Here is your signal for Call.
Another example.
The same eggs, only in profile. The parabolic shows the trend. Gradually, the distance between the parabolic signs begins to increase.
The last parabolic sign almost touches the candle (red arrow) – the trend is complete. And a sideways movement begins, after which the price falls to win back the previous rise.
That is why this indicator is so popular in Forex, where there are no expirations and where there is continuous work along the trend, which the parabolic shows very skillfully.
Binary traders need to remember that the parabolic, as in the example above, resembles trend lines - and where is the best place to enter a strong trend? Correctly on a small pullback. In our case – on red candles.
Another example. Look how similar it is to the previous one.
Similar situation. The trend from the first sign of the parabolic goes slowly upward, the distance between the signs expands, the sign touches the candle - bam, the trend is complete. Sideways (rectangle) and followed by a trend reversal, at the very first sign of the parabolic from above, into which the green arrow is poking.
Beauty, blunder.
Setting stops and trailing
The most common use of this indicator is as a trailing stop, where the current SAR value is a stop only for the current bar (there will be a new level for the next bar).
Losers go broke by holding losing positions in hopes of a market turnaround. Parabolic protects the trader from his own indecision and subjects him to iron discipline. It sets an exit order at the same time as opening a position and moves the stop in the direction of the trend.
If you are working to increase or decrease, and prices remain constant, the parabolic gives you a signal that the moment to enter is chosen incorrectly. You shouldn't sell or buy unless you were confident that prices would go up or down almost immediately after the trade. Parabolic prevents you from following a trend that is going nowhere. It will simply signal a reversal, or it will push your stop so close to the market that an exit will occur.
But during a monotonous trend, the parabolic is extremely useful. If prices rise or fall without pullbacks, it is very difficult to set stops correctly using conventional charts and indicators. In these conditions, the parabolic is the best tool for choosing the stop level.
If you are starting to use a parabolic in a given market, step back a few weeks and adjust its parameters. Pull stops following the indicator daily, but with one exception: if it tells you that the stop level should be inside the previous day's price range, don't do it. Stops should always be outside the previous day's price range.
How to set Stop-loss and Take-profit
If for binary options traders it is enough to simply predict the direction of movement of an asset “up/down”, then for the Forex market it is necessary to clearly understand at what level to set the stop loss and take profit.
The first tool allows you to close an order if the price reaches a critically low or high value, the second allows you to fix the minimum profit so as not to lose it if the trend changes.
There are no general rules for setting these levels - they depend on the strategy and preferences of a particular trader. However, in most cases the following criteria are used:
- Stop-loss is set slightly below the local minimum or slightly above the local maximum. For example, if the parabolic shows a trend reversal, you can open a buy order and then set a stop loss just below the nearest “hole” - the minimum price value.
- Take-profit should be set at least along the midline between the nearest minimum and maximum.
At the same time, you should pay attention to the main rule of risk management: the maximum size of the bet and possible loss should not exceed 2-3% of the total deposit amount. For example, if a trader has $100 on his balance, he must set a stop loss so that the loss is no more than $2-3.
Read more in our article: What are Stop Loss and Take Profit in trading?
Closing parabolic positions
One of the points of view on the use of the Parabolic SAR indicator is that its main purpose is to search for optimal moments to close a position. When the price chart crosses the indicator chart, this is a signal to close the position, since a market reversal, rollback, or transition to a flat has begun.
In this case, the Parabolic SAR chart is considered as the optimal level for exiting the position. With this approach, the entry point into the market is selected based on other methods - other technical indicators, price patterns, economic data, and so on.
Signals for entry using the indicator
The use of the indicator is so simple that even a beginner can master the basic strategy:
- Login to buy (BUY) is carried out in cases where the indicator point has moved from the position “above the candle” to the position “below the candle.
- Similarly, sell entry (SELL) is done when the point under the candle is replaced by a point above the candle.
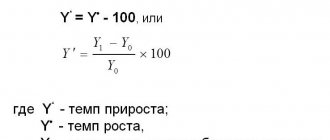
One of the rules of technical analysis states that the time for predicting a trend is determined based on the time frame - the price of one candle is multiplied by 5. For example, if you analyze an hourly chart, a trader can assume that the development of a new trend will take at least 5 hours (the price of one candle is 1 hour* 5 ). If we take the M5 chart as a basis, the trend can be predicted for 25 minutes ( 25 min*5 ).
From the figures it is clear that the indicator predicts a trend reversal - a change from an upward trend to a downward one or vice versa. However, such a simple understanding of the entry point into the market leads to losses in the long run. In fact, parabolic sar is almost never used alone, i.e. this indicator is not a solo indicator. Almost all modern trading strategies involve its use in combination with other trading instruments.
Important! The basic settings of the indicator can be changed by increasing or decreasing the step. However, in most cases, the settings remain by default, since this is the approach that allows you to best predict changes in the cryptocurrency rate.
Working in conjunction with other indicators
Finally, there is the most sensible and most professional approach, according to which the Parabolic SAR indicator should be primarily used to determine the moment to exit the market, but can (although not obligated) also be used to enter the market, but always with confirmation by other indicators. Wilder followed a similar approach, recommending using, for example, his ADMI/ADX (Average Directional Movement Index) indicator as an additional filter.
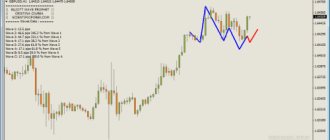
In short, the +DI line (green) should be higher than the -DI line (red) for a bullish trend, respectively, for a bearish trend the picture is the opposite. The black ADX line shows the strength of the trend. A trend is considered strong enough if the indicator value is above a certain threshold value - for example, 25. Also, ADX should not decrease at the time of opening a transaction.
The picture above shows an example of trades on GBPUSD, daily timeframe. Between April 2021 and the current moment, 7 transactions were completed. Of the six closed ones, three brought a good profit, two closed with a small loss and one with a small profit (in fact, the closure occurred within zero profitability). A total of 1039 points were earned. When trading a 0.1 lot, this is approximately $1,000 in profit - quite decent for working on just one currency pair.
Parabolic SAR: history of creation
The author of Parabolic is not some horse in a coat, but the famous trader Wilder . In 1978, the book “New Concepts in Technical Trading Systems” was published, where Wells first described his indicators, which soon gained worldwide fame, namely:
- RSI (Relative Strength Index);
- ATR (Average True Range);
- DMI (Directional Movement Index).
And the fourth one described there was Parabolic. We'll get to his other turkeys later. For now, let's look at the formula just to have a general idea.
Parabolic SAR formula
We are interested in how to use the parabolic in practice, so there is no need to cram this formula or simply memorize it at all. This is just food for thought if anyone is interested in how these parabolic signs are drawn.
SAR up = previous SAR + previous AF (previous EP + previous SAR)
SAR down = previous SAR – previous AF (previous SAR – previous EP)
Where
- previous SAR – SAR value for the previous time period;
- EP (Extreme Point) – the highest value of the current upward trend or the lowest value for the current downward trend;
- AF (Acceleration Factor) – SAR “sensitivity” level;
- AF starts at 0.02 and increases by .02 each time EP increases or decreases.
Don't forget that any indicator should be used as a complement to technical analysis .
Well, if you feel better after the formula, great. If not, forget about it and move on.
Features of Parabolic
To determine the entry point and price development, tools are required that can accurately, but at the same time simply show the situation on the market. One such solution, indicating the direction of the trend and any changes in the trend, as well as visually displaying the optimal moment to enter, was Parabolic SAR. Having learned to accurately interpret its signals correctly, the player will be able to bring his trading to a level of profitability.
Stock analyst Wells Wilder is the author of the analytical solution in question. He managed to create an indicator that includes a simple computational algorithm and a visually understandable interpretation. The trader sees a set of points (marks) that are located above and below the candlestick chart. They are available in two colors. Each chain of the same color shows the direction of the market. When it is changed, the chain changes its position and color indication. The mathematical algorithm of the indicator is based on the following formulas:
- Uptrend = the sum of the two previous indicators SAR and AF. These values are calculated from the sum of the previous EP and SAR levels. This formula calculates the direction and continuation of an uptrend.
- A downward trend is calculated using the formula: upward = difference between previous SAR and AF indicators. These values are calculated from the difference between EP and SAR. The change or continuation of the downward trend is calculated.
The information that is part of the formula means the following:
- SAR of past values, which represents similar intervals (history analysis);
- EP is a display of the highs and lows of trend movements (analyzed on historical data);
- AF is a value that smooths out data obtained in the presence of market noise.
Parabolic acts as a tool that determines trend movements. It is capable of providing maximum high-precision signals, subject to a calm and stable market situation. With increased volatility, it is affected by noise and sharp price fluctuations. At such moments, the accuracy of the signals supplied is greatly reduced. The instrument is very dependent on historical data based on a couple of immediate periods.
Impulse Strategy
Impuls is a Parabolic SAR strategy for binary options, based on the work of two trend indicators and one oscillator. Like most trading systems, it was originally used in the Forex market, but was transferred to BO, since it has no restrictions and can be used on any assets and for any types of contracts.
It should be noted right away that this tactic is exclusively trend-based and does not show effectiveness during a flat. In moments of calm in the market, Parabolic SAR begins to very often rearrange points on different sides of the candle. There are often situations when sequential construction occurs only in two time periods, after which there is an intersection again.
To take this feature into account, we have given a description of the indicator’s capabilities, and in order to be able to say that the market has entered a trend, it is necessary to close at least three candles, the points near which will increase.
In addition, this system is very simple and understandable; there are not a large number of indicators and intricacies of lines among which you need to look for an entry signal. Everything is extremely simple and clear, but first things first.
Installation
To work, we will need four indicators, three of which are standard, and one of which is proprietary, but does not use a special algorithm. Let's start with him. The name of this tool is Color, and in fact it is a modification of the moving average, but unlike it, this tool has the property of being recolored:
- Turns red during a downtrend
- In green when rising
- And yellow during a flat, when the candles are built directly on the line.
You can download this indicator from this link, and in its settings you need to set the calculation period to 60 time intervals. In fact, you can use the usual average, but with this modification it will be easier to look for entry points, and the author of the parabolic SAR strategy for binary options used it.
Next, we install a simple moving average on the chart with a calculation period of 13 and applied to the close. As you might guess, we will enter the market precisely at the intersection of these lines, but since the signal itself is still very weak, we will filter it using the MACD oscillator, which has the following settings:
- Slow EMA 26
- Fast EMA 12
- SMA 1
- Offset 0
- Application to closure.
With these settings, the indicator has a smoothed appearance, and its signal line completely repeats the construction of the histogram bars.
And finally, the hero of our article is the Parabolic SAR indicator, in which, as we said above, you do not need to touch the settings.
Entry points
As in most strategies with parabolic SAR for binary options, this instrument reacts first to changes in the market situation, but it is too early to enter the market, since the signal is too weak and needs confirmation.
The first confirmation will be a breakout of the fast moving average line of its modified neighbor. If a breakdown occurs from the bottom up, this is a signal to increase, and vice versa. As soon as this happens, we look at the oscillator readings, and by this moment it must be on the right side of the zero mark, that is, above it for upward signals, and below for downward signals.
Advice! The COLOR indicator, in addition to its main line, also contains two dotted lines that define a certain price corridor. In this system, these lines are not of interest to us, so so that they do not interfere, you can simply turn off their display in the instrument settings, or color them in the background color of the trading terminal.
And finally, the last signal, which determines our further actions, is the repainting of the COLOR line. If you look at the screenshot in this article, then by the time we received a signal from all the indicators in the system, not only had a stable trend formed in the market, but also the traditional correction had ended, that is, you can enter the market without unnecessary fears.
Expiration and entry points
As mentioned above, all parabolic binary options strategies are trend-based, that is, trading them during a flat is not recommended. Based on this, we select the type of option. Of course, a ladder will look most attractive, but as you know, not all brokers provide it.
You can also try touch or border options, since we are entering the market at a fairly early stage, and by this time the broker’s terminal algorithm will not have time to move the touch level to a significant distance from the price.
Simply put, trading binary options using the Parabolic SAR indicator is possible using any type of contract, the main thing is to choose the right expiration time for them, and here we traditionally start from the time frame we used to find entry points into the market.
As a basis, we take a distance equal to 4 price candles, that is, the time frame that is installed on the chart, simply multiply by 4 and get the expiration time.