To bookmarks
Hello, dear readers!
We continue to get acquainted with technical indicators and I want to talk about a rather interesting representative of them. This is an ATR (Average True Range) indicator , which translated into Russian means “average true range” .
Below in the article I will talk about the benefits of this indicator, the formulas and calculation methods, we will also talk about how to and how not to use the ATR indicator in trading.
Of course, it is definitely worth mentioning who and when this tool was created. The ATR indicator was created by J. Wells Wilder. It was first mentioned in the book “New Concepts in Technical Trading Systems,” dated 1978. At this point, I propose to stop delving into the history, since I am sure that this is not so interesting to you, and move directly to the analysis of this technical indicator.
ATR indicator description
ATR (Average True Range) is an oscillator indicator developed by Wells Wilder, the author of the RSI indicator and various non-standard trading systems. The abbreviation literally stands for “average true range.”
Brief information on the indicator:
- Type of oscillators,
- Platforms - everything
- Timeframe from 1 hour,
- Tools - any
- Trading sessions - everything.
Recommended Brokers
- Roboforex
- AMarkets
- FxPro
- NPBFX
Roboforex - best for beginners and scalpers
- More than 10 years of experience in the Forex market,
- Trusted by 1,000,000 customers in 170 countries,
- Minimum deposit 10$,
- Registration bonus of $30 with the ability to withdraw earned profits,
- 4 types of demo accounts for testing, including NND for scalpig with access to the interbank market and lightning-fast order execution,
- Instant automatic withdrawal of funds,
- Over 1000 positive reviews from traders .
AMarkets - Reliable broker for all traders
- More than 12 years of successful work in financial markets,
- Cool analysts with daily forecasts,
- Promotion: managers proven over the years with a stable return of 1-5% per week,
- New service for RAMM investing
- Top up your account without commission,
- Withdrawal of funds in 2-3 minutes.,
- 98% positive customer feedback .
FxPro is the leader in order execution speed and CFD trading.
- successfully since 2006,
- 11.06 milliseconds - average execution speed
- platform for high-speed and accurate trading,
- Free training webinars on trading,
- 4 licenses from reputable regulators,
- 24/5 – 24/7 customer support,
- No commissions for withdrawing money,
- $100 is the starting amount on any account.
NPBFX is a great option to start trading.
- More than 15 years on the market,
- Lots of tools
- competition ,
- Analytical portal for trade,
- Service for investments zulu trade and npb invest,
- Technical support 24/5,
- No commissions for replenishing your account,
- $10 is the starting amount.
Test for free
A little history
The first mention of the APR appeared in his book “New Concepts of Technical Analysis”. Immediately after the announcement, this indicator began to be widely used on all trading instruments.
In October 1980, Forbes magazine wrote in the USA:
If you are a practicing trader with formed views on the market, then the ATR indicator will give you the opportunity to reconsider your approaches to trading.
The main difference between ATP and other oscillators is that it shows the level of market volatility and allows you to determine what average value in points (on a candlestick chart) a particular financial asset passes.
In the article “volatility” I already mentioned its values for each instrument.
To determine the readings of the ATP indicator, its creator used the highest of these values:
- The difference between the current minimum and maximum values,
- The discrepancy between the last closing price and the current highs,
- The divergence between the last closing price and the current lows.
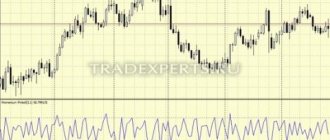
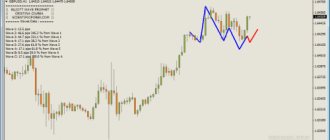
From the screen above we see that the indicator is a single moving average, and in the upper left corner is the indicator value: (14) 61, where
- 14 is the period
- 61 is the volatility value for the period.
The principle of working with the indicator is to determine:
- The average number of points that the price passed during the specified period,
- The moment of trend change. The higher the indicator line, the higher the likelihood of a trend change. If the indicator line is below, then a trend change is unlikely.
How is it calculated
Calculating ATR consists of several steps:
1. First find the difference between:
- current maximum and minimum price;
- the current minimum price and the closing price of the previous day;
- the previous day's closing price and the current maximum price.
2. Of the three obtained values, the largest is selected, on the basis of which a moving average is then constructed.
Today, there is no need to build ATR charts manually - all calculations for the indicator on exchanges and in popular applications like MetaTrader are performed automatically.
Setting up ATR
In all versions of MetaTrader 4/5, the ATP indicator is installed by default.
For it to appear on the chart, you need to go to the indicators section, select the one you need and transfer it to the chart. Next, the settings menu will open. The settings represent one important value in the form of an indicator period, set in the parameters. Additional settings in the form of levels, scale and display have virtually no effect on the operation of the indicator.
The levels are set individually for each trading instrument and serve as an additional signal of a trend change when the value approaches a high level.
ATR is used on any time frame, but as you know, the higher the time interval, the higher the accuracy of determining market parameters. I recommend using the H4 timeframe and higher.
How to set the ATR period depending on the working timeframe:
| Timeframe | Indicator period |
| M5-M30 | 100 |
| H1-H4 | 150 |
| D1 | 14 |
| W1 | 4 |
| M1 | 6 |
The indicator period in “14” means the calculation of its values for the last “14” candles. Accordingly, if our timeframe is higher, for example D1, then it is logical to use analytics for 14 days, which means the APR period will be 14. You can experiment with the periods yourself, depending on your preferences.
Setting Average True Range
Just one unfortunate setup. As usual, to open it, you need to click on the gear icon.
The Inputs menu will open, in which the value of 14 days can be changed to any other.
I wouldn’t touch the value 14 unless absolutely necessary - it does its job well.
In the Style menu you can change the appearance of the line, its thickness and other characteristics.
ATR indicator how to use
When using ATP, we must understand that it is not a trend indicator. Therefore, the first thing to do is to determine whether there is a trend in the market. If it is present, then we move on to identifying volatility and searching for entry points.
ATR volatility indicator
The most useful function that the indicator will give you is determining the average volatility over a certain period of time.
Let's imagine the situation:
You are trading on the daily chart. For each trading instrument, approximately the same volumes are traded per day with the same number of players. Knowing the average range that the price moves through in 1 candle (day) in points, we can make forecasts for entering and exiting a transaction.
Application example:
- The average movement of the EUR/CAD pair per day is 242 points (APR period is 30 days).
- If you are trading intraday and have found a signal to open a trade, then it is worth checking how many points the pair has already passed during this session.
- If the instrument moved by about 50 points, then you can potentially take the remaining 200.
- On the other hand, if the pair has already dropped to 210-230 points, then based on the average volatility, its daily range is almost exhausted and you should refrain from the transaction.
I recommend using this method of analysis according to the following principle: We analyze volatility for a higher period than your trading timeframe. This approach will allow the trader to see the boundaries of price movement more broadly.
Application
Most often, ATR is used to correctly set stop loss levels, or more precisely, trailing stops. How it works?
Example with exit from trading:
You have opened a long position. The price meets your expectations and is rising. When prices fall by a certain amount, the trailing stop is triggered and the order is closed. This allows you to simultaneously reduce losses and lock in profits.
For reference:
- Stop loss is an option that allows you to automatically close an order when the price of an asset (cryptocurrency) falls to a certain level. This order is called a stop order.
- Take profit is an option that allows you to automatically close a stop order when cryptocurrency prices rise to a certain level. Take profit can serve as insurance against unsuccessful execution of an order, for example, if the connection is lost. Read more: What are Stop Loss and Take Profit in trading?
- Trailing stop (also known as “trailing stop loss”) is a modification of stop loss, where the threshold price, if it falls to which the order is closed, is set at a certain distance from the current profit. As prices and profits rise, the lower threshold value follows suit.
The ATR, as stated, is often used as a trailing stop. View the current average true range values. Place a stop loss that is a multiple of the indicator. Typically a stop loss of 2xATR is set.
This means that the stop loss is 2xATR below the entry price if you buy, or ATR/2 above if you are short.
If you are long and the price movement is upward, the stop loss will follow the price at a distance of 2xATR. In the case of a long position, the stop loss only moves up, not down. Once the stop loss has moved up, it will remain there until the next up move, or until prices fall to the trailing stop, after which the trade will be closed.
The same pattern works for a short, only the stop loss is moved down instead of up. Instead of 2xATR distance for a short, ATR/2 is used.
For reference:
- Long is a position in which a trader buys cryptocurrency, expecting it to grow and, accordingly, trying to resell it at a higher price.
- A short is a position in which a trader sells a cryptocurrency in anticipation of its further decline. This allows the trader to gain funds and use them to buy even more digital coins. Read more: What are Short and Long in trading?
Similarly, ATR can be used as a reference not only for stop loss, but also for take profit. In the case of Forex markets, this is done by subtracting the number of pips passed by the price from the ATR value in points. It is recommended to set the take profit slightly below the received figure.
Pips are another concept from Forex. The value of currencies is determined to the fourth decimal place. This sign is called a pip.
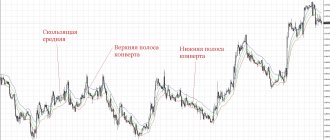
Simple ATR Strategy
There is no working trading strategy using only the Asia-Pacific region. We definitely need an additional indicator, for example MA. With its help, we will see a clear direction of market movement.
Values:
- Currency pair USD/JPY,
- ATR – period 14,
- We impose an MA with a period of 30 on the ATP.
The signal to open a position will be the intersection of two lines. In this case, we open to buy USD/JPY.
I recommend placing stop loss below/above local support or resistance levels. Don’t forget to follow the rules of money management.
Checking the indicator during periods of strong fluctuations
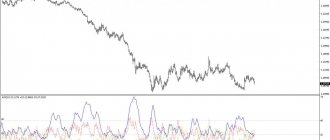
Let's look at an example of how the indicator works during a period of market instability. We take as a basis:
- XAU/USD pair,
- Timeframe D1,
- We use ATR with a period of 14,
- MA with a period of 30.
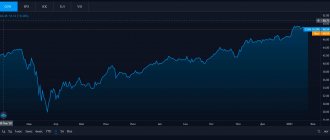
Based on the chart above, it is logical to assume that the market should change the direction of the trend. We see that in the current situation with the pandemic and uncertainty in the markets, the ATR indicator is not working consistently. This applies to many indicators. In difficult market conditions, I recommend relying on fundamental analysis and using the oscillator to find turning points.
For example, gold (XAUUSD) has always been a protective asset and during difficult economic conditions the demand for it always increases. Therefore, when using ATR on this currency pair, it is better to trade only buy trend change signals.
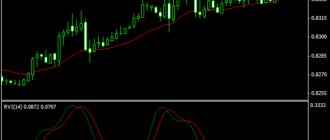
ATR indicator application
The ATP indicator can help in setting the stop loss level. To do this you need:
- Select a currency pair,
- Understand market entry strategy
- Determine the trend
- Apply ATR with the required settings,
- The ATR value multiplied by 2 or 3 will be the number of stop loss points.
The value is 153 x 2 = 306, or 153 x 3 = 459. We take the average value and get 382 points - this will be the guideline for setting stop loss.
To be honest, I would not recommend relying 100% on these calculations. At the stage of testing the indicator, it is better to find good levels and place a stop loss next to them.
Download ATR indicator
As I described above, ATP is present in 98% of MetaTrader 4 and 5 terminals. If for some reason you could not find it in your trading terminal, then you need to download it:
. The archive contains versions for two MTs.
Installation process:
- In the metatrader, click – file – data directory,
- Go to the folders MQL5\Indicators\Examples,
- Insert ATR files,
- We reboot the terminal - the indicator is installed.
Advantages and disadvantages
The advantages include:
- Universality of application in automated systems,
- Easy setup
- Availability in all trading terminals,
- Easy and accurate analytics of the average volatility of any instrument.
Flaws:
- Application in trading requires additional indicators,
- At short time intervals it can give many false signals. To reduce them it is convenient to use levels.
Personal experience of use
In my trading system, I use this indicator when analyzing any trading instrument, when I need to find out its average price range. Of course, during a period of strong market imbalance, its values will be more conditional, but at a minimum, it will accurately display to you the minimum values that the price passes for the period we need. Try using ATR in your trading and you will realize how many mistakes you have made and how many opportunities you have missed.
Volatility filter for programmers
And as a bonus for those who know (or are learning) to program, I decided to post my version of a function that prohibits trading during high volatility.
extern bool UseATRFilter = true; extern int ATRPer = 14; extern int EnvPer = 240; input ENUM_MA_METHOD EnvMode = MODE_EMA; extern double EnvDev = 10; bool ATRFilter() { if(!UseATRFilter) return(true); double ATR[500]; for(int i=0;i<=499;i++) { ATR =iATR(_Symbol,PERIOD_M5,ATRPer,i+1); } ArraySetAsSeries(ATR,true); double ATR1=iATR(_Symbol,PERIOD_M5,ATRPer,1); double EnvUp=iEnvelopesOnArray(ATR,0,EnvPer, EnvMode,0,EnvDev,MODE_UPPER,0); if(ATR1
This function returns false if the current volatility in the market is too high for trading, and true if the ATR indicator is under the Envelopes channels. The function really significantly improves the results of advisors that use the principles of working in a channel (at least those in which I tried to use it). In addition, I think it will also be useful for trading systems, for which, on the contrary, a low level of volatility brings losses (but I have not yet tested it in this role).