The name ADX is an abbreviation for Average Directional Movement Index, or Average Directional Movement Index or simply Directional Movement Index. ADX is one of the best indicators that shows the strength of a trend. This indicator was created in 1978 by trader J. Wells Wilder, well known in the technical analysis community. To use this indicator correctly, you need to carefully study its structure.
The ADX indicator is used in the Forex market, the stock market, when trading indices and commodities. It is definitely on the list of the most popular technical analysis indicators. Correct interpretation of the average directional movement indicator values will help determine the current market trend, as well as generate appropriate signals for opening long and short positions. Next, we will look at the signals coming from the ADX indicator and analyze its structure.
ADX - construction and structure of the average directional movement index
ADX is a so-called trend indicator. The purpose of indicators of this type is to correctly determine the direction and strength of the trend prevailing in the market. There are three market states: upward price movement, downward price movement and sideways. When we say that the market is in a trend, we mean an upward or downward directional price movement. If they say that there is no trend in the market, it means that the price is moving sideways or is in consolidation.
The ADX indicator consists of three lines. The first line is the ADX line, the second and third, respectively, are the +DI and -DI lines.
The +DI line is called the demand line or uptrend line. The -DI line is a supply line or a downtrend line. It is good to use green for the +DI line and red for the -DI line. Interpretation of current signals, primarily from line crossings, will be much more intuitive.
conclusions
To summarize, let's briefly look at the strengths and weaknesses of the ADX indicator.
Advantages:
- Simplicity - if you do not use any additional lines, but only the ADX itself, you will get a simple tool for measuring the strength of a trend.
- Minimum settings - there is no need to change the user settings for the period, which by default is 14, and it is suitable for all trading instruments.
- Invisibility - If you use ADX for automatic stock selection, as described in this article, then there is absolutely no need to put it under the chart and burden your workspace.
- Reliability – has proven itself well for searching for securities that are trending or consolidating.
Flaws:
- A trend indicator, by definition in technical analysis, is a lagging indicator. You should not hope that a consolidation breakout or similar things should necessarily occur at the level of 25-30. First, the price will take action, and then ADX will display them - it won’t work without a delay.
- A lot of noise - different parameters, additional lines, modifications and analogues - all this only distracts the trader from the main thing - the chart and price dynamics.
There were more pros than cons - it turned out to be a super indicator. Maybe you have your own thoughts - write them in the comments. Thank you for your attention and stay tuned to the trading blog. Profit and prosperity!
Formulas for calculating ADX indicator values
To calculate the individual values of the ADX indicator lines, we need: minimum prices, maximum prices and closing prices. Most materials and books that mention the average directional movement index recommend using it on the daily timeframe. However, keep in mind that most of this material is a reprint of the works of Welles Wilder. In the 70s, due to the weak computerization of the industry, the most popular and often the only time slot was daytime. We recommend testing the ADX indicator on other timeframes, not just D1.
Before calculating the values of the +DI and -DI lines, we must calculate the values of the directional movements +DM and -DM.
How to calculate the value of line + DI in the ADX indicator?
Move up = today's high - yesterday's high (assuming we're using a daily time frame).
Move down = yesterday's low - today's low (assuming we are using a daily time frame).
If Move up is greater than Move down, and the value of the upward movement is greater than zero, then the value + DM = Move up , in all other cases + DM = 0.
If Move down is greater than Move up, and downward movement value is greater than zero, then the value is -DM = Move down , in all other cases -DM = 0.
After selecting the period of our indicator (Wilder initially used a value of 14), the values of the +DI and -DI lines are calculated:
+DI = 100 times the smoothed average of the parameter + DM divided by the ATR indicator value
-DI = 100 times the smoothed average of the parameter + DM divided by the ATR indicator value
The average smoothed by the parameter + DM is calculated for the period we have chosen. The longer the period we take for calculations, the smoother the line will be.
How is the third line (ADX line) calculated?
ADX = 100 times the smoothed average of the absolute value (+DI - (-DI)) divided by the sum (+DI + -DI).
The indicator value can be changed by changing the period, changing the interval, and also changing the moving average calculation method. Trading terminals usually have exponential, weighted and simple moving averages.
Summarizing
The effectiveness of ADX has been tested for decades by traders around the world in different markets. The fact that the indicator is still popular and is added to almost all trading terminals only once again proves its usefulness .
Despite this, I caution you not to rely solely on his signals in your work. The strategy given in the example is rather an exception to the rule. Most often, ADX is used as a filter , or its signals are supplemented with other indicators/graphical constructions .
This concludes the ADX review. Don’t forget to subscribe to my blog updates, this was not the last useful material. See you again!
If you find an error in the text, please select a piece of text and press Ctrl+Enter. Thanks for helping my blog get better!
How to add the ADX indicator to the chart in MetaTrader 4.0?
The most popular trading platform in the world designed for individual traders is MetaTrader 4.0. Adding the ADX indicator to MT4 is extremely simple and intuitive. After selecting the chart to which we want to add our indicator, we go to the “Insert” function, then “Indicators”. Select "Trend" from the drop-down list and then select Average Directional Movement Index from the list.
After adding the indicator, a window appears to configure the corresponding parameters of the ADX indicator. The window consists of 4 small windows: Options, Colors, Levels and Display.
On the options tab you have the option to select a period. Changing the chart time frame, for example, from daily to hourly, will result in data from the hourly timeframe being used to calculate the indicator, rather than from the daily one. By changing the “Apply to” parameter, we can specify which price values will be used to calculate the indicator lines: opening, closing, maximum, minimum, etc. prices. Changing this parameter does not cause sudden changes in the calculation of the ADX indicator value. By selecting the line color in this window, you configure only what color the ADX line will be painted (the +DI and -DI colors are configured in the following tabs).
In the case of the ADX indicator, there is no point in setting the Fixed Minimum and Fixed Maximum levels. The mathematical formula used to calculate the ADX indicator causes its fluctuations to automatically change from 0 to 100.
On the “Colors” tab we have the opportunity to customize the graphical display of two consecutive lines of the ADX indicator. Recall that the +DI line illustrates the strength of demand and, therefore, the strength of the uptrend. The -DI line represents the strength of supply, which means it illustrates the strength of the downtrend.
Working with cryptocurrency
The ADX indicator can be used to work with various markets: futures, stocks, fiat currencies. It is suitable for both advisors and the cryptocurrency world, although it is less adaptable to a relatively new market.
To use it, you can use the Tradingview charting service or use the functionality of some cryptocurrency exchanges. At the same time, giants such as Binance do not provide the opportunity to work with such a popular indicator, and BitMex opens to the trader a simplified version of ADX with a single line (instead of the standard three).
Among the crypto platforms that fully support the use of the average direction index, Huobi can be distinguished. Select a trading pair, click the “Index” button on the top panel of the chart, find the desired instrument and start analysis. Please note that the functionality of the exchange allows you to use ADX with one or three lines at your discretion.
If you need to change the settings, click on the corresponding icon next to the ADX value, select the period or style as you wish.
The screenshot above shows how to configure the indicator using Tradingview. Please note that this is a simplified version, so it is best to use specialized exchanges to evaluate trends during cryptocurrency trading.
How to correctly interpret the ADX line?
In our case, the ADX line tells us whether there is a trend in the market or not. Notice that it doesn't tell us anything about the direction of the trend. It is assumed that the ADX value is below the level of 20, then a sideways trend is observed in the market. If the value exceeds 40, it means that the market is experiencing a strong upward or strong downward trend. The ADX line very rarely exceeds the 60 level (which is due to mathematical calculations of the indicator values).
You can add levels for the ADX indicator in the indicator settings, in the “Levels” tab.
The ADX line is most often used as a filter for signals from the intersection of the +DI and -DI lines. When the intersection of these lines occurs below level 20, you need to skip such a signal. If the intersection occurs when ADX is above the 20 level, such a signal can be considered as high-quality and can be traded as a must.
| ADX value | Trend Power |
| 0 — 20 | No or weak trend |
| 20 — 40 (50) | Strong Trend |
| 40 (50) — 60 | Very strong trend |
| 60 — 100 | Extremely strong trend |
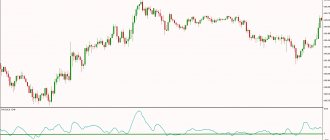
The figure below shows the ADX line of the Average Directional Movement Index indicator on the AUDUSD chart in MetaTrader 4.0. Red horizontal lines indicate ADX line levels for which we are talking about no trend or a strong trend. The chart clearly shows that the ADX line value very rarely exceeds 60.
Should I use levels 20 and 40 in the ADX indicator?
Wells Wilder mentioned levels 20 and 40 in his works. It should be added, however, that this indicator was created in the late 70s. At this time, it is necessary to study the behavior of the ADX indicator on an individual instrument accordingly, and adjust these levels according to market volatility. For example, for Forex currency pairs, the value of this indicator may have a smaller range than for indices and commodities, so if you focus on parameter 20 when trading Forex, it may turn out that the ADX indicator will not give a single signal. Correctly adjusting these levels requires performing appropriate backtests for each currency pair.
The intersection of the +DI and -DI lines is the best signal coming from the ADX indicator
The main signal obtained as a result of the interpretation of the ADX indicator is the intersection of the demand line + DI and the supply line -DI. When the +DI line crosses the -DI line from below, we receive a signal to open long positions (buy). If the -DI line crosses the +DI line from below, we get a sell message (short positions).
Examples of signals coming only from the intersection of the +DI and -DI lines
Stop losses
Wilder placed a stop behind the extremum of the candle where the ±DI lines intersected . Nowadays, this approach does not always , so if signals of this type are used in work, then the stop should be placed, for example, beyond a local extremum or a fixed SL depending on the rules of the vehicle.
In general stop loss is an important element of any trading strategy; it allows you to limit losses and increases trading efficiency. My post on what a stop loss is looks at this issue in more detail.
As an option, you can use a simplified version of this type of signal, taking into account only the intersection of ±DI lines.
In addition to these types of signals, you can find recommendations for using divergences on ±DI (in a growing market - along +DI, in a falling market - along -DI). very rarely on this indicator and it is better not to rely on them too much . If you are interested in working on divergences, I advise you to pay attention to the MACD . We have already discussed how to use the MACD indicator; divergences work really well on it .
Trading strategy based on ADX: we take into account the levels of the ADX line and the intersection of the +DI and -DI lines
Once we know how to interpret individual lines, we can create a simple trading strategy.
- When the ADX line is above level 20, and the + DI line crosses the -DI line from bottom to top, we can consider opening a buy trade;
- When the ADX line is above the 20 level and the -DI line crosses the +DI line from below, we receive a signal to open a short position
- If the ADX line is below the 20 level, we should be out of the market.
The Directional Movement Index (ADX) indicator consists of the following lines: ADX, +DI and -DI
In general, ADX shows the strength of a trend. The higher the ADX value, the stronger the trend. It should also be kept in mind that market movement can be directed both up and down, and ADX itself does not distinguish between upward and downward market movement. The ADX value may be rising while prices are actually falling.
The direction of market movement can be determined by comparing +DI and -DI. If +DI is higher than -DI, then the trend is upward, if vice versa, then the trend is downward. A trend is considered pronounced if the ADX value > 20. There is also a point of view that in addition to exceeding the limit of 20, ADX should also increase and in this case the trend is strong. But there is no doubt that when ADX < 20, the trend is sideways. For hourly timeframes, these intervals can also be selected, but these caveats should be taken into account. When using oscillators to determine the direction and strength of a trend, it should be taken into account that the signals they produce are delayed in time, and if ADX is calculated using a shorter period, then a significant number of unnecessary crossings or highs will appear that determine the end of the trend.
Pros of the ADX indicator
- Ease of use
- Clear buy and sell signals
- Ability to determine trend strength
- a small number of parameters to configure
- possibility of defining consolidation
Disadvantages of using ADX
- needs to be configured before use
- You may need to use other indicators to filter signals
- The need to check signals
- Generates low quality signals on lower timeframes
Advantages and disadvantages
Flaws:
- Requires testing on demo accounts,
- Not adapted for all currency pairs,
- Works poorly on assets with low volatility,
- May be difficult to understand for beginners.
The ADX indicator is not the holy grail, as it often changes its direction at certain points, giving many false signals. In this case, it is important to determine the most suitable indicator period.
However, if a trader integrates the ADX along with other indicators (such as a trend line or technical analysis patterns) into his trading strategy, then false ADX indicator signals can be minimized and trading highly profitable.
For trading I recommend reliable, proven brokers:
- Roboforex
- AMarkets
- FxPro
- NPBFX
Roboforex - best for beginners and scalpers
- More than 10 years of experience in the Forex market,
- Trusted by 1,000,000 customers in 170 countries,
- Minimum deposit 10$,
- Registration bonus of $30 with the ability to withdraw earned profits,
- 4 types of demo accounts for testing, including NND for scalpig with access to the interbank market and lightning-fast order execution,
- Instant automatic withdrawal of funds,
- Over 1000 positive reviews from traders .
AMarkets - Reliable broker for all traders
- More than 12 years of successful work in financial markets,
- Cool analysts with daily forecasts,
- Promotion: managers proven over the years with a stable return of 1-5% per week,
- New service for RAMM investing
- Top up your account without commission,
- Withdrawal of funds in 2-3 minutes.,
- 98% positive customer feedback .
FxPro is the leader in order execution speed and CFD trading.
- successfully since 2006,
- 11.06 milliseconds - average execution speed
- platform for high-speed and accurate trading,
- Free training webinars on trading,
- 4 licenses from reputable regulators,
- 24/5 – 24/7 customer support,
- No commissions for withdrawing money,
- $100 is the starting amount on any account.
NPBFX is a great option to start trading.
- More than 15 years on the market,
- Lots of tools
- competition ,
- Analytical portal for trade,
- Service for investments zulu trade and npb invest,
- Technical support 24/5,
- No commissions for replenishing your account,
- $10 is the starting amount.
Test for free
Download ADX indicator modifications
ADX + Stochastic_alerts - indicator for the MT4 terminal
This indicator combines two well-known instruments: Stochastic and ADX. The work of the indicator is that it signals if the Stochastic and ADX signals coincide. You can make a separate sound signal for Stochastic, and separately for ADX.
Expiration
Just like money management, the correct use of expiration in trading will be a 100% guarantee of success in options. Expiration (from the English Expiration, “end”) is the moment when asset trading has ended, participants are informed of the results of the work and whether the account will be replenished in the event of a positive forecast. In many ways, thoughtful expiration is your profitable strategy that will bring you stable profits.
Types of options:
- Ultra-short options - 30 seconds - 5 minutes.
- Short-term options – 10 minutes – several hours.
- Medium-term options – one day – several weeks.
- Long-term options – month – six months.
Is expiration extension allowed?
Allowed, but not on all trading platforms. If during trading you realize that your forecast is wrong, you can safely extend the expiration, reducing your losses.
Expiration rules:
- For traders who are just taking their first steps in options, it is better to initially work with long-term expiration, the big advantage of which is stable trading with minimal risks with your funds.
- For traders who already have extensive experience in options, it is better to base their choice of expiration on a more comfortable trading style. In addition, when choosing a broker, find out whether there will be an opportunity to increase expiration during trading, which will minimize your losses if the outcome is incorrect.
- For market participants who want to get instant money from trading, it is better to work with short-term (a minute - several hours) expiration, which will bring the first money in 30 seconds. In this case, always remember about the risks of turbo trading.
- Market participants who want to receive stable money are better off with long-term expiration, which has a calmer trading style, it is predictable and less risky.
Expiration in strategies with DMI
Expiration when signal crosses +D L and –D L
Short-term trading : allowed; has increased risks; It is worth using additional indicators in order to avoid false signals and get a good income. Medium-term expiration : allowed; With such trading, you can observe the market forces more, use indicators and make the right forecast. Long-term expiration : also allowed; with such trading, you can use all your accumulated experience: functional and technical analysis, indicators and trading strategies, all this will allow you to achieve good results.
Expiration on DMI
Short-term trading : allowed; Despite the fact that express trading is characterized by increased risks, if you structure your work correctly, you will receive more than one productive transaction. Medium-term expiration : allowed; With such trading, you can more calmly observe market forces, use indicators and make the right forecast. Long-term expiration : also allowed; with such trading, you can use all your accumulated experience: functional and technical analysis, indicators and trading strategies, all this will allow you to achieve good results.
Expiration on ADX
Short-term trading : allowed; Despite the fact that turbo trading is, first of all, increased risks, if you structure your work correctly, you will get more than one productive transaction. Medium-term expiration : allowed; With such trading, you can more calmly observe the market forces, look at the results of these indicators and make the right forecast. Long-term expiration : also allowed; with such trading, you can use all your accumulated trading experience: functional and technical analysis, indicators and trading strategies, all this will make it possible to make the correct forecast and make a good profit.
Expiration in the “ DMI+ Stochastic ”
We present to your attention a simple but productive trading strategy that uses the DMI and Stochastic indicators, combining the capabilities of a trend indicator and an oversold-overbought oscillator. DMI will show entry points, and Stochastic will show oversold and overbought.
Short-term trading : allowed in such a profitable trading strategy, it will allow you to receive high-quality signals and earn a decent income. Medium-term expiration : allowed; such expiration in a calmer trade, using two reliable instruments, will allow you to get a good income. Long-term expiration : also allowed; Such trading, in addition to the opportunity to take advantage of reliable Stochastic and DMI signals, will allow you to apply knowledge in the field of fundamental and technical analysis, which will give you a decent income.
As you become more immersed in trading, do not forget to pay attention to studying the features of using expiration in order to decide on a comfortable trading style for you. To do this, use the convenient terminal of our recommended broker Finmax. Among its advantages: a simple functional platform, a convenient personal account, the possibility of a large selection of options and expiration (from 30 seconds to six months), etc. Start implementing your profitable strategy now and go to the broker’s website finmaxbo.com.