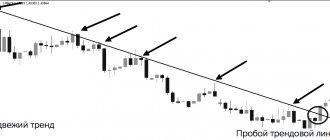
Hello, dear blog guests, today I decided to tell you about the Standard Deviation indicator, which is implemented in the MT4 trading platform. The name of the indicator is translated into Russian as “standard deviation,” which makes it clear that it works based on statistics. The indicator displays the deviation of the current price level from the average value. The principle of operation of the tool is borrowed from statistics; you can see the calculation formula in the following photo:
In the instrument characteristics, you can change the type of moving average, as well as the prices that will be used for calculation.
Standard deviation is an indicator curve that moves up and down depending on whether previous price values are higher or lower than the current ones.
If the curve is very high, this indicates that a strong price deviation has just occurred. After a strong deviation occurs, you should wait for the impulse to weaken.
Description of the indicator operation
Standard Deviation is translated as standard deviation - a mathematical term that describes the indicator of dispersion (dispersion) of the values of a random variable. The SD indicator is based on the formula:
It is completely identical to the calculation of the standard deviation, determined relative to period n as the squared difference of the current closing price of the Close candle and the value of the simple moving average of the selected n-period, divided by the number of candles from this period. In standard settings it is equal to the number 20.
In essence, the indicator curve is nothing more than trading volatility. The curve has nothing to do with the direction of the trends on the chart. It grows as a strong movement develops, directed in any direction, and falls when the range of candles decreases, but with a delay, which is associated with the “disease” of the middle line.
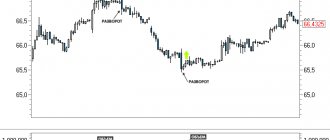
Pay attention to the two zones of the EURUSD quotes chart, marked with a marker. The strong growth of the euro at the end of the day led to abnormally high Standard Deviation values. The next day, the correction “killed” the upward movement with a strong downward trend.
However, volatility showed a drop due to the fact that the moving average contained a significant portion of yesterday's data. The previous range of changes in candles was much higher than the current ones; the SD curve began to rise as soon as the candles of the new session fell into period 20.
Tool optimization
The instrument has only one setting, which is responsible for its period. By default, this setting has a value of 20, which means that when performing all the necessary calculations, the indicator will use the last twenty periods.
Thus, if you use the D1 time period, the tool will use information from the last twenty days.
As the indicator period value increases, its sensitivity will decrease, and as it decreases, the sensitivity will increase.
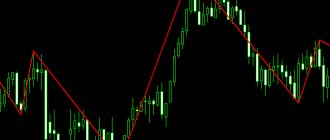
The picture below shows an indicator with a period of 40.
As you may have noticed, the tool curve has become smoother. The indicator does not produce very low or very high readings.
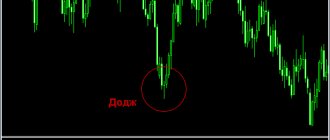
The following photo shows the indicator readings with a period value of 10.
A tool with a short period produces significantly more signals for opening orders, but some of them are false.
Most traders prefer to use this tool with a standard value, since in this case the indicator produces a sufficient number of signals, the reliability of which is at a decent level.
Using the indicator in trading
The Standard Deviation indicator is practically not used by modern traders separately or as part of trading systems due to the more visual implementation of its formula in Bollinger Bands. As shown above, the SD curve is not synchronized with quote trends - it is a numerical indicator of volatility. In contrast, Bollinger Bands conveniently display critical limits of price deviations directly on the chart.
Traders who prefer to receive pure volatility signals from the Standard Deviation indicator use them to confirm countertrend entries and early detection of intraday trend reversals.
Transactions against the trend are determined according to the “three sigma” rule - a postulate of probability theory. It states that 99.73% of the values of a random, normally distributed variable will not exceed three times the deviation from the average values of the selected set (interval).
To find the entry point into a countertrend, determine the average volatility value by overlaying a long-period moving average with a period of 200 on the Standard Deviation chart. Its value is multiplied by 2 - the coefficient was calculated by D. Bollinger when creating the indicator. Once the SD line exceeds twice the average, the trader opens:
- Short on the market, if a growing trend is identified at half the wave of rising volatility;
- Long at the current price, if a downward trend is detected halfway through the wave of rising volatility.
The strategy for detecting an early trend reversal is based on the assumption that a sharp drop in volatility to minimum values often coincides with a change in the mood of major players. They are determined by the rule for constructing a support line so that as many historical extreme values as possible fall on the drawn line.
As soon as the Standard Deviation curve falls below the minimum level, the trader:
- Opens Long on the market if half of the indicator wave corresponds to a falling trend;
- Short on the market, if a growing trend was recorded at half the volatility wave.
Money management of the two presented trading tactics is determined by other indicators necessary for the implementation of a full-fledged trading system. It is important to note that in the case of counter-trend trades, the trader should hold the position for the short term. If you choose early trend detection, the position is held longer, but the stop loss is set to breakeven at the first opportunity.
Results
At the end, we will provide a description of the pros and cons of the Standard Deviation indicator. The indicator is good because it:
- has a clear structure;
- makes it easy to read signals;
- predicts the magnitude of future price movements.
Among the disadvantages it is worth noting:
- impossibility of using StDev as a separate indicator;
- little analytical value;
- risk of receiving false signals.
We hope that after our description, you will want to test how this tool works in practice.
Try StDev with a free demo
Share link:
- Click to share on Twitter (Opens in new window)
- Click here to share content on Facebook. (Opens in a new window)
Standard Deviation Settings
The indicator settings window contains one parameter that affects SD indicators - period. The trader must select the number of candles over which volatility will be calculated. The default value of 20 is suitable for the H1 or D1 timeframe; when choosing other options, testing is necessary.
The “Levels” tab can be used to pin average and minimum volatility values on the chart so that it is convenient to implement signals from the two methods of using SD described above.
Examples of using
Example 1. The chart shows the price of the Dow Jones index on an hourly time frame. The main information about the stock market is that it is always in an upward trend, except for crisis years. Since their inception (more than 100 years), the indices have been growing. Therefore, I recommend shorting only in exceptional cases. More often you have to look for cheap prices to purchase. In other words, try to determine the global trend and look for cheap purchases or expensive sales in its direction.
Note that with a deviation (discount) of -1.3%, the index is actively bought back and is not allowed to fall further. When buying at 1 point, the market grew for quite a long time, however, at points 2 and 3 we could have exited with a profit or without a loss. Because they bought it quite cheaply.
Example 2. The chart shows the price of Bitcoin on a four-hour time frame. Bitcoin has an upward trend. Therefore, as in the stock market, they should not short, except in rare cases. Therefore, we try to find favorable prices for purchases.
The graph shows that when the deviation indicator reaches about -6%, sales stop and the bravest ones buy cheap. “Price deviation MA” will prevent you from making the mistake of buying on highs.
Example 3. The chart shows the EUR/USD currency pair on a four-hour time frame. With currency pairs things are different. They are based on the refinancing rates of national banks. Therefore, one currency will not change tens of times from another. Therefore, they are traded in a kind of channel. For channels or flats, you can use both upper and lower boundaries.
Using EUR/USD as an example, the indicator channel value turned out to be 0.8. When buying or selling from this border, it was always possible to close the deal when the MA was reached or take a larger movement. The main thing is to clearly act according to the strategy. If you don’t have a strategy, then you should take a closer look at this indicator so as not to buy high and sell low.