The RVI indicator (stands for Relative Vigor Index and is translated from English as “vigor index”) is an effective and popular technical tool created by the famous trader John Eilers. The world first learned about the indicator in January 2002 thanks to a publication in the magazine Stocks and Commodities.
The principle of operation is based on the same idea as the functioning of other oscillators: the closing price is most often located above the opening price if the trend is upward and below the opening price if the trend is downward. The indicator is trend-based, so the main task of a trader when working with it is to follow the current trend. On the other hand, line crossing entries can include it in the class of oscillators.
Calculated using the formula:
RVI = (close-open) : (high-low)
The indicator compares the closing level of a period with the opening level and demonstrates the actual change in value for the period, which is normalized to the maximum range of a given period (this can be an hour, a day). The resulting value is smoothed over a specific set of moving average periods. The second line is a weighted moving average with a period of 4.
The tool is included in the standard set of the MetaTrader4/5 trading terminal, so there is no need to download it additionally.
Setting up the RVI indicator
The only key parameter here is Period , which defaults to 10 . This period is selected empirically for each currency pair and timeframe separately, simply by brute force. You must ensure that the indicator highs coincide with the price highs on the chart. Start with 10 and see what happens. It is very likely that the result will be quite satisfactory and you will not want to change anything.
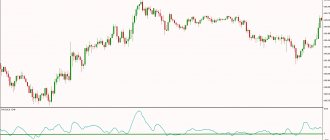
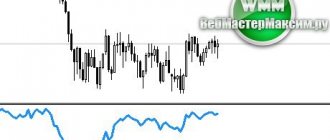
Approximately like this as shown in the screenshot. The extrema of the indicator coincide with the extrema on the chart. USDCAD chart , the RVI Period here is 5 .
In the Levels , you can add some levels that are significant to you to the indicator window, perhaps similar to the overbought-oversold levels of stochastics.
How to read the indicator and its signals
To receive a trading signal we need:
- The green line of the indicator was in the upper (for a bullish trend) or lower (for a bearish) area of the indicator window. The upper region is above zero, the lower region is below zero. Moreover , the closer to the extremes (the higher or lower), the better.
- Next you need to wait until the red line crosses the green one.
Please note that when the indicator lines intersect at the zero mark or very close to it, it is better to ignore such a signal.
That's all . I will add that:
- If the green line of the indicator is in the upper area, it has been crossed by the red line and now the red line is above the green - this is a signal of the end of the bullish trend and entry into sales.
- Well, and vice versa, if the green line is below and they intersect with the red line so that now the green line is above the red one - this is a buy signal.
As you can see, nothing complicated. Take a look at the chart and you will understand everything.
Cautions
Like absolutely any indicator, the Relative Vigor Index will sometimes give false signals. And like any indicator, it requires additional confirming signals . You can’t just take and enter the market based on a signal from just one indicator.
Therefore, for full-fledged and profitable trading, it is necessary to combine RVI with other indicators or technical analysis techniques. For example, with Japanese pricing models . I'll show you an example of work now.
RVI strategy
We look at the screenshot and see the Hammer signal. As we know, this is a signal of a bearish trend reversal. We look at the RVI indicator window and see that it also gives us a buy signal! This means that both signals indicate the same thing - it’s time to buy. The signals confirm each other. We enter into purchases, set a stop loss for the nearest local minimum (in this case, the tail of the Hammer candle), set a take profit at our discretion - either multiply the stop loss by 2 or 3, or set it at the nearest strong support-resistance level (read how to find them be sure to follow the link) and sit on your butt just waiting for profit.
No magic, it's simple! I recommend that you subscribe to our newsletter - at the bottom of the post, then join the public VK to also keep abreast of all the news, including daily Forex analytics and surf the site,
Mathematical principles of operation
At first glance, the RVI indicator is very similar to the Stochastic indicator. When you install a technical indicator on a chart, you will easily notice their similarities, but according to their basic principles, these two indicators are radically different.
It is difficult to give a universal answer as to which of them is the best of its kind. In some market conditions, Stochastic will work better; if they change, the RVI indicator will become the leader. Do not forget that Forex indicators are just signals for you, and unjustified trust in them can lead to serious miscalculations and large losses. If they clearly signal a potential trade entry, be sure to look for other confirmations of this!
I think you already realize that, at its core, trading is just a certain probability. No one will ever give you a guaranteed answer as to what the market trend will be today and in what direction the price will move. You can easily do without this information, because it is quite possible to earn money without this knowledge. A trader can make a big profit even on a couple of successful trades, even in combination with unprofitable trades. Do not strive for a large number of transactions, remember that it is about quality, not quantity . Beginning traders often set a take profit equal to the stop loss. But in such a trading strategy, in order to make good money, it is necessary to conclude about 70 percent of profitable transactions from all entries. In conditions of high volatility and uncertainty of the market, even experienced traders find it quite difficult to achieve such a high profitability in the transaction ratio. Competent traders allow profits to grow when the market is ready for it.
By setting a take profit that is 4-5 times larger than the stop, you, accordingly, provide yourself with a large mathematical expectation. By carrying out only about 30% of profitable transactions in this way, you are guaranteed to remain in profit.
Using the indicator for binary options
RVI is an original yet accurate tool that is popular among traders today. It is easy to use, intuitive and perfect for trading binary options and the Forex market. By opening and closing trades at price peaks, he will allow you to receive maximum income from the full trend. Following the trend gives a significant advantage to RVI - it is easy to determine the market trend, following a rule that is understandable even to beginners:
- If the curves are rising, there is an upward trend in the market, it is worth buying CALL options,
- If the curves are falling, there is a downward trend in the market, it is worth buying PUT options.
By entering a trade at the minimum and exiting it at the market maximum, the indicator captures more effective price dynamics, being not only a valuable, but also a very profitable trading tool. It also shows high-quality line crossing signals, guaranteeing a good income. Still, in order to reduce false signals, it is worth combining the tool with other indicators (for example, a moving average).
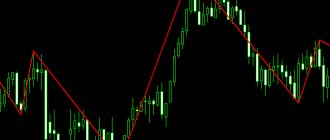
Like all oscillators, RVI, while working perfectly within the price channel, produces many erroneous signals during a flat, and with a strong unidirectional movement it can lose sensitivity.
Rules for concluding transactions (screenshots)
Trading with a trend signal
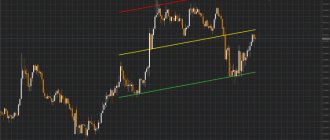
If both RVI curves are rising, this indicates an uptrend, it is recommended to buy CALL options . In the image you can see the uptrend in the MT4 terminal:
Take advantage of the trend and place a CALL bet with the Olymp Trade broker by going to olymptrade.com and preparing an option by specifying:
- Option type
- Expiration date
- Amount
- Forecast: up
- Next, click the “buy” button and wait for the forecast results:
If the RVI curves are declining, we are facing a downward trend, it is recommended to buy PUT options . In the image you can see the downtrend in the MT4 terminal:
Take advantage of the trend and place a PUT bet with the Olymp Trade broker by going to olymptrade.com and preparing an option by specifying:
- Option type
- Expiration date
- Amount
- Forecast: down
- Next, click the “buy” button and wait for the forecast results:
Trading when the RVI lines cross the signal
If the fast line (green) has crossed the slow line (red) from bottom to top, this indicates that there is currently an upward trend on the stock exchange, and it is worth buying CALL options . In the image you can see the upward trend in the MT4 terminal (taking advantage of the trend, place a CALL bet on the website olymptrade.com, instructions are given above):
If the fast line (green) has crossed the slow line (red) from top to bottom, this indicates that a downward trend has formed on the exchange at the moment; it is worth buying PUT options . In the image you can see the downward trend in the MT4 terminal (taking advantage of the trend, place a PUT bet on the website olymptrade.com, instructions are given above):
Relative vigor index: results
The Relative Vigor Index is an indicator based on the assumption that the closing price of a period, say at the end of the day, is a key characteristic tied to the strength of the market movement. When market momentum is bullish, we tend to see higher closing prices. In a bear market, we tend to see lower closing prices. Using this simple principle, the RVI indicator provides clear signals on when to trade using a signal line.
RVI index - calculation method
We calculate the RVI indicator in several steps. The main step is to calculate the underlying RVI value using the following equation: RVI = (Close Price - Open Price) / (High Price - Low Price). The formula considers the difference between the closing price and the opening price, normalized by the maximum range of price changes.
We then smooth our RVI values over N periods using a simple moving average (SMA). This is our main RVI oscillator line; it appears in MetaTrader as a green line, as we will see in the next section.
Many versions of the RVI indicator actually perform double smoothing. A symmetrically weighted finite impulse response (FIR) filter is first applied and then averaged over N periods. Basically, the purpose of the filter is to make the phase cycle of the oscillator better match the phase cycle of the price chart. The key principle of the methodology is that RVI remains the ratio of (close-open) to (high price - low price).
The next step is to create a signal line. We do this by applying the same FIR filter to the RVI values—a symmetrically weighted moving average of the RVI over 4 periods. MetaTrader 4 displays the red signal line on the same chart as the main RVI line.
The calculation method for the Relative Vigor indicator is actually very similar to that used for the Stochastic Oscillator, another very popular indicator. The stochastic oscillator uses price compared to the low price of the day. RVI, on the contrary, uses the price compared to the high of the day.
The previous calculations may seem complicated, but don't worry. It is useful to understand the basic principles behind how the indicator works, but MetaTrader 4 will do all the calculations. So, let's take a look at using the Relative Vigor Index in MT4.
Money management
Money management has always been considered a basic concept in trading, which, if properly structured, can quickly and easily increase the efficiency of work in the market. If a trader is thinking about making a stable profit, this is easier to achieve by turning to the rules of money management, which will accurately adjust the management of deposit funds.
Minimum capital : when starting to work in binary options, bet the minimum amount of funds per transaction; the cost of the transaction should not be more than 5% of the deposit; purchase inexpensive options, and your transactions will not affect the status of the deposit. By implementing these money management rules in your trading, you will greatly save your capital.
Minimum deposit : when starting to work in binary options, participate in transactions that will allow you to spend your deposit economically; When buying a specific asset, do not transfer all your capital to it; maintain a positive account balance for as long as possible, considering that your capital will still be useful to you. By implementing these money management rules in your trading, you will be able to save your deposit for a long time.
Minimum options : when starting to work in binary options, buy a minimum of options, for example, 2-3 assets; This rule applies more to beginners in trading, who, having become more confident and experienced, will be able to increase the number of assets. By implementing these money management rules in your trading, you will be able to work most productively from the very first step in options.
Minimum of emotions : when starting work in binary options, always use only a serious working mood, because in the market you must use analytics and make informed decisions on which your productivity depends; It is worth remembering that in options it is not enough to rely only on experience; it is your attitude that makes your work effective. By implementing these money management rules in your trading, you can easily turn options trading into a profession with your main income.
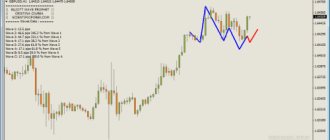
Using RVI Divergence
A state of divergence occurs when:
- a decrease in successive maximums of the indicator and an increase in the corresponding price maximums (Fig. 4);
- increasing successive minimums of the indicator and lowering the corresponding price minimums.
The occurrence of divergence indicates a high probability of continuation of the current price movement (in the first case, upward, in the second, downward).
The RVI indicator can be found in any on-line trading platform. Surely, you have come across its name personally, but, like most other traders, you did not pay attention to it. But in vain! This indicator has enormous potential and will be an excellent addition to any trading strategy. The description of RVI and the strategy for its use is the topic of our new article.