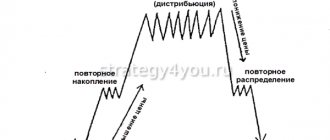
When the price of an asset closes above the previous close, the entire day's volume is considered elevated. When a trading asset closes below the previous close, all volume for the day is considered down. Thus, OBV increases or decreases during each day depending on whether the price closed higher or lower compared to the previous day's close.
Indicator characteristics
Platform : Metatrader and terminals containing the indicator Currency pairs : any instruments, preferably major pairs and cross rates Timeframe : any, preferably D1 Trading time : around the clock Recommended brokers : Alpari, Forex4You, TickMill
Joseph Granville proposed taking into account the volume on the available trading history, thereby creating a complete picture of the market. The role of price in the OBV formula was reduced to determining the sign in front of the trading turnover figure. A negative close on the day would set trading volume as a negative number, while a rising daily candlestick would keep it positive.
The indicator was widely used in the stock market and passed down to Forex, partly thanks to Jack Schwager, who mentioned Joe Granville in the Stock Wizards book series. This gave OBV a “second wind” in the 90s - the indicator was included in the package of standard technical analysis tools of the Metatrader 4 platform.
The popularity of the platform spread On Balance Volume to the trading terminals created after it. The indicator is currently used to predict reversals or confirm trends in advance.
OBV System strategy for binary options
This system, designed for intraday trading on the Forex market, was developed by Western traders. OBV System for binary options is based on the use of a set of indicators: OBV, CCI, MFI, as well as Bollinger Bands. The strategy is universal and suitable for all currency pairs. Recommended time frames are 30 minutes and 1 hour.
The strategy has fixed parameters that cannot be changed. But each trader on its basis has the opportunity to create his own mechanical trading system. The user must learn to correctly interpret the signals of the OBV strategy. You can download the system on trading resources.
To purchase a CALL option, the following conditions must be met simultaneously:
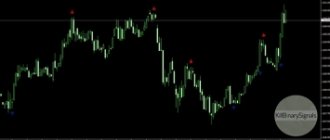
- The appearance of a green arrow pointing upward and a cross on the chart. Most often they occur when the price reaches the lower border of the Bollinger Channel or moving average.
- All 3 indicators should leave the oversold zone. They go upstairs, crossing each other.
- A green circle should appear in the lower indicator field (Buy Sell).
- The price bounces up from the Bollinger band or average.
To buy a Put option, the following conditions must be met:
- The appearance of a yellow downward arrow and a cross on the price chart.
- All 3 indicators are in the overbought zone. They intersect and rush down.
- The “red light” lights up in the lower field.
- The price bounces off the Bollinger line or the average downwards.
The expiration period for options when working with the OBV System is 30 and 60 minutes.
There are many options for such systems. They will work best in a sideways market when there is no dominant trend. When there are strong price movements and high volatility, it is better not to use countertrend strategies.
Description of the indicator operation
Joseph Granville described the results of daily trading in the form of an endless numerical series of positive numbers for a candle that closed above the opening, and negative numbers if at the end of the day the price was below the opening level of the session. Further, the author constantly summarized the results obtained:
OBV= ∑ k*Volume,
where the coefficient k determined the +/- sign based on the position of the closing price of the candle.
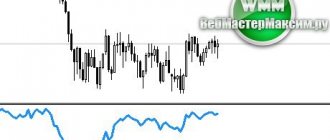
As can be seen from the formula, the indicator curve can take positive and negative values during prolonged trends, indicating the global market trend at the current moment. OBV has no period, using "end-to-end" summation showing the cumulative value of the volume.
The figure above demonstrates the high level of correlation between indicator trends and asset quotes - this is another useful factor that simplifies technical analysis.
A typical volume histogram can rise when the price falls or rises, making it difficult to find divergence signals when the trend is not confirmed by trading activity. Correlating OBV with a chart instantly displays a picture of the market, visually confirming or refuting both types of price trends.
This quality becomes especially important in the most difficult areas of trading - flat, where uncertainty brings the trader the greatest number of losses. Volume analysis allows you to determine hidden movement and correctly predict the trend.
The OBV formula does not take into account daily trading volumes on cross candlesticks, whose price closes at the opening level of the session.
Balance volume indicator and level breakout strategy
A break or breakdown of a level means a move below any support or above any resistance. By observing changes in volume, you can easily predict when the next breakdown will occur and enter into a rebound. In other words, you enter the market with momentum behind you. Under the influence of volume, the trend will be long-lasting, so quotes will continue to change in the direction you need. As a result, you will earn more than other traders because you will be among the first to enter the market. Does this strategy have any disadvantages? Yes, sometimes the volume indicator detects false breakouts and in this case you risk buying an asset at the peak of its value, which will lead to loss of funds. Let's consider in what cases you should not resort to this strategy:
- do not trade breakouts when the market is far from support/resistance (S/R);
- do not trade breakouts without TIGHT TRADING RANGE (consolidation) before the breakout;
- do not trade a breakout when the breakout is set up against dominant pressure.
If the market is far from support or resistance, you do not have a logical level to place a stop loss. Even if you do this, the possible profit on the transaction will be minimal.
Using the indicator in trading
OBV divergences are one of the most widely noted signals by analysts. Thematic resources and encyclopedias describe the classic use of divergences between price trends and indicators. This means that a growing or decreasing trend in quotes that is not confirmed by the highs or lows of On Balance Volume is interpreted as an upcoming price correction.
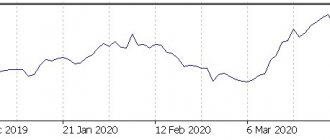
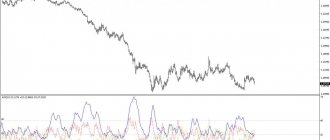
In the Forex market, this strategy works the other way around. OBV divergences are the first extremes of divergence to confirm the current trend. The picture shows how the market decline occurs while demand for OBV continues to be high. High volumes should show that traders are ready to continue buying, but soon the downtrend ends with a big drop.
Next you can see how volumes continue to fall, but the currency pair turned around and continues to set new highs. Despite the “absence” of buyers according to OBV data, EURUSD quotes are showing strong momentum.
History repeats itself at a new market top: high On Balance Volume indicators during a falling trend lead to a sharp drop in the rate. This proves that all OBV divergences confirm the high probability of the existing price trend.
On Balance Volume clearly demonstrates the classic “crowd fallacy”. If most traders play the role of bulls, then large players are ready to bring down the market in order to make money on stop losses.
The classic strategy for using the indicator is to trade on trend confirmation. As noted above, the OBV formula “links” the curve to the exchange rate of the currency pair. Traders make trades:
- BUY at the breakdown of the indicator maximum if the rate continues to rise;
- SELL on the breakdown of the minimum if quotes continue to fall.
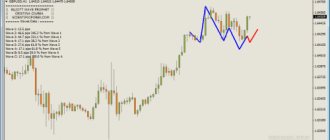
Countertrend signals on the trading indicator provide support and resistance lines, determined according to principles similar to graphical price analysis:
- A BUY trade is opened after a double bottom appears, if OBV showed a decline before that;
- A SELL trade is opened after the second top, which formed at the end of a growing trend.
Money management strategy is based on stop losses placed behind the lows or highs of the daily candle, not exceeding 100 points, but not less than 50 points for major currency pairs. Profit is recorded:
- For a short trade with a correction exceeding the penultimate maximum of the downward trend OBV;
- For a long trade when it breaks out on the correction of the previous low of the growing trend of the indicator.
On balance volume indicator. Afterword
Many financial resources write that this indicator needs to be filtered or supplemented with other indicators. However, this is yet another nonsense from the category of “I write for the sake of it.” The OBV indicator is a ready-made analysis system that you need to be able to use correctly. Exactly what methods I described above. It is important to understand one thing: in its bare form, this analyzer does not generate signals, but you can replace the analysis of the price chart with an analysis of the balance volume and most likely increase your own efficiency. Because your decisions will be accompanied in one way or another by an analysis of market volumes.
Description of settings
The On Balance Volume indicator is located in the “Volumes” section, “Indicators” option, “Insert” menu of the Metatrader 4 and 5 trading platform.
The indicator settings window contains practically no parameters that can influence the calculations, except for changing the reference points in the form of choosing prices: closing, opening, maximum or minimum. In the classic version, Joe Granville recalculated the indicator for each close of the daily candle.
The “Levels” tab plays a technical role; a trader can mark the historical highs and lows of the On Balance Volume readings in order to take them into account when they break through a level or correct a trend.
Strategy for maintaining the trend
Trading with the trend has always been considered the safest and most stable way to make money on Forex. But the problem is that it is extremely difficult to determine the duration of the influence of “bears” or “bulls” on the market. Even if you use a volume indicator, you will have to connect several additional tools:
- Admiral Pivot is set to D1;
- Bollinger Bands® (50.2);
- OBV with EMA 20 applied.
With their help, you can track trend resistance levels. If data on the volume indicator confidently breaks through the resistance line, then the trend situation will remain the same as it was.