Capital owners are constantly looking for new interesting areas for investment. Recently, their attention has increasingly been drawn to the investment assets of the most developed countries of the world. The United States of America stands apart from this list of countries. It is investments in the United States that are very popular among Russian investors.
There are two aspects that help explain this trend. Firstly, many investment assets from the United States promise their owner a serious level of profitability. Secondly, America has a rather interesting government immigration program, EB-5. It provides a person investing in the US economy with significant benefits in obtaining American citizenship.
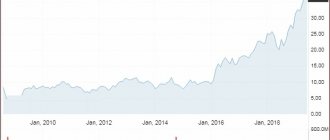
US private investment, 1970-2019
During 1970-2019 US private investment at current prices increased by $4,274.2 billion (19.6 times) to $4,504.0 billion; the change occurred by $131.2 billion due to a population increase of 119.6 million, as well as by $4,143.0 billion due to an increase in private investment per capita by $12,590.4. The average annual increase in US private investment is $87.2 billion, or 6.3%. The average annual increase in US private investment in constant prices was 3.3%. The world share decreased by 4.8%. The share in America decreased by 2.0%. The minimum private investment was in 1970 ($229.8 billion). The maximum private investment was in 2019 ($4,504.0 billion).
During 1970-2019. private investment per capita in the United States increased by $12,590.4 (12.5 times) to $13,687.4. The average annual increase in private investment per capita at current prices was $256.9 or 5.3%.
The change in US private investment is described by a linear correlation-regression model: y=83.9x-165 422.4, where y is the estimated value of US private investment, x is the year. Correlation coefficient = 0.981. Coefficient of determination = 0.961.
US Private Investment, 1970
US private investment in 1970 amounted to $229.8 billion, ranking 1st in the world. The share of US private investment in the world was 24.4%.
Private investment per capita in the USA in 1970 was equal to $1,097.1, ranked 10th in the world and was at the level of private investment per capita in Andorra ($1,162.2), private investment per capita in Qatar ($1,138.8) , private investment per capita in Australia ($1,134.3), private investment per capita in Norway ($1,087.9), private investment per capita in San Marino ($1,085.2). Private investment per capita in the US was greater than private investment per capita in the world ($254.8) by $842.3.
Comparison of private investment between the United States and its neighbors in 1970. US private investment was greater than Canadian private investment ($19.5 billion) by 11.8 times, Mexican private investment ($11.3 billion) by 20.4 times, Cuban private investment ($1.5 billion) by 155.7 times, private investments in the Bahamas ($0.2 billion) 1,458.3 times. Private investment per capita in the United States was greater than private investment per capita in the Bahamas ($930.6) by 17.9%, private investment per capita in Canada ($913.0) by 20.2%, and private investment per capita in Mexico ($219.1). dollars) by 5.0 times, private investment per capita in Cuba ($169.3) by 6.5 times.
Comparison of US private investment and leaders in 1970. US private investment was greater than private investment in the USSR ($154.6 billion) by 48.7%, private investment in Japan ($87.4 billion) by 2.6 times, private investment in Germany ($70.6 billion) by 3.3 times, private French investments ($41.9 billion) 5.5 times. Private investment per capita in the US was greater than private investment per capita in Germany ($898.4) by 22.1%, private investment per capita in Japan ($832.6) by 31.8%, private investment per capita in France ($805.5). dollars) by 36.2%, private investment per capita in the USSR (638.2 dollars) by 71.9%.
US Private Investment, 2019
US private investment in 2021 amounted to $4,504.0 billion, ranking 2nd in the world. The share of US private investment in the world was 19.6%.
Private investment per capita in the United States in 2019 amounted to $13,687.4, ranked 12th in the world and was at the level of private investment per capita in Iceland ($14,360.6), private investment per capita in Denmark ($13,775.2), private investment per capita in the Cayman Islands ($13,587.4), private investment per capita in Sweden ($13,348.2). Private investment per capita in the US was greater than private investment per capita in the world ($2,978.4) by $10,709.1.
Comparison of private investment between the United States and its neighbors in 2021. US private investment was greater than Canadian private investment ($400.3 billion) by 11.3 times, Mexican private investment ($268.6 billion) by 16.8 times, Cuban private investment ($11.2 billion) by 401.9 times, private investments in the Bahamas ($3.5 billion) 1,272.4 times. Private investment per capita in the US was greater than private investment per capita in Canada ($10,701.1) by 27.9%, private investment per capita in the Bahamas ($9,088.6) by 50.6%, private investment per capita in Mexico ($2,105.5) by 6.5 times, private investment per capita in Cuba ($988.8) by 13.8 times.
Comparison of US private investment and leaders in 2021.
US private investment was greater than Japanese private investment ($1,247.7 billion) by 3.6 times, Indian private investment ($882.2 billion) by 5.1 times, German private investment ($825.8 billion) by 5.5 times, but were less than China's private investment ($6,204.5 billion) by 27.4%. Private investment per capita in the US was greater than private investment per capita in Germany ($9,888.5) by 38.4%, private investment per capita in Japan ($9,835.3) by 39.2%, private investment per capita in China ($4,327.5) by 3.2 times, private investment per capita in India ($645.6) by 21.2 times. US private investment, 1970-2019
| year | private investment, billion dollars | private investment per capita, dollars | private investment, billion dollars | growth of private investment, % | share of private investment in GDP, % | US share, % | ||
| current prices | constant prices 1970 | in the world | in America | in North America | ||||
| 1970 | 229.8 | 1 097.1 | 229.8 | 21.4 | 24.4 | 78.1 | 92.1 | |
| 1971 | 255.3 | 1 208.0 | 242.4 | 5.4 | 21.9 | 24.9 | 77.9 | 91.7 |
| 1972 | 288.8 | 1 354.4 | 261.3 | 7.8 | 22.6 | 24.6 | 78.1 | 91.6 |
| 1973 | 332.6 | 1 545.5 | 284.8 | 9.0 | 23.3 | 22.3 | 77.0 | 91.2 |
| 1974 | 350.7 | 1 615.2 | 271.1 | -4.8 | 22.7 | 20.8 | 72.4 | 89.4 |
| 1975 | 341.7 | 1 559.5 | 237.4 | -12.4 | 20.3 | 19.2 | 69.0 | 88.7 |
| 1976 | 412.9 | 1 867.5 | 272.9 | 15.0 | 22.0 | 20.5 | 70.9 | 88.8 |
| 1977 | 489.8 | 2 195.0 | 303.0 | 11.0 | 23.5 | 21.4 | 72.6 | 90.4 |
| 1978 | 583.9 | 2 592.7 | 335.4 | 10.7 | 24.8 | 21.4 | 74.0 | 91.9 |
| 1979 | 659.8 | 2 902.1 | 348.3 | 3.9 | 25.1 | 21.2 | 73.4 | 91.5 |
| 1980 | 666.0 | 2 902.4 | 321.5 | -7.7 | 23.3 | 19.4 | 70.0 | 91.0 |
| 1981 | 778.6 | 3 361.1 | 343.2 | 6.8 | 24.3 | 22.6 | 70.4 | 90.9 |
| 1982 | 738.0 | 3 156.2 | 308.3 | -10.2 | 22.1 | 22.5 | 73.1 | 92.1 |
| 1983 | 808.7 | 3 426.1 | 335.0 | 8.7 | 22.3 | 24.5 | 78.6 | 92.1 |
| 1984 | 1 013.3 | 4 252.7 | 414.6 | 23.7 | 25.1 | 29.2 | 81.4 | 93.1 |
| 1985 | 1 049.5 | 4 364.1 | 424.6 | 2.4 | 24.2 | 30.3 | 81.1 | 93.0 |
| 1986 | 1 087.2 | 4 478.7 | 432.2 | 1.8 | 23.7 | 27.6 | 81.9 | 92.9 |
| 1987 | 1 146.8 | 4 679.9 | 447.4 | 3.5 | 23.6 | 25.7 | 80.4 | 92.2 |
| 1988 | 1 195.4 | 4 832.2 | 454.9 | 1.7 | 22.8 | 23.2 | 78.0 | 90.9 |
| 1989 | 1 270.1 | 5 086.1 | 471.4 | 3.6 | 22.5 | 23.7 | 77.4 | 90.4 |
| 1990 | 1 283.8 | 5 092.1 | 466.6 | -1.0 | 21.5 | 21.8 | 77.7 | 91.0 |
| 1991 | 1 238.4 | 4 865.4 | 442.0 | -5.3 | 20.1 | 20.5 | 77.0 | 91.2 |
| 1992 | 1 309.1 | 5 094.1 | 466.4 | 5.5 | 20.1 | 20.7 | 77.0 | 92.3 |
| 1993 | 1 398.7 | 5 389.4 | 491.5 | 5.4 | 20.4 | 22.2 | 76.3 | 92.9 |
| 1994 | 1 550.7 | 5 913.0 | 535.9 | 9.0 | 21.3 | 22.9 | 75.2 | 93.2 |
| 1995 | 1 625.2 | 6 128.9 | 551.2 | 2.9 | 21.3 | 21.4 | 75.8 | 93.2 |
| 1996 | 1 752.0 | 6 529.2 | 593.1 | 7.6 | 21.7 | 22.7 | 76.4 | 93.6 |
| 1997 | 1 922.2 | 7 074.3 | 649.3 | 9.5 | 22.4 | 25.1 | 75.5 | 93.2 |
| 1998 | 2 080.7 | 7 561.3 | 705.5 | 8.7 | 23.0 | 27.7 | 76.9 | 93.9 |
| 1999 | 2 255.5 | 8 097.4 | 761.6 | 8.0 | 23.4 | 29.0 | 80.1 | 94.1 |
| 2000 | 2 427.3 | 8 616.1 | 808.1 | 6.1 | 23.7 | 29.9 | 79.6 | 94.0 |
| 2001 | 2 346.7 | 8 245.4 | 775.8 | -4.0 | 22.2 | 29.9 | 79.9 | 94.1 |
| 2002 | 2 374.1 | 8 264.1 | 779.5 | 0.47 | 21.7 | 29.9 | 81.6 | 94.0 |
| 2003 | 2 491.3 | 8 596.0 | 811.7 | 4.1 | 21.7 | 27.7 | 81.4 | 93.1 |
| 2004 | 2 767.5 | 9 466.1 | 875.2 | 7.8 | 22.7 | 26.5 | 80.1 | 92.6 |
| 2005 | 3 048.0 | 10 332.5 | 924.3 | 5.6 | 23.4 | 26.4 | 78.5 | 92.0 |
| 2006 | 3 251.8 | 10 921.0 | 952.6 | 3.1 | 23.5 | 25.4 | 76.4 | 91.2 |
| 2007 | 3 265.0 | 10 861.3 | 937.1 | -1.6 | 22.6 | 22.2 | 72.9 | 90.2 |
| 2008 | 3 107.2 | 10 238.3 | 878.9 | -6.2 | 21.1 | 19.2 | 68.5 | 89.2 |
| 2009 | 2 572.6 | 8 398.6 | 733.0 | -16.6 | 17.8 | 18.2 | 68.6 | 89.4 |
| 2010 | 2 810.0 | 9 093.4 | 809.7 | 10.5 | 18.7 | 17.2 | 64.7 | 88.0 |
| 2011 | 2 969.2 | 9 529.2 | 843.9 | 4.2 | 19.1 | 16.0 | 62.6 | 87.2 |
| 2012 | 3 242.8 | 10 326.0 | 908.5 | 7.7 | 20.0 | 17.0 | 64.1 | 87.7 |
| 2013 | 3 426.4 | 10 829.3 | 950.9 | 4.7 | 20.4 | 17.4 | 64.9 | 88.1 |
| 2014 | 3 646.7 | 11 443.6 | 992.7 | 4.4 | 20.8 | 17.9 | 67.0 | 89.0 |
| 2015 | 3 859.8 | 12 028.8 | 1 042.8 | 5.0 | 21.2 | 20.0 | 71.3 | 91.2 |
| 2016 | 3 826.8 | 11 846.9 | 1 033.2 | -0.92 | 20.4 | 19.9 | 74.7 | 91.6 |
| 2017 | 4 015.5 | 12 352.1 | 1 067.5 | 3.3 | 20.5 | 19.2 | 74.3 | 91.1 |
| 2018 | 4 336.8 | 13 258.4 | 1 129.0 | 5.8 | 21.0 | 19.2 | 74.8 | 91.5 |
| 2019 | 4 504.0 | 13 687.4 | 1 153.1 | 2.1 | 21.0 | 19.6 | 76.2 | 91.8 |
Big Four
Among the listed institutional investors (10-12), 4 stand out in particular:
- Vanguard Group, Inc.
- Black Rock
- Fidelity Investments (FMR LLC)
- State Street
These giant investment funds and financial holding companies (the "Big Four") are present in the share capitals of many strategically important companies and banks.
Thus, in Bank of America, the participation shares of the “Big Four” at the end of 2014 were as follows (%):
- Vanguard Group, Inc. – 5.13%
- State Street – 4.55%
- Fidelity – 3.67%
- Black Rock – 2.63%
At JP Morgan (%):
- Vanguard Group, Inc. – 5.46%
- State Street – 4.61%
- Fidelity – 2.85%
- Black Rock – 2.64%
The picture is approximately the same in the banks City Group, Wells Fargo, Goldman Sachs, Morgan Stanley. The presence of the "four" in the capital of Wall Street banks is actually higher if you count the subsidiaries and granddaughters of these institutional investors and take into account the cross-holding of Wall Street banks in the capital. Significant dispersion of share capital among small shareholders ensures effective control with a total share in capital of 15-25%.
In my book, Financial Capital of the 21st Century: The Top of the Global Pyramid, I wrote that Wall Street banks are controlled by these four institutional investors. They are what I call the owners of money - the main shareholders of the US Federal Reserve System.
If much is known about Wall Street banks, they are visible, but the Big Four financial holdings are in the shadows. Apparently, they prefer peaceful coexistence on the basis of some kind of agreement like a cartel agreement. Mutual friction is weakened due to active expansion in different markets and in different industries. The American IT industry has been a strategic direction of expansion for the Big Four since the end of the 20th century. The IT industry is needed by those who stand behind the Big Four and seek to assert their power over the world.
The Big Four giants are usually ranked based on the size of assets under management by the investment fund; these assets are measured in trillions of dollars. The funds' own (balance sheet) assets are several times, tens of times less than those transferred by clients to the funds for management.
Comparison of private investment in the United States and neighboring countries
Private investment in the US and neighboring countries, the order of relation to the US indicator
| A country | 1970 | 1980 | 1990 | 2000 | 2010 | 2019 |
| USA | 0.0 | 0.0 | 0.0 | 0.0 | 0.0 | 0.0 |
| Canada | -1.1 | -1.0 | -1.0 | -1.2 | -0.87 | -1.1 |
| Mexico | -1.3 | -0.96 | -1.3 | -1.2 | -1.1 | -1.2 |
| Cuba | -2.2 | -2.1 | -2.3 | -2.8 | -2.6 | -2.6 |
| Bahamas | -3.2 | -3.2 | -3.0 | -3.0 | -3.0 | -3.1 |
Private investment per capita in the US and neighboring countries, relative to the US indicator
| A country | 1970 | 1980 | 1990 | 2000 | 2010 | 2019 |
| USA | 1.0 | 1.0 | 1.0 | 1.0 | 1.0 | 1.0 |
| Canada | 0.83 | 0.92 | 0.91 | 0.58 | 1.2 | 0.78 |
| Bahamas | 0.85 | 0.76 | 0.88 | 0.95 | 0.88 | 0.66 |
| Mexico | 0.20 | 0.37 | 0.17 | 0.19 | 0.23 | 0.15 |
| Cuba | 0.15 | 0.18 | 0.13 | 0.040 | 0.063 | 0.072 |
What are the benefits of an EB visa?
- The right to permanent residence of the program participant and his family (up to 10 people).
- The benefits of issued documents apply to all family members.
- Obtaining a Green Card “without conditions” for permanent residence after two years. Until this time, the card “with conditions” is valid, although the privileges of both cards are the same.
- Obtaining citizenship after a five-year stay in America.
- Coverage under US social, financial, educational and insurance programs.
- The ability to move freely throughout America. The Green Card holder has the right to enter and leave the country at any time.
As a result of this program, the investor and his family receive almost all the rights of an American citizen.
Comparison of private investment in the United States and leading countries
Private investment in the US and leading countries, the order of relation to the US indicator
| A country | 1970 | 1980 | 1990 | 2000 | 2010 | 2019 |
| China | -0.87 | -0.79 | -0.97 | -0.76 | 0.014 | 0.14 |
| USA | 0.0 | 0.0 | 0.0 | 0.0 | 0.0 | 0.0 |
| Japan | -0.42 | -0.25 | -0.075 | -0.26 | -0.36 | -0.56 |
| India | -1.4 | -1.2 | -1.1 | -1.3 | -0.63 | -0.71 |
| Germany | -0.51 | -0.41 | -0.47 | -0.71 | -0.62 | -0.74 |
Private investment per capita in the USA and in leading countries, relation to the US indicator
| A country | 1970 | 1980 | 1990 | 2000 | 2010 | 2019 |
| USA | 1.0 | 1.0 | 1.0 | 1.0 | 1.0 | 1.0 |
| Germany | 0.82 | 1.1 | 1.1 | 0.68 | 0.93 | 0.72 |
| Japan | 0.76 | 1.1 | 1.7 | 1.2 | 1.0 | 0.72 |
| China | 0.034 | 0.037 | 0.023 | 0.038 | 0.23 | 0.32 |
| India | 0.017 | 0.019 | 0.021 | 0.014 | 0.059 | 0.047 |
© Ivan Kushnir
frequently asked questions and answers
How do American crowdinvesting sites work?
The main task of such a site is to find profitable development projects and real estate that can be resold or rented out. An investor who wants to participate in a crowdinvesting project can buy a share in the company implementing it. This company is created by the platform itself, but is not legally dependent on it. That is, in the event of bankruptcy or unprofitability of the project at the time of its implementation (construction of a building or resale of an object), the site itself does not suffer - it receives income in the form of an intermediary interest.
However, the site can become a share of a particular project, as well as attract a major national player to it, who will become the owner of a significant share. Private investors will only have to buy the remainder. This kind of work scheme contributes to greater confidence on the part of investors. When purchasing a share in a project, they see that most of the shares have already been bought by a major player whose reputation they do not question, so they are ready to take risks.
Pembina Pipeline (PBA) – 7.92%
The largest Canadian oil and gas carrier, which has made the aggressive takeover of competitors its main strategy. Because of this, the company has a fairly high debt burden, which, however, is completely offset by income from acquisitions.
The company pays dividends monthly - around 14-16 cents. Over the course of a year, a tidy sum of 1.68-1.92 dollars accrues. At the company's current price of $24.27, the yield could reach 7.92%.
Be careful when purchasing Pembina Pipeline. Its ticker symbol on the Toronto Stock Exchange is PPL, and on the New York Stock Exchange it is PBA. A completely different company is traded under the ticker PPL on the New York Stock Exchange.
European exchange-traded funds
Investors who want to gain access to attractive European markets can do so by investing in European exchange-traded funds.
The attractiveness of European exchange-traded funds is determined by the following factors:
- recognition of European companies in which funds are invested;
- the opportunity to diversify investments;
- low level of investment risk.
It is these factors that make this category of funds attractive to a wide range of investors.
Telefonica (TEF) – 9.61%
The largest telecommunications company in the world by number of clients, headquartered in Spain. Strictly speaking, this is a Spanish, not an American company: its ADRs are traded on the New York Stock Exchange.
The company is doing ambiguously, its net profit is fluctuating. This is reflected in the dividends: they are paid irregularly (2 to 3 times a year) and vary greatly in size. Telefonica's high dividend yield is due to a constant decline in quotes - be prepared for this if you decide to buy its shares.
If the company pays $0.2 twice in 2021 (the most pessimistic forecast, given the difficult 2020), then with a share price of $4.07, the dividend yield will be 9.61% - still quite a lot.
AT&T (T) – 7.34%
The largest telecommunications company in the United States, owner of television studios such as HBO, Turner and Warner Bros (and such super-popular series as Friends and Game of Thrones). At the same time, oddly enough, most of AT&T’s profits are generated by government orders: the company develops various solutions and provides communications for the defense industry, the FBI and other US law enforcement agencies, as well as NASA. Another plus for AT&T is that it is about to deploy 5G towers, which will give it leadership in this area.
AT&T pays dividends quarterly, diligently increasing them by 1 cent each year. The dividend is currently 52 cents per share, which gives a dividend yield of 7.34% at a share price of $28.32. This makes AT&T one of the best-yielding dividend stocks in the US.
Big Four structure
All 4 funds have very extensive structures, consisting of branches, affiliates, subsidiaries and grandchild companies, scattered across dozens of countries. Thus, Black Rock has 22 investment centers, 70 offices in 30 countries and clients in 100 countries. Black Rock has eleven subsidiaries. At the same time, two subsidiaries have assets under management exceeding $1 trillion:
- BlackRock Institutional Trust Company, NA ($1.85 trillion)
- BlackRock Fund Advisors ($1.10 trillion).
Black Rock has approximately 10 million individual clients and 5,000 institutional clients.
Vanguard Group is also organized as a financial holding company, with approximately 30 investment funds and companies under its parent company. Here are the largest:
- Vanguard Total Stock Market Index Fund
- Vanguard 500 Index Fund Investor Share
- Vanguard Total International Stock Index Fund
- Vanguard Total Bond Market Index Fund
There are subsidiaries in other countries:
- Vanguard Investments UK, Limited (UK)
- Vanguard Investments Australia Limited (Australia)
- Vanguard Investments Canada Inc. (Canada)
- Vanguard Investments Switzerland GmbH (Switzerland).
State Street and Fidelity are structured in much the same way. State Street has about fifty subsidiaries, and more than half operate outside the United States - in the UK, Ireland, Canada, Australia, continental Europe, Japan, Hong Kong, and Singapore. Fidelity manages 484 mutual funds: stock funds – 369; bond funds – 58; High Income Funds – 23; money market funds - 34. Fidelity has more than 20 million individual clients and 3,500 institutional clients. The largest client is Affiliated & External Mutual Fund (Sub-Advised Funds), whose assets are estimated at one and a half trillion dollars.
Disclaimer
Everything written below does not constitute an individual investment recommendation; the information is for informational purposes only. Before buying a stock, carefully study the company's business and rely solely on your own opinion about the company's prospects.
The dividend yield indicated in the article is an estimate, taking into account previously paid dividends. It is not guaranteed, especially in difficult market conditions.
Share quotes are current as of November 21, 2020 (indicated at closing price).
Key criteria when selecting shares:
- positive earnings per share (EPS above 0);
- EBITDA and FCF above zero;
- dividend payment period – from 5 years;
- company capitalization – from $2 billion;
- net profitability (ratio of revenue to profit) – above 0%;
- Net Debt/EBITDA ratio is below 5.
In a word, I tried to ensure that the list did not include obvious zombie companies, unprofitable and hopeless, as well as those burdened by debt obligations and paying dividends on credit. But still double-check - you never know =)
ETFs and REITs were also excluded from the list. REITs generally provide higher dividend yields than the average US stock, and if I included them they would rank all over the top.
Most shares are available for purchase on the St. Petersburg Stock Exchange (checked selectively, something may be missing).
In general, let's go! Here are the TOP US stocks with the highest dividends in 2021.
The Williams Companies (WMB) – 7.87%
One of the largest fuel companies in the United States with registration in Oklahoma. Finds and produces oil and natural gas, produces gasoline, kerosene, diesel and electricity from them, and also sells automobile fuel through its network of gas stations.
Pays dividends quarterly and increases them regularly. The latest payment is 40 cents per share. At the current share price of $20.34, the stock has a dividend yield of 7.87%, making The Williams Companies a typical high dividend US stock.
Oneok (OKE) – 11.35%
A large gas corporation engaged in the production, processing and transportation of natural gas (like our Gazprom). Most other U.S. gas companies are focused on the domestic market, but Oneok is focused primarily on exports.
The decline in the gas giant's quotes is due to extremely low gas prices and a general decline in demand for energy. Currently, one share of the company costs $32.96. Dividends are quarterly, $0.94 per share. The possible dividend yield in 2021, respectively, is 11.35%.
If gas prices recover, Oneok's earnings will skyrocket, as will its stock price. There's a good chance you can snag this top dividend-yielding US stock at low prices.
Owners
The most interesting (and most vague!) question is about the owners: who owns the investment funds? Usually the focus is on the leaders of the Big Four, who are also shareholders of the companies they manage. For example, the chairman of the board and president of Black Rock is Laurence D. Fink, one of the founders of the holding. Its share in the share capital is 0.7%.
Owners Black Rock
An open-end fund issues shares. We need to look at who appoints the managers. Here is the ownership data for Black Rock as of August 7, 2021 (share in total share capital,%):
- PNC Bank – 22.04;
- The Vanguard Group, Inc. – 5.62;
- BlackRock Fund Advisors – 3.97;
- Capital Research and Management Company, Inc. – 3.95;
- SSgA Funds Management, Inc. – 3.23;
- Wellington Management Co. LLP – 3.08.
Other shareholders have shares of 2% or less. The largest institutional shareholder, PNC Bank, is one of the top ten US banks; assets at the end of 2021 - about $300 billion. When we start to look at who owns PNC Bank, it turns out that among the five largest institutional investors, three represent the Big Four: Vanguard, State Street and BlackRock Institutional Trust Company (BRITC ). The last of the named companies belongs to the Black Rock empire, this is one of its structural divisions. Many of Black Rock's other shareholders are also members of the Big Four, acting as subsidiaries or grandchildren of financial holding companies. One of Black Rock's major shareholders is BlackRock Fund Advisors, a subsidiary of the parent company. This scheme of circular participation in capital is also typical for other financial holdings of the Big Four.
Owners of Vanguard (closed-end fund)
The picture for Vanguard is extremely confusing. The reporting of this holding states that its shareholders are the company's clients. And no specifics. Vanguard has thousands and thousands of clients. More detailed information is available only upon special request. Here’s what one Russian expert wrote about Vanguard’s informational secrecy: “It’s almost impossible to find out who owns Vanguard, although it seems that all documentation of this kind is open in the West. Vanguard is officially owned by the funds it manages and, by extension, by the investors in those funds. The name of one of these investors, far from the main one, is John Brennan - Director of the CIA (he held this post in 2013-2017 - V.K.).”
Owners of Fidelity (closed-end fund)
An extremely mysterious picture is emerging around Fidelity (FMR). The foundation was founded in 1946 by Edward C. Johnson II. At least in the early years of the foundation, it was owned by its founder, Edward Johnson, and members of his family. Then part of the company's capital passed into the hands of employees. If you believe foreign sources, today members of the Johnson family directly or through a system of trusts control 49% of the company's voting shares. Currently, the granddaughter of Edward Johnson II, Abigail Johnson, has taken the reins of the company, occupying the positions of president and chief executive. Very little is known about the Johnson family. Only sometimes the media reminds us of Abigail Johnson, including her in the top 10 most influential women on the planet.
State Street Owners
An open-end fund issues shares. We need to look at who appoints the managers.