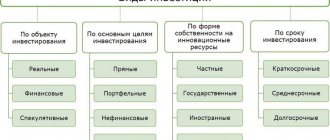
Investments play a vital role in the economy of any state, providing an opportunity to actively develop the most interesting and promising areas. To monitor the activity of investment activity, as well as to understand its impact and influence on certain areas of economic activity, such a concept as investment dynamics is used.
This is a change in the quantitative expression of the volume, level and speed of capital investments, which helps to analyze prospects and identify trends.
When analyzing a specific market or field of activity, all investors must analyze the dynamics of investments. The fact is that this is one of the most important economic indicators that investors focus on when weighing the pros and cons of specific investments.
By correctly tracking changes in periods and amounts of funding, anyone can easily determine the life cycle of a specific idea and analyze the potential for its development in the future.
Important! When analyzing the dynamics of investments, indicators such as the volume of capital investments, a specific period of time and a specific field of activity must be taken into account.
One of the characteristic features of investment dynamics is its constant variability, which is caused by a number of forces that constantly influence it. To better understand the dynamics of investment, one should analyze the factors that determine its development, of which there are quite a lot.
What is this
Investments in fixed capital are total expenses that are designed to expand or update fixed assets, carry out certain construction work, or do any other actions that will increase the initial price of the product produced.
The amount of invested funds can accelerate the level and rate of growth of a particular enterprise, the global situation in the industry and strengthen the country’s economy as a whole. But only on condition that such investments are carried out en masse and in all areas.
Today, considering processes globally, IVOK has the following structural features:
- Funds allocated for modernization. This includes the purchase of inventory, equipment, instruments, machines and other things. These are the so-called non-current assets.
- Investing finances in biological resources. That is, investments are made in human capital.
- Investing in intellectual property.
Based on the form of finance involved, the following are distinguished:
- Own material contributions.
- Credit money.
- Money from barter or equity participation.
Saving, consumption, investment models
The amount of household disposable income is the main factor determining the dynamics of consumption and savings. The dynamics of investment are determined primarily by the dynamics of interest rates, which is reflected in the corresponding functions of consumption, savings and investment.
1. The simplest consumption function has the form
,
where C
– consumer spending;
C
– autonomous consumption, the value of which does not depend on the size of current disposable income (living on debt);
MPC – marginal propensity to consume; Y – income; – tax deductions;
– disposable income (income after tax deductions). Marginal propensity to consume is the share of increases in spending on consumer goods in any change in disposable income.
,
Where
– increase in consumer spending, – increase in disposable income.
The change in MPC is graphically reflected in the change in the slope of the direct consumption line C (Fig. 28.1). For example, if the MPC was 25% of the increase in income (
) – straight line C1, then as a result of an increase in the propensity to consume (MPC = 50%) – straight line C2, the total income of society as a whole will increase from Y1 to Y2.
2. The savings function has the form
,
where S is the amount of savings in the private sector; –С – autonomous consumption; MPS – marginal propensity to save; Y – income; T – tax deductions.
The change in MPS is graphically reflected in the change in the slope of the savings line (Fig. 28.2). If MPC increases (straight line C1 in Fig. 28.1), then MPS decreases (straight S2 in Fig. 28.2), which naturally leads to an increase in the income of society as a whole.
The marginal propensity to save is the share of the increase in savings in any change in disposable income:
,
Where
– increase in savings, – increase in disposable income.
Since disposable income is the sum of consumption C and saving S (
), then an increase in income causes a certain increase in consumption and saving, therefore
MPC
+
MPS
constitutes an increase in income:.
3. Autonomous investment function
,
where I – investment costs; I – autonomous investments determined by external economic factors (mineral reserves, etc.); R – real interest rate; d – empirical coefficient of investment sensitivity to interest rate dynamics.
Factors determining the dynamics of investments: – expected rate of net profit; – real interest rate; – level of taxation; – changes in production technology; – available fixed capital; – economic expectations; – dynamics of total income.
With the growth of total income, autonomous investments are supplemented by stimulated ones, the value of which increases as GDP grows. The positive dependence of investment on income can be represented as a function
,
where Y is total income,
MPI is the marginal propensity to invest, which means the increase in investment costs when income changes and is calculated by the formula:
.
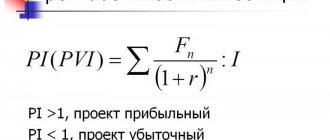
Rice. 28.3. Investment function
The larger part of the increase in income is invested, the greater the income of society will be (Fig. 28.3).
Dynamics and growth rate
Considering the dynamics and structure of investments in fixed capital in Russia, both in the form of long-term and short-term investments, it is worth noting the following figures issued by the Federal State Statistics Service:
- In 2010, as a percentage of the previous year, this amount was 106.3%.
- In 2011 the amount was already 110.8%.
- By 2012 – 106.8%.
- 2013 was marked by stabilization at the level of 100.8%.
- 2014 showed a decline to 98.5%.
- 2015 continued to show a decline of 89.9%.
- But in 2021 the situation also remained in the negative – 99.8%.
- By 2021, the situation has changed. The growth was 104.8%.
- 2018 showed almost the same figures as the previous reporting period - an increase of 104.3%.
But overall figures do not reflect the full picture of investment in the Russian Federation. This indicator must not only be considered for the country as a whole, but it is also important to analyze it for the constituent entities of the Russian Federation.
Capital investments depending on the region, taking into account the time factor, are as follows:
- In the Central Federal District, an increase in invested material resources was observed from 2005 to 2008, from 2010 to 2012. But, starting from 2013, there has been a regular decrease in this coefficient, with the exception of a slight increase in 2021 and 2018.
- In the Northwestern Federal District there was an increase from 2000 to 2008, 2010 to 2012. Between these periods, low activity was observed. But in the last two years the situation has improved slightly, although the amount of invested funds is no longer as large as in prosperous periods.
- The Southern Federal District showed a decline in 2009, like previous regions, and then from 2014 to 2021. 2021 also turned out to be a failure. In other periods there was systematic growth.
- In the North Caucasus Federal District, growth was from 2000 to 2005, in the period from 2007 to 2014. But 2009, and then the period from 2015 to 2021 were negative for the development of industry as a whole.
- The Volga Federal District also maintains general statistics. 2009, and then the period from 2014 to the present, is a stagnant period for the development of industry and other areas and enterprises.
- The same situation is developing in the Ural Federal District with one small difference: in 2021, 2021 and 2021, there is minimal growth in terms of investments and their efficiency ratio.
- The Siberian Federal District also showed a decline in 2009, although before that there had been systematic growth since 2000. Then, starting in 2013, investments again tended to minus. And only starting from 2017 there was a slight increase.
- The Far Eastern Federal District (FEFD) in 2000 showed a negative coefficient in relation to the previous reporting period. Then, starting from 2005, there was a systematic increase until 2011. And starting in 2012, there was a decline that lasted until 2021. 2017-2018 showed a positive increase.
Study of the structure and dynamics of investments in Russia
The article examines the structure of investments in Russia, analyzes the dynamics, and presents the results of a survey of organizations assessing the goals of investing in fixed capital. It was found that along with a decrease in the influx of foreign investment into Russia, the investment flow to foreign countries also decreased.
Key words: investment, potential, fixed capital, foreign direct investment (FDI)
When studying investment activity in Russia, it is necessary to analyze the dynamics of investments in non-financial assets. In general, in absolute terms, the volume of investments in this direction from 2013 to 2014 increased from 10,195.9 billion rubles. up to 10,524.2 billion rubles, while there were no significant changes in the structure of the investment flow (the main share of non-financial investments was directed into fixed capital (98.6% in 2014).
The volume of investments in fixed assets, starting from 2000, begins to increase significantly, with the average annual growth until 2013 being 6–10%, then it decreased noticeably, and in 2014 it amounted to 97.3% of the 2013 figure. Figure 1 in 2014 shows the excess of investment in 2014 over 2013, which is caused by taking into account data for the Republic of Crimea and the city of Sevastopol in statistics.
Rice. 1. Investments in fixed capital
The bulk of investments were directed to buildings (except residential) and structures (40.9% of the total in 2014) and machinery, equipment, vehicles (35.9%; of the total in 2014). In absolute terms, the volume of investments in buildings (excluding residential) and structures in 2014 amounted to 5551.4 billion rubles, which is slightly lower than the value of 2013 - 5582.7 (by 31.3 billion rubles or less than 1 %).
The volume of investments in machinery, equipment, and vehicles decreased more noticeably—by 365.5 billion rubles. or more than 6.5%. In general, over 14 years (2000–2014), the volume of investments in fixed assets tended to increase (more than 11 times); in 2014, despite the growth, the pace decreased (the increase at the end of the year was less than 1 %).
The smallest share of investments in fixed capital is directed to housing (15.3% of the total in 2014) and other assets (7.9%). It should be noted that the share of investments in buildings (except residential) and structures decreased slightly over the analyzed period (from 43.1% in 2000 to 40.9% in 2014), and the share of investments in housing from the total increased from 11.3% in 2000 to 15.3% in 2014
The structure of investments by funding sources has changed slightly over the past 5 years, with more than half coming from raised funds (54.2% or RUB 5,627.6 billion in 2014). Budget funds (consolidated budget funds) (17%) and bank loans (10.6%) occupy a significant place in the funds raised, and the volume of financing from foreign banks increased from 107.7 billion rubles. in 2013 to 266.4 billion rubles. in 2014, i.e. more than doubled.
It should be noted that the share of own funds in investment financing sources has decreased slightly since 2000 and amounted to 45.8% in 2014; the share of attracted funds has increased accordingly. Moreover, if the absolute increase in the volume of investment financing by foreign banks was more than 2 times, then the share of loans from foreign banks in investments in fixed capital during the analyzed period increased from 0.6 to 2.6%. At the same time, the share of bank loans increased even more (from 2.9 in 2000 to 10.6% in 2014).
The share of funds from the federal budget in the total volume of investment resources for the analyzed period from 2010 to 2014. practically does not change and amounted to 9.1% for 2014; in absolute terms, data from 2011 also change within the measurement error.
It should be noted that the situation with attracting investment from abroad remains quite difficult. Thus, in 2013, investments in fixed capital from abroad amounted to 76.4 billion rubles, in 2014 - 87.8 billion rubles. Their share in the structure of sources of financing investments in fixed assets is very small and amounts to 0.8%, which indirectly means that investments in the Russian economy are unattractive for foreign capital.
As a result of a survey of organizations assessing the goals of investing in fixed capital, the majority of respondents noted that investments are aimed at replacing worn-out machinery and equipment (69%), 50% - automation and mechanization of the existing production process, 41% - saving energy resources.
Russian entrepreneurs began to invest more in order to replace worn-out machinery and equipment (123.21%), which is associated with moral and physical wear and tear of equipment, especially since scientific and technical progress requires permanent monitoring of equipment and production technologies, and the process of globalization leads to an acceleration of the period of exchange of experience. The second area of investment, which has an upward trend in respondents' answers, is the introduction of energy-saving technologies (organizations began to invest more money in energy savings over the period 2000–2014, as evidenced by the survey data).
The rate of investment to increase production capacity with a constant product range, as well as to create new jobs and protect the environment, has decreased significantly, which should be analyzed by government agencies.
Statistical information on the volume of foreign investment in Russia by country of investment is given in table. 1. A significant part of investments comes from states with a small territory, which are offshore zones (for example, Cyprus, the Bahamas, the Virgin Islands). In 2014, the flow of foreign investment into Russia sharply decreased by more than half (from 69,219 million dollars in 2013 to 22,857 million dollars in 2014), which indirectly indicates a decrease in business activity in the economy, high risks and crisis events. It was in 2014 that crisis phenomena began to occur in Ukraine, and then in Russia, as a result of which individual European and other countries introduced sanctions against the Russian Federation. Thus, the global payment systems Visa and MasterCard slightly changed the rules of operation in the Russian market, and in March 2014 they suspended servicing cards of several Russian banks (including Rossiya Bank and SMP Bank, which were on the sanctions list).
In the second half of 2014, the turbulence of the processes occurring in Russian markets increased, the devaluation of the national currency amounted to more than 90%, while the price of hydrocarbons on world markets decreased (for oil - by 2 times).
Under these conditions, the volume of investment inflows into the Russian economy has decreased, however, the country structure suggests that with the stabilization of the macroeconomic situation and the creation of appropriate conditions, the volume of investments from offshore zones may increase.
An analysis of the structure of FDI by country suggests that investors are persons connected in some way with Russia, and capital is Russian capital exported and working abroad.
Table 1
Foreign direct investment in the Russian economy by main investor countries (according to the methodology of the balance of payments of the Russian Federation; millions of US dollars)
| 2011 | 2012 | 2013 | 2014 | |
| Foreign direct investment - total | 55084 | 50588 | 69219 | 22857 |
| including from countries: | ||||
| Cyprus | 12999 | 1985 | 8266 | 5874 |
| Bahamas | 1829 | 2111 | 2791 | 3764 |
| Virgin Islands (British) | 7225 | 2475 | 9379 | 2542 |
| Switzerland | 741 | 401 | 1086 | 2472 |
| France | 1107 | 1232 | 2121 | 2082 |
| China | 126 | 450 | 597 | 1271 |
| Netherlands | 7383 | 10330 | 5716 | 1239 |
| Austria | 1563 | 1135 | -326 | 840 |
| USA | 276 | 285 | 485 | 708 |
| Bermuda | 594 | -320 | 404 | 535 |
Along with the decrease in the influx of foreign investment into Russia, the investment flow to foreign countries also decreased from 86,507 million dollars in 2013 to 56,389 million dollars in 2014, and the volume of investments in Cyprus increased more than three times (from 7671 to 23430 million dollars), however, when analyzed from 2011, the increase was 2.2% or 500 million dollars.
This may mean that potential investors are waiting for stabilization in the market and are in no hurry to invest in other countries.
During the analyzed period, the rate of investment in Hong Kong increased significantly (from 26 million US dollars in 2011 to 1095 million US dollars, or more than 40 times). However, in absolute terms, the volume of investments in Hong Kong is quite insignificant and in 2014 amounted to 1.94% of the total volume of direct investments from Russia in the economies of the countries that are the largest recipients of direct investments (for comparison, Cyprus in 2014 - 41.55%, Switzerland - 12.28%, Bermuda - 5.31%, Netherlands - 4.0%).
Based on the results of the analysis, it can be noted that investment activity in the Russian Federation has been declining in recent years; for foreign investors, Russia still remains not attractive enough for investment. At the same time, as the level of uncertainty in the country decreases and the macroeconomic situation stabilizes, investment activity will also intensify.
Literature:
- Russian statistical yearbook [Electronic resource]. Access mode: https://www.gks.ru/
- Modern trends in managing the socio-economic development of the territory / Melnik L. G., Tsukanova N. E., Kovarda V. V., Emelyanova O. V. et al. / Collective monograph. Edited by S. G. Emelyanov, I. V. Minakova. Orel, 2010.
- Minakova I.V., Kudina O.V., Marganova O.N., Kovarda V.V. Management of investment processes in the region based on the use of information technologies // Bulletin of ENGECON. Series: Economics. 2011. No. 6. pp. 100–105.
- Minakova I.V., Kudina O.V. A set of balanced integral indicators for assessing the investment potential of the region // Bulletin of ENGECON. Series: Economics. 2011. No. 3. P. 60–66.
- Emelyanova O. V. Structure of foreign investments in the corporate sector of the national economy // In the collection: World economy and society: modern trends and development prospects, collection of scientific articles. 2021, pp. 218–225.
Investment share
When considering the share of investment, it is important to consider the country's gross domestic product per capita. This marker helps to assess the development of the economy in the country as a whole. Although there are some features that are worth discussing after providing statistical parameters.
In fixed capital in GDP
So, considering the share of investment in fixed capital in relation to the state’s GDP, it is worth indicating the following percentage figures. The information is presented in table form for better understanding.
| Year of funding | Percentage |
| 2011 | 20,7% |
| 2012 | 20,9% |
| 2013 | 21,2% |
| 2014 | 20,5% |
| 2015 | 20% |
| 2016 | 21,2% |
| 2017 | 21.4% |
| 2018 | 20,6% |
Considering these indicators, it should be noted that the implementation of the May decrees did not have any effect in this area.
In fixed capital to GRP
Analyzing the volume of investments in OK in relation to the internal regional product (GRP), it is worth noting the following statistical parameters:
- Continuous growth was observed from 2003 to 2008. Over these 5 years the situation has changed from 12% to 32%.
- In 2008 and 2009 the situation remained stable.
- Starting from 2009, the indicator began to deteriorate significantly, as there was a constant decrease in this parameter.
It is interesting that despite the increasing investment in fixed assets in ruble terms, in relation to GDP it is growing insignificantly. A paradoxical situation is emerging in which investments are growing quite quickly. GDP does not show such speed parameters. But if we compare these two parameters, the amount of funds invested in investment activities decreases in relation to GDP.
This contradiction is explained by the specifics of the calculations.
Functions of state regulation of investment activities
Investment dynamics are also directly affected by government policy, and the role of laws regulating investment activities should not be underestimated. The main functions of the state related to influencing the investment climate in the country include the following:
- Financing the most promising investment projects;
- Improving tax policy in the state;
- State financing and provision of guarantees on a competitive basis;
- Protection of domestic companies from the acquisition of outdated equipment;
- Co-financing (with private companies) of interesting projects.
Given the close relationship between the dynamics of investment, GDP and industrial production in a country, it is not surprising why governments of highly developed countries pay great attention to investment policy.
Attention! The investment climate in Russia is quite good, but currently the main focus is on attracting capital investments from investors from the countries of the Middle and Far East (China, South Korea, Iran).
Structure
Another important parameter is the structure of investment activity. IVOC include:
- Accounting for types of financial assets.
- Type of economic activity.
- Taking into account funding sources.
- Accounting for economic activity.
By type of fixed assets
If we consider the percentage distribution of PF, statistical data on average from 2000 to 2021 fluctuates around the given figures:
- In housing – about 13% on average.
- In buildings and various structures with the exception of residential – 42%.
- In cars, vehicles, instruments and other equipment, about 37%.
- Intellectual property objects - 3.5%.
- Other types – 6%.
If we take into account this expression in rubles, then statistics provide the following parameters for 2021:
- The amount contributed to housing was RUB 2,321.9 billion.
- In non-residential structures and buildings - 7542.8 billion rubles.
- In machinery, equipment, instruments and various types of equipment - 6283.4 billion rubles.
- Investments in intellectual property objects amounted to 558.5 billion rubles.
- To other funds – RUB 1,075.4 billion.
By type of economic activity
The most successful, from the point of view of investing financial resources, are:
- Mining - there has been an increase since 2009 from 13.2% to 19.4%.
- Sufficient amounts are also invested in manufacturing industries, fluctuating around 14.5%.
- Agriculture shows lower figures – about 3.5%.
- Construction also has lows of around 0.7%.
By funding source
According to sources, the indicators are as follows:
- About 45% is invested from own funds. Moreover, about 20% comes from profit, 20% from depreciation and the remaining 5% from reserves.
- Of those attracted, 55% are spent. Of this amount, budget funds make up about 20%.
- Bank loans 9%.
- Bonded non-financial amounts are about 10%.
- Shares – 0.3%.
- Funds' funds - 0.5% and others - about 9%.
- Borrowed funds from other organizations are about 6%.
By type of ownership
From a property perspective, the amounts are distributed in percentage terms as follows:
- Russian ownership 85%. Of this, state property accounts for about 13%. Municipal – about 2%. Private – 61%. Mixed Russian without foreign participation about 7%.
- Foreign reaches just over 6%.
- Joint Russian and foreign over 8%.
Investment strategy
Today the state is trying to ensure the following goals and conditions:
- Creating the most positive conditions for the financial activities of not only domestic, but also foreign investors.
- Minimize risks while simultaneously increasing the profitability of any type of production.
- Increasing the well-being of citizens, due to which more intensive trade turnover will be carried out. This, in turn, helps to revive the country's economy as a whole.
Thus, when considering these points, it is worth noting that the main legislative actions on the part of the state are aimed at regulating this area and focusing on creating the most favorable conditions for its development.
But, since there is a certain economic and political instability, as well as a crisis in the financial sector at the world level, the development of the economic sector cannot be called favorable. Most likely, it is in a transition period.
The essence of the phenomenon
Modern financiers firmly believe that investment and GDP are closely related. There is a clearly expressed directly proportional relationship between them. Thus, an increase in the volume of investments immediately affects the positive dynamics and increase in gross domestic product. At the same time, when GDP grows, the pace and volume of investment increases along with it.
Economic Keynesian theory suggests the existence of an investment multiplier effect. The meaning of this phenomenon is that even a slight increase in investment can provide a significant increase in gross domestic product.
This approach has a fairly simple explanation, according to which financial investments represent a powerful impetus for the development of the country’s industry. This is followed by an increase in jobs and income growth. Consequently, the consumption of manufactured goods is also growing, which, in turn, again stimulates production for further development.
Yes, all the above calculations were initially of a purely theoretical nature. However, enough time has passed since their appearance for it to be possible to consciously assert the presence of a powerful positive impact that domestic and foreign investments have on GDP.
At the same time, it is necessary to take into account that the described relationship is not subject to any strict, unchanging laws and therefore cannot be considered absolute. Investments will always be quite mobile and changeable. They often depend on many not only economic, but also political and social factors. Against their background, GDP looks like a much more stable and stable macroeconomic indicator.
Nevertheless, the modern development of economic science is quite sufficient to construct a mathematical model that, with fairly high accuracy, will allow us to determine the existing relationship between the dynamics of investments in the national economy and changes in gross domestic product. Yes, such calculations will always have a certain error. However, its level can be predicted in advance. At the same time, such a model will make it possible to make fairly accurate development forecasts. In particular, with its help it will be possible to plan the required level of investment, which will lead to the required level of GDP growth.
Current statistics
As discussed above, statistical data indicate that until 2012 there was an increase in financial resources poured into various areas of production. But then the market experienced a certain stagnation in some years or even a decline.
On years
The following data is available by year:
- In 2000, the amount of financing amounted to 787.1 billion rubles.
- In 2010, the amount increased to 1,769.9 billion rubles.
- It reached its peak in 2012-2013 with figures of 2094.4 billion rubles.
- After this, a decline began, reaching 1,305 billion rubles in 2021.
By city and region
Despite the fact that there is now some crisis and recession, there are still regions that have not experienced this negative impact:
- By 2021, the Tyumen region has attracted the largest amount of funds out of all the constituent entities of the Russian Federation. Moreover, the region’s share was only 21%.
- As for Moscow, she took second place.
- After Moscow comes the Yamalo-Nenets Autonomous Okrug.
- Then Khanty-Mansiysk Autonomous Okrug.
- And St. Petersburg closes the top five.
By industry
The statistics by industry are as follows:
- The largest amount is observed in the field of transport and communications. In total, in percentage terms this area accounts for about 19%.
- Real estate is in the same niche – also about 18-19%.
- Then comes the oil and gas complex with its 14%.
- Next comes APK – about 11%.
- After this comes education, health and trade with figures of about 5%.
- About 3% of funds are invested in mechanical engineering and the energy sector.
- Almost the same amount is in the energy sector.
Structure of foreign investments
In terms of the type of investment structure in Russia, direct investments predominate; they are more difficult to withdraw when the political situation changes (49.5% as of 2021), while there are fewer portfolio investments. Direct investments show long-term investments in the Russian economy, but political and economic stability in the country is important to increase them.
Looking for ideas for study work on this subject? Ask a question to the teacher and get an answer in 15 minutes! Ask a Question
Analysis of sectoral investment shows that the following sectors of the economy are in the lead:
- manufacturing industries (20.8%),
- mining (20.4%);
- wholesale and retail trade (19.9%);
- financial activities and insurance (14.4%);
- provision of services (6.2%);
- information and communication (3.9%);
- real estate (3.3%);
- other industries (10.5%).
Sectors such as education, water collection and purification, tourism, culture and entertainment, healthcare and social services, hotels and restaurants, scientific research, forestry, etc. have virtually no foreign investment, which indicates a lack of interest in the development of these sectors investors, and also that these sectors cannot offer attractive projects. In particular, there has been a decrease in foreign investment in Russian agriculture. Thus, foreign capital goes to areas with the greatest benefit, where the risks of loss of capital will be minimal, and in this case these are the extractive raw materials industries, first of all. However, this leads to Russia’s technological backwardness from the most developed countries, which is why it is so important to support domestic science and make it attractive to investors.
Forecast
As for the forecast indicators, the situation here does not look the best. Most likely, in the next 5 years the amount invested in various sectors of the economy will decrease. Therefore, one should not expect significant changes in the structure of the country's economy.
In order to change the situation radically, serious measures of support from the state are needed. Implemented programs must be comprehensive and aimed at various aspects that affect the situation in the field.