Secrets of the Alligator indicator on Forex
The Alligator indicator (or Bill Williams' Alligator) is a trend indicator and signals the beginning of a new trend. It includes a series of moving averages that utilize fractal geometry as well as nonlinear dynamics. The indicator is quite popular and is included in analysis packages for most terminals. It was used by Williams in the “Trading Chaos” system, which he described in the book “New Changes in Stock Trading”.
Formula
The alligator indicator is a combination of 3 moving averages with small periods of 13, 8 and 5. It was first used by the famous trader Bill Williams in 1995. The analyst took as a basis the median price, which is calculated not by the closing of the candle, but by its average value in accordance with the elementary formula:
Median = (Low + High) / 2
Here:
- Low is the minimum of the candle;
- High is its maximum.
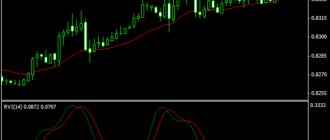
The averaged parameter gives a more correct calculation of the cryptocurrency price, since it “smoothes out” too sharp jumps. Thanks to this, the indicator more adequately reflects the current trend than the candles themselves. In addition, it helps to predict price reversals - the lines go either below the chart or above it.
The naked eye can see that the green line moves closest to the candles, the red line moves a little further, and the blue line moves farthest away. By analyzing the trend using 3 tools, the picture becomes much clearer. This is especially true for cryptocurrency, the dynamics of which can change dramatically several times a day.
Bill Williams and Alligator indicator
Bill Williams is a well-known trader who shared the view of many analysts, emphasizing the unpredictability of the market. Williams argued that most trading systems fail when they try to predict the unknown. So he tried to develop approaches that did not require predictability and emphasized the need to be able to read the market itself, rather than accept the opinions of other people.
Bill Williams also emphasized the importance of keeping it simple. He argued that markets can be very simple, and to succeed, a trader only needs to understand the structure of the market. Williams' approach is that in order to guide future performance, one must focus on the current state of affairs, rather than trying to analyze past situations. Its indicators are designed to highlight changes in traders' behavior that lead to new trends emerging.
Definition
These 3 lines represent classic moving averages. They smooth out and average the price of a cryptocurrency or any other asset.
A trader can easily determine the trend - if the lines go below the candles, then the trend is upward, if higher then the trend is downward.
The described 3 moving averages have conventional names:
- Blue – jaw (Jaws). This is a moving average with a period of 13, which moves forward by 8 candles.
- Red – alligator teeth (Teeth). Its period is 8, shift 5.
- Green – lips (Lips): period 5, shift 3.
Thus, a “crocodile” constantly runs along the asset, which periodically “devours” candles (at the moment of a trend change). The “lips” are closest to the graph, followed by “teeth” and “jaws”.
Characteristics
Platform: MT4 Currency pairs: Any Time frame: from H4 and higher Trading time: 24 hours Indicator type: classic trend Recommended trading centers: Alpari, Forex4You, RoboForex
How to install an indicator in the program
The alligator is one of the basic indicators, so you can find it in almost any program - for example, in the classic MT4 terminal, its improved version MT5 or on a live chart.
Installation instructions are very simple:
- Open the program.
- Go to the “Insert” section.
- Select "Indicators".
- Then - “Custom”.
- Click "Alligator".
After this, 3 lines will appear on the screen that go above or below the candles, periodically crossing each other.
Setting up this indicator for trading on a live chart looks a little more complicated. Since the alligator itself is not there, the user adds 3 Moving Averages with the specified periods. To do this you need:
- Login to the program.
- Click on the indicated icon.
- Select “Moving Average” from the list.
- Click on the gear icon (settings) and enter the desired period - first 13.
- Then 2 more lines are added, respectively, with periods of 8 and 5. It is better to choose exactly the same colors - blue, red and green, so that there is no confusion.
Note! In the settings you can change any instrument parameters (both periods and colors). However, in most cases this is not necessary. For beginners, it is better to practice on the classical scheme, and then adjust the periods (if necessary).
On TradingView, the alligator is in the list of built-in indicators.
In some cases, the indicator may not be on the platform itself. Then you can download it from almost any website and add it to the terminal. The sequence of actions is as follows:
- Download a folder or file.
- Select a file.
- Open the MT4 terminal.
- Follow the path: “File – Open data directory – MQL4 or MQL5 – Indicators”.
- Copy the file to this folder.
- Exit the program and enter it again. You can also find the alligator among custom tools or in the “Bill Williams Indicators” folder.
Important! Often on the Internet you can download an improved indicator with an alert, i.e., a signal for entry.
This is done so that the trader receives a sound notification and hurries to the monitor. The function is somewhat useful, but experienced users determine entry points on their own, which is useful for developing their own trading skills.
Where is the Alligator hiding in the MT4 terminal?
Alligator indicator settings
Next, we will tell you where the reptile is hiding in the MetaTrader 4 trading and analytical terminal. We will show you one of the most optimal and convenient ways to extract it onto a working chart. We will also demonstrate its particularly significant settings. So, to extract the indicator onto the work area, we will be guided by the above set of screenshots. To do this, we need to make several consecutive clicks when hovering the cursor over the following tabs: “Insert” > “Indicators” > “Bill Williams” > “Alligator”.
After such simple steps, we can already observe the technical instrument on the quote monitor. Now, to call up its settings window, just move the cursor over one of the “moving average” lines of this indicator and click with the right ear of the mouse. One of 3 tabs will appear, as shown in the same picture above. Let's start looking at these settings from the last tab “Display”...
Signals for entry
The use of the alligator indicator is quite simple. Intuitively, when the lines go under the candles and expand, the uptrend is gaining strength. As soon as they narrow and cross each other, moving to a position above the candles, the opposite trend begins.
The main “states” of an alligator:
The description of the basic trading strategy looks like this:
- Signal to buy (BUY) cryptocurrency: candles turn around and cross the lines from bottom to top. The lines themselves intersect each other, resulting in the blue line being the lowest, red next, and green the highest.
- A sell signal (SELL) is an opposite fractal (pattern). The candles cross the alligator from top to bottom, the blue one becomes the highest, followed by the red one, and the green one below.
Since cryptocurrency is characterized by particularly dynamic volatility (changeability), the alligator often generates false signals.
Therefore, it is advisable to wait for additional confirmation - the price on the market has actually turned around and formed at least one more minimum or maximum, which is respectively lower or higher than the previous one.
To trade profitably, it is useful for traders to know where to set stop loss and take profit:
- The stop-loss level for fixing possible losses is usually set several points below/above the nearest minimum/maximum.
- The take-profit level is set differently, depending on the trader’s strategy and the risk distribution system he has adopted. In most cases, it is better to close the order line at the moment when the candles again began to turn in the opposite direction, i.e. they crossed the alligator lines at least partially.
Advice! Users often use such a convenient tool as a trailing stop. This is a dynamic take profit that follows the price and fixes profit or loss in accordance with the settings (you can set them yourself).
Alligator disadvantage.
As for the disadvantages of a cold-blooded reptile, this undoubtedly includes many false signals. So generously distributed by her during flat consolidation. And as a result, this can lead to many open positions, with the expectation of a “breakout”. Which, in turn, will never happen. As a result, we will miss the moment when this indicator forced us to resort to overestimating the risk. Due to the large number of open positions, it exceeds the limit on our trading system.
If we summarize all the aspects discussed in this material. Compare them with an understanding of risk and expectation. And also, taking into account the probably spent time and the opportunity to attract other instruments, we can summarize the following: The Alligator indicator will cope with the task of earning moderate interest. Provided that you use it on a timeframe no younger than H4, with a sufficiently long sample of transactions! And that's all! Good luck with your practice!
Strategies
The use of an alligator is allowed both on Forex and binary options. The broker's platform also does not matter much, since the principle of working with this tool is the same. However, the alligator itself is used extremely rarely: the accuracy of its trading signals is low.
Therefore, experienced traders recommend using it in conjunction with other classical analysis tools. As a result, each user can create their own trading strategy, which can provide stable profits by opening orders on cryptocurrency.
Alligator + Stochastic
The stochastic indicator is a classic oscillator. This means that it shows overbought and oversold periods in the market. In the first case, players made too many purchases, so the price will soon turn down; in the second case, on the contrary, an upward trend is expected.
Signals for entry are:
- To buy (BUY): stochastic is located below the lower line, with the blue one crossing the red one from bottom to top. The alligator moves from the position “above the candles” to the position “below them”.
- For sale (SELL): stochastic is above the upper level, the blue line crosses the red one from top to bottom. At the same time, the alligator itself crosses the candles from bottom to top.
Alligator + AO
(Awesome Oscillator) is another oscillator that can be found in the MT4, MT5 terminal, as well as on the live chart. This strategy works like this:
- Buy signal (BUY): the alligator goes under the candles, the AO chart bars move out from under the bottom line and rise above it.
- Signal to sell (SELL): a mirror situation when AO, on the contrary, moves from top to bottom.
Alligator + Parabolic SAR
Parabolic SAR is another Bill Williams indicator. Trading using this system is carried out as follows:
- Buy (BUY): the parabolic points move from the position “above the candles” to the position “below the candles”.
- Selling (SELL): the opposite signal – the parabolic becomes above the candles.
Alligator + RSI
The RSI tool shows the strength of trend development, so it can also be used to predict trend reversals:
- Buy (BUY) – RSI leaves the lower zone and goes up.
- Selling (SELL) – RSI leaves the upper zone and goes down.
In what cases should you not use the indicator?
The basic rules for trading using the alligator instrument are described above. Obviously, this is a trend indicator that follows the price. It shows the current trend well only in cases where it actually exists. However, a flat often occurs in the cryptocurrency market - a situation in which the price actually “moves” in a narrow corridor, i.e. the fluctuations are barely noticeable.
A characteristic feature is that the alligator’s lines go straight along the candles, and they are located very close to each other, that is, the “jaws”, “teeth” and “lips” are barely distinguishable.
It is not worth trading at such times, since the alligator, like other indicators, only sends false signals. Therefore, it is useful to know when a flat occurs. It is usually observed in the following cases:
- Opening/closing of the exchange.
- Almost the entire working time of the Pacific session from 23 to 8 hours Moscow time: the Asian market is relatively calm, which has long been noticed by experienced traders.
- Waiting for the release of important economic news - for example, according to unemployment data in the United States, oil reserves, the key rate of the Central Bank of a particular country.
You should not trade immediately after the publication of news, since at this time the price of cryptocurrency, like most other assets, makes sharp movements. It is worth waiting 1-2 hours or more for the market to decide on the “needed” trend.
Thus, the alligator is a convenient and completely understandable tool for technical analysis. Both experienced and novice traders can master it. However, it is better to use it together with other indicators. Then the accuracy of forecasts will increase significantly.
Trading examples
A visual description of the indicator's operation is shown in the figure below. It shows a 1-minute chart of the USD/JPY currency pair. Circles indicate entry points into the market based on indicator signals (the moments at which the Alligator’s “mouth” begins to open). Considering the third tip described above, we ignore the signals at points 2 and 4, because they are counter-trend. At points 1, 3, 5 and 6, the trader purchases “Higher” binary options. As you can see, in all four cases the signals turned out to be reliable, and after their appearance the price went up. Consequently, the purchased options made a profit.
If you had taken the risk and bought the Below binary options at points 2 or 4, you would have made a loss. After all, there was no significant price reduction after the appearance of these signals - they were corresponded only to shallow and fleeting corrections.
Click on the picture to enlarge