Let's look at 6 methods for assessing the effectiveness of investments, give various formulas for calculating investment ratios, and a methodology (algorithm) for calculating them in Excel. These methods will be useful to investors, financial analysts, business analysts and economists. It should be noted right away that by investment we mean various investment projects, investment objects and assets. That is, these methods can be widely used in the valuation activities of any enterprise/company.
All methods for assessing the effectiveness of investment projects can be divided into two large groups:
Take our proprietary course on choosing stocks on the stock market → training course
- Statistical methods for evaluating investment projects Payback period of an investment project (PP, Payback Period)
- Profitability of an investment project (ARR, Accounting Rate of Return)
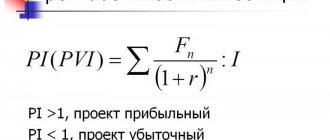
- Net present value (NPV, Net Present Value)
Take our proprietary course on choosing stocks on the stock market → training course
Infographic: Payback period (PP, DPP, BO DPP)
★ Investment appraisal in Excel. Calculation of NPV, IRR, DPP, PI in 5 minutes
This indicator allows you to compare different projects with each other in terms of their efficiency in return on capital.
Take our proprietary course on choosing stocks on the stock market → training course
| Business valuation | Financial analysis according to IFRS | Financial analysis according to RAS |
| Calculation of NPV, IRR in Excel | Valuation of stocks and bonds |
Dynamic or discounted method
As the name suggests, this method determines the time from investment to return of funds, taking into account discounting. We are talking about a point in time when the net present value becomes non-negative and remains so.
Due to the fact that the dynamic coefficient implies taking into account changes in the cost of finance, it will certainly be greater than the coefficient when calculated in a simple way. This is important to understand.
The convenience of this method partly depends on whether the financial income is constant. If the amounts are different in size and the cash flow is not constant, then it is better to use calculations with the active use of tables and graphs.
Next, we will analyze possible calculation formulas
#1 Payback period (PP). Formula
Where:
IC (Invest Capital) – initial investment costs in the project;
CFi (Cash Flow) is the cash flow from the project in the i-th period of time, which is the sum of net profit and depreciation.
To calculate cash flow, you must use the following formulas:
or
Where:
A (Amortization) – depreciation, a type of cash flow that is not a cost;
NP (Net Profit) – net profit of an investment project.
| ★ InvestRatio program - calculation of all investment ratios in Excel in 5 minutes (calculation of Sharpe, Sortino, Treynor, Kalmar, Modiglanca beta, VaR ratios) + forecasting rate movements |
Statistical methods for assessing the effectiveness of investments/investment projects
★ Investment appraisal in Excel. Calculation of NPV, IRR, DPP, PI in 5 minutes
Statistical evaluation methods are the simplest class of approaches to the analysis of investments and investment projects. Despite their apparent simplicity of calculation and use, they allow you to draw conclusions on the quality of investment objects, compare them with each other and weed out ineffective ones.
Payback Period
Payback period of an investment or investment project ( Payback Period, PP, payback period) - this coefficient shows the period during which the initial investment (costs) in the investment project will pay off. The economic meaning of this indicator is to show the period during which the investor will return his invested money (capital).
| ★ InvestRatio program - calculation of all investment ratios in Excel in 5 minutes (calculation of Sharpe, Sortino, Treynor, Kalmar, Modiglanca beta, VaR ratios) + forecasting rate movements |
Formula for calculating the payback period of an investment (investment project)
Where:
IC (Invest Capital) – investment capital, the initial costs of the investor in the investment object. In the formula in foreign practice, the concept is sometimes used not of investment capital, but of cost of capital (Cost of Capital, CC), which essentially has a similar meaning;
CF (Cash Flow) is the cash flow that is created by the investment object. Cash flow is sometimes understood in formulas as net profit (NP, Net Profit).
The formula for calculating the payback period/payback period can be described differently; this option is also often found in the domestic literature on finance:
It should be noted that investment costs represent all the investor’s costs when investing in an investment project. Cash flow must be taken into account for certain periods (day, week, month, year). As a result, the payback period of the investment will have a similar measurement scale.
An example of calculating the payback period of an investment project in Excel
The figure below shows an example of calculating the payback period of an investment project. We have initial data that the cost of initial costs was 130,000 rubles, the monthly cash flow from investments was 25,000 rubles. First, you need to calculate the cash flow on an accrual basis; for this, the following simple formula was used:
Cumulative cash flow is calculated in column C, C7=C6+$C$3
If you calculate the payback period using the formula, you get the following:
Since we have a discrete period, it is necessary to round this period to 6 months.
Directions for using the payback period of investments (investment projects)
The indicator of the payback period of investments is used as a comparative indicator for assessing the effectiveness of alternative investment projects. The project that has a faster payback period is more effective. This coefficient is, as a rule, always used in conjunction with other indicators, which we will discuss below.
Take our proprietary course on choosing stocks on the stock market → training course
Advantages and disadvantages of the payback period indicator
The advantages of the indicator are its speed and ease of calculation. The disadvantage of this ratio is obvious - its calculation uses a constant cash flow. In real conditions, it is quite difficult to predict sustainable future cash flows, so the payback period may change significantly. In order to reduce possible deviations from the payback plan, the reliability of the sources of cash flow for the investment project should be ensured. In addition, the indicator does not take into account the effect of inflation on changes in the value of money over time. The payback period of investments can be used as a screening criterion at the first stage of evaluation and selection of “heavy” investment projects.
| ★ InvestRatio program - calculation of all investment ratios in Excel in 5 minutes (calculation of Sharpe, Sortino, Treynor, Kalmar, Modiglanca beta, VaR ratios) + forecasting rate movements |
Accounting Rate of Return
The return on investment or investment project coefficient (Accounting Rate of Return, ARR, ROI, accounting rate of return, return on investment) is an indicator reflecting the profitability of the investment object without discounting.
Formula for calculating ROI ratio
Where:
CFav – average cash flow (net profit) of the investment object for the period under review (month, year);
IC (Invest Capital) – investment capital, the initial costs of the investor in the investment object.
There is also the following version of the return on investment formula, which reflects the case when additional investments are made into an object/project during the period under review. Therefore, the average cost of capital for the period is taken. The formula then looks like:
Where:
IC0, IC1 – cost of investments (expended capital) at the beginning and end of the reporting period.
An example of calculating the return on investment ratio (investment project) in Excel
In order to better understand the economic meaning and calculation algorithm, we will use Excel. The costs that the investor incurred were only in the first period and amounted to 130,000 rubles; cash receipts from investments changed monthly, so we calculate the average receipts by month. The billing period can be any time period, quarter, year. In our case, we get the monthly profitability of the investment project. The calculation formula in Excel is as follows:
B14=AVERAGE(C5:C12)/B5
Purposes of using the profitability ratio of an investment project
This indicator is used to compare various alternative investment projects. The higher the ARR, the higher the attractiveness of a given project for an investor. As a rule, this indicator is used to evaluate existing projects, where it is possible to monitor and statistically evaluate the effectiveness of creating cash flow for a given investment.
Take our proprietary course on choosing stocks on the stock market → training course
Advantages and Disadvantages of ROI Ratio
The advantages of the coefficient are its simplicity of calculation and receipt, and this is where its advantages end. The disadvantages of this ratio include the difficulty of predicting future cash flows/income from the project. In addition, if the project is a venture capital project, then this indicator can greatly distort the picture of how the project is perceived. ARR is usually used to externally demonstrate the success of a particular project. The indicator in its formula does not take into account changes in the value of money over time. This indicator can be used at the first stage of assessment and selection of investment projects.
| Business valuation | Financial analysis according to IFRS | Financial analysis according to RAS |
| Calculation of NPV, IRR in Excel | Valuation of stocks and bonds |
Payback period (PP). Example calculation in Excel
Let's calculate the payback period of investments in the project using Excel. To do this, it is necessary to determine the initial costs, which in our example amounted to 100,000 rubles, then it is necessary to predict future cash flows (CF) and determine from what period the amount of cash flow will exceed the initial investment costs. The figure below shows the calculation of the payback period of the project. The formula for calculating cash flow on an accrual basis is as follows:
Cumulative cash flow (CF) =C6+D5
An example of calculating the payback period of an investment in Excel
In the fifth month, the amount of cash receipts will cover the initial costs, so the payback period will be 5 months.
The main disadvantages of using this indicator in investment assessment are:
- Lack of discounting of business project cash flows.
- Cash receipts beyond the payback period are not considered.
Take our proprietary course on choosing stocks on the stock market → training course
Financial model of an investment project in Excel
Compiled for the projected payback period.
Main components:
- description of the macroeconomic environment (inflation rates, interest on taxes and fees, required rate of return);
- projected sales volume;
- projected costs for attracting and training personnel, renting space, purchasing raw materials, etc.;
- analysis of working capital, assets and fixed assets;
- sources of financing;
- risk analysis;
- forecast reports (payback, liquidity, solvency, financial stability, etc.).
For a project to be credible, all data must be confirmed. If an enterprise has several income items, then the forecast is prepared separately for each.
A financial model is a plan for reducing risks when investing. Detail and realism are a must. When drawing up a project in Microsoft Excel, follow the following rules:
- initial data, calculations and results are on different sheets;
- the calculation structure is logical and “transparent” (no hidden formulas, cells, cyclic links, limited number of array names);
- the columns correspond to each other;
- in one line – formulas of the same type.
#2 Discounted payback period (DPP). Calculation formula
Discounted Payback Period (DPP, Discounted Payback Period) – the period of return of funds taking into account the time value of money (discount rate). The main difference from the simple payback period formula is the discounting of cash flows and the reduction of future cash receipts to the current time.
Where:
DPP (Discounted Payback Period) – discounted payback period for investments;
IC (Invest Capital) – initial investment costs in the project;
CF (Cash Flow) – cash flow created by an investment;
r – discount rate;
n – project implementation period.
How to calculate the payback period. Types of calculations
As a standard, there are two options for calculating the payback period. The separation criterion will be taking into account the change in the value of the money spent. That is, accounting occurs or it is not taken into account.
- Simple
- Dynamic (discounted)
Easy way to calculate
It was used initially (although it is still common now). But obtaining the necessary information using this method is possible only under several factors:
- If several projects are analyzed, then only projects with the same lifespan are taken.
- If funds will be invested only once at the very beginning.
- If the profit from the investment will come in approximately equal parts.
This is the only way, using a simple calculation method, you can get an adequate result in terms of the time it will take to “return” your money.
The answer to the main question - why this method does not lose popularity - is in its simplicity and transparency. And if you need to superficially assess the risks of investments when comparing several projects, it will also be acceptable. The higher the indicator, the riskier the investment. The lower the indicator in a simple calculation, the more profitable it is for an investor to invest, because he can count on a return on investment in obviously larger parts and in a shorter period of time. This will help maintain the company’s liquidity level.
But the simple method also has clear disadvantages . After all, it does not take into account extremely important processes:
- The value of money, which is constantly changing.
- Profit from the project, which will go to the company after passing the payback mark.
- Therefore, a more complex calculation method is often used.
Calculation of discounted payback period of investments in Excel
Take our proprietary course on choosing stocks on the stock market → training course
Let's consider an example of estimating the discounted payback period for a business plan. The initial investment amounted to 100,000 rubles, the cash flow changed monthly and is reflected in column “C”. The discount rate was taken equal to 10%. To calculate discounted cash flow, we use the following formula:
Discounted cash flow =C7/(1+$C$3)^A7
Cumulative cash receipts =E7+D8
An example of calculating the discounted payback period of an investment in Excel
The project will pay off for the 5th month, in which cash receipts will amount to 100,860 rubles.
To help students and graduate students
Calculating net present value NPV, also called NPV, is simple but labor-intensive if done manually.
We have already looked at an example of calculating NPV and IRR using formulas. The formulas for all the listed indicators and their manual calculations were also given there.
Now let's talk about how to calculate NPV, IRR (IRR), simple and discounted payback period without much effort using Ms Excel . So, you can write formulas in a table in Excel to calculate NPV. That's what we'll do.
Here you can download a free Excel spreadsheet for calculating NPV, internal rate of return (IRR), simple and discounted payback periods. We will provide a table for calculating NPV for 25 years or less; you just need to insert into the table the values of the expected investment size, the discount rate and the amount of annual cash flows. And NPV will be calculated automatically.
Here is this table. File password: goodstudents.ru
The task of calculating the main performance indicators of an investment project using Excel tables is often asked by teachers. In these situations, or when you want to quickly calculate the indicator values you need, you can use the calculation template in the table below.
Now let's talk about how to use this table to calculate NPV, IRR, and payback period . It already provides an example of calculating NPV.
Example
If you need to calculate NPV for 5 years. You know the discount rate is 30% (i.e. 0.3). Cash flows by year are known:
The investment amount is 500 rubles.
In the Excel table, correct the value of the discount rate to 0.3 (2nd row from the top), correct the value of investments (5th row, 3rd column) to 500.
Let's erase cash flows and their total for 25 years. (we will also erase the lines of net cash flows from the 6th to the 25th year and the NPV value for the extra years). Let's insert the values we know for 5 years. We get the following data.
Years
Investment amount, thousand rubles
Cash flows, thousand rubles (CF)
Net cash flows, thousand rubles.
Net discounted income, thousand rubles. (NPV)
Total
500,00
1350,00
562,09
62,09
As you can see, we did not have to calculate NPV ourselves; the Excel spreadsheet calculated this indicator for us.
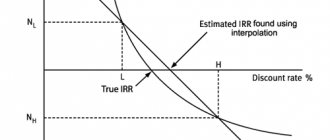
Now let's figure out how to calculate IRR using Excel using a specific example. Ms Excel has a function called “parameter selection”. In Excel 2003, this function is located in Service->Parameter Selection.
We said earlier that IRR is the discount rate at which NPV equals zero.
In Excel, click service-> select parameter, a window opens,
We know that NPV = 0, select the value of the cell with NPV for the 5th year, assign it the value 0, changing the value of the cell in which the discount rate is located. After calculation we get.
So, NPV is zero at a discount rate of 35.02%. Those. IRR internal rate of return (IRR) =35.02%.
Now let’s calculate the value of the simple and discounted payback period using this Excel table.
The payback period is simple:
We see from the table that our investment is 500 rubles. In 2 years we will receive an income of 300 rubles. In 3 years we will receive 600 tr. This means that the payback period will be more than 2 and less than 3 years.
In cell F32 (line 32 of the Excel file) press F2 and correct, instead of “1+” we will have “2+”, change 1 to 2, and transform the formula as follows, instead of “ =1+(-(D5-C5) /D6)” we will have “=2+(-((D5+D6)-C5)/D7)”, in other words, we added the investment debt at the end of the second year to the 2nd full year, divided by the cash flow for the third year. We get 2.66 years.
Payback period discounted calculation example:
NPV changes from minus to plus from the 4th to the 5th year, which means the payback period, taking into account discounting, will be more than 4 and less than 5 years.
In cell F3 3 (line 33 of the Excel file) press F2 and correct, instead of “2+” we will have “4+”, change 2 to 4, and transform the formula as follows, instead of “=2+(-F6/E7) "we will have "=4+(-F8/E9))", in other words, we have added the ratio of the last negative NPV to the net cash flow in the next year to four full years ( 4+-( -45.64 / 107.73 ) .
We get 4.42 years - the payback period taking into account the discount.
Therefore, if you need to calculate indicators using formulas, you can look at the examples at the link given above, and here we dwell in detail on the calculations of NPV, discounted cash flows, IRR, payback periods using Excel tables, which is much simpler and more efficient.
This example is intended for practical training. Ph.D., Associate Professor E.V. Odintsova
#3 Payback period of investments taking into account liquidation value
The payback period taking into account the liquidation value (English: Bail-Out Payback Period) is the period for the return of funds taking into account the residual value of the assets created in the investment project. When implementing an investment project, assets may be created that can be sold (liquidated), as a result of which the payback period of the project is significantly reduced.
Where:
IC (Invest Capital) – initial investment costs in the project;
RV (Residual Value) – liquidation value of project assets;
CFi (Cash Flow) is the cash flow from the project in the i-th period of time, which is the sum of net profit and depreciation.
The liquidation value may either increase as a result of the creation of new assets, or decrease due to depreciation.
Take our proprietary course on choosing stocks on the stock market → training course
Content
To understand what the payback period is, you need to understand for which areas of business activity this definition is suitable.
For investment
In this context, the payback period is the period of time after which the income from the project becomes equal to the amount of money invested. That is, the payback period coefficient when investing in any business will show how long it will take to return the invested capital.
Often this indicator is a selection criterion for a person who plans to invest in any enterprise. Accordingly, the lower the indicator, the more attractive the business. And in the case when the coefficient is too large, then the first thought will be in favor of choosing another business.
For capital investments
Here we are talking about the possibility of modernizing or reconstructing production processes. When making capital investments, the period of time during which the savings or additional profit obtained from modernization becomes equal to the amount of money spent on this modernization becomes important.
Accordingly, they look at the payback period coefficient when they want to understand whether it makes sense to spend money on modernization.
For equipment
The coefficient will show how long it will take for a particular device, machine, mechanism (and so on) on which money is spent to pay for itself. Accordingly, the payback of equipment is expressed in the income that the company receives from this equipment.
Briefly speaking
—
A financial model is a system of indicators that will help predict revenue, cash flow, business profit, and also calculate how changes within the company or in the market will affect the financial position in the future.
—
The model helps business owners control the development of the company, and lenders make decisions on issuing loans. It demonstrates how the business will grow and how the organization will repay the debt.
How to calculate in a simple way
The formula used to calculate the payback period in a simple way looks like this:
PAYBACK PERIOD = INVESTMENT SIZE / NET ANNUAL PROFIT
We take into account that PP is the payback period expressed in years.
K0 - the amount of invested funds.
PChsg - Net profit on average for the year.
Example.
You are offered to invest an amount of 150 thousand rubles in the project. And they say that the project will bring in an average of 50 thousand rubles a year in net profit.
Using simple calculations, we obtain a payback period of three years (we divided 150,000 by 50,000).
But such an example gives out information without taking into account that the project can not only generate income during these three years, but also require additional investments. Therefore, it is better to use the second formula, where we need to obtain the value of IFsg. And it can be calculated by subtracting the average expense for the year from the average income. Let's look at this using the second example.
Example 2:
Let us add the following fact to the existing conditions. During the implementation of the project, about 20 thousand rubles will be spent every year on all kinds of expenses. That is, we can already obtain the value of PChsg - by subtracting 20 thousand rubles (expenses for the year) from 50 thousand rubles (net profit for the year).
So, our formula will look like this:
PP (payback period) = 150,000 (investment) / 30 (average annual net profit). Result - 5 years.
An example is illustrative. After all, as soon as we took into account the average annual costs, we saw that the payback period increased by as much as two years (and this is much closer to reality).
This calculation is relevant if you have the same income for all periods. But in life, the amount of income almost always changes from one year to the next. And to take this fact into account, you need to perform several steps:
We find the whole number of years it will take for the final income to be as close as possible to the amount of funds spent on the project (invested).
We find the amount of investments that remained uncovered by profit (we take it as a fact that income arrives evenly throughout the year).
We find the number of months it will take to reach full payback.
Let's consider this option further.
Example 3.
The conditions are similar. You need to invest 150 thousand rubles in the project. It is planned that during the first year the income will be 30 thousand rubles. During the second - 50 thousand. During the third - 40 thousand rubles. And in the fourth - 60 thousand.
Calculation formula for the dynamic method
As we have already written, this method is more complicated, because it also takes into account the fact that funds change in value during the payback period.
In order for this factor to be taken into account, an additional value is introduced - the discount rate.
Let's take the conditions where:
Kd — discount factor
d—interest rate
Then kd = 1/(1+d)^nd
Discounted term = SUM net cash flow / (1+d) ^ nd
To understand this formula, which is an order of magnitude more complex than the previous ones, let’s look at another example. The conditions for the example will be the same, to make it clearer. And the discount rate will be 10% (in reality it is approximately this).
First of all, we calculate the discount factor, that is, discounted income for each year.
- 1 year: 30,000 / (1+0.1) ^ 1 = 27,272.72 rubles.
- Year 2: 50,000 / (1+0.1) ^ 2= 41,322.31 rubles.
- Year 3: 40,000 / (1+0.1) ^ 3 = 30,052.39 rubles.
- Year 4: 60,000 / (1+0.1) ^ 4 = 40,980.80 rubles.
Let's add up the results. And it turns out that in the first three years the profit will be 139,628.22 rubles.
We see that even this amount is not enough to cover our investments. That is, taking into account the change in the value of money, even in 4 years we will not recapture this project. But let's bring the calculation to the end. In the fifth year of the project’s existence, we had no profit from the project, so let’s designate it, for example, as equal to the fourth year - 60,000 rubles.
- Year 5: 60,000 / (1+0.1) ^ 5 = 37,255.27 rubles.
If we add it up with our previous result, we get an amount for five years equal to 176,883.49. This amount already exceeds the investments we made at the start. This means that the payback period will be between the fourth and fifth years of the project’s existence.
Let's start calculating the specific period and find out the fractional part. From the amount invested, subtract the amount for 4 whole years: 150,000 - 139,628.22 = 10,371.78 rubles.
We divide the result obtained by discounted revenues for the 5th year:
13 371,78 / 37 255,27 = 0,27
This means that we are 0.27 short of the fifth year before the full payback period. And the entire payback period with the dynamic calculation method will be 4.27 years.
As stated above, the payback period with the discounted method differs greatly from the same calculation, but in a simple way. But at the same time, it more truthfully reflects the real result that you will get under the indicated numbers and conditions.
The payback period is one of the most important indicators for an entrepreneur who plans to invest his own funds and chooses from a number of possible projects. At the same time, it is up to the investor to decide exactly how to make the calculations. In this article, we analyzed two main solutions and looked at examples of how the numbers will change in the same situation, but with different levels of indicators.