It is simply impossible to conduct effective investment activities without a special business plan in which all the nuances are thought out. At the initial stage, an assessment of probable losses and all potential risks should be made. Expert samples in the topic of sensitivity analysis for a project are a clear illustration of how even minor fluctuations affect the overall efficiency of a company.
Why is a project sensitivity analysis needed?
One of the most common methods of risk assessment is project sensitivity analysis.
The fact is that investment analysis and business planning are forecasting methods. They, unlike accounting data, which reflects a retrospective, are built for the future.
When drawing up an investment project, all initial data are predicted. That is, forecast values are determined: sales volumes, fixed and variable costs, etc. The initial result of the project’s effectiveness (discounted and undiscounted indicators) depends on how accurately these values are determined.
In this regard, even before the start of investment activities, it is necessary to understand as accurately as possible what will happen to the project if for some reason, for example, the level of variable costs changes.
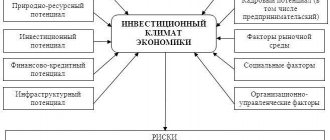
Thus, sensitivity analysis consists of assessing the impact of changes in the initial parameters of the project on its final characteristics, which are usually used as the internal rate of return or NPV.
Risk is a situation of uncertainty of the consequences of decision-making, which can lead to various alternative results, the probability of which can be determined quantitatively or qualitatively.
Principles of performance assessment
A comprehensive analysis of investment projects should include all aspects that affect the chosen type of activity. When making calculations, you must follow the following principles:
- Conduct activity analysis throughout the entire life cycle and implementation of the project, assessing the feasibility of investments.
- Monitor and evaluate cash flows throughout the project.
- Compare the attractiveness of the project with others.
- Follow the principle of maximum effect.
- Take into account the time factor.
- Take into account only future costs and income.
- Evaluate and seek ways to address the most important impacts of the project.
- Consider the presence of other investors.
- Use a systematic approach and comprehensive analysis of investment projects.
- It is imperative to take into account the state of the country’s economy and predict the analysis of investment projects in conditions of inflation.
- Take into account all possible losses and include in the calculation an analysis of investment projects under risk conditions.
Analysis algorithm
To carry out the analysis, the following steps must be completed:
- identification of the most significant potential risk situations from the perspective of a specific project.
- formation of a complete list of factors for analysis . At this stage, the final selection of factors for analysis occurs. For example, factors may include price, volume, costs, investment size, etc. However, one must understand that the factors can be more detailed. For example, you can analyze not just the impact of changes in average variable costs on the NPV of a project, but analyze the impact of only their part - workers’ wages, etc.
- conducting sensitivity analysis;
- for factors that have the maximum impact on project efficiency, conducting a detailed sensitivity analysis;
- development of a set of measures aimed at reducing the likelihood of an unfavorable situation;
- At the production stage of the investment project, an analysis of the effectiveness of the proposed set of measures should be carried out. The analysis should determine the effectiveness of the proposed set of measures.
Example of a project sensitivity analysis
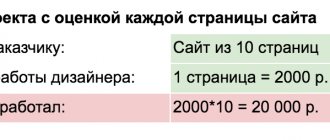
Assess the sensitivity of the project to changes in: a) price levels; b) the level of average variable costs; c) changes in the level of total fixed costs. If the one-time initial investment for the project amounted to 800,000 rubles. The calculation horizon is 3 years. The expected performance indicators of the travel agency do not change over the years and are: sales volume of the travel agency - 145 vouchers with an average bill of 25,000 rubles; variable costs per unit of production – 14,200 rubles; total fixed costs for the year – 1,024,000 thousand rubles. Discount rate 15%.
1. First, you need to determine the NPV value without taking into account the influence of factors:
rub.
2. Next, you need to determine what the net present value will be if, for example, the price increases by 20%. All other factors remain unchanged.
Price (+20%) = RUR.
rub.
3. NPV values are calculated similarly for other factor deviations. For example, if the price changes by -20%, -10%, +10%, +20%.
4. Next, the influence of other factors on NPV is determined in a similar way.
a) sensitivity to changes in price
The table shows that with an increase in price of only 20%, the net present value of the project increases by 378%. Similarly, a 20% decrease in price causes a 378% drop in NPV. Thus, the project is very sensitive to price changes. And the investor needs to pay great attention to this problem.
b) sensitivity to changes in the level of average variable costs
c) sensitivity to changes in the level of total fixed costs
Conclusion: Based on the calculations, it is clear that the project is most sensitive to changes in the price level (average bill), and the least sensitive to changes in total fixed costs.
Methods for assessing effectiveness
To conduct a comprehensive analysis of investment projects, it is necessary to evaluate all aspects of the project. The use of various methods allows for the most complete research, including most criteria and indicators. The social, environmental and technical components are more predictable and obvious for both sides of the investment activity. The calculation of the economic part is the most complex and important, so we will focus on it.
Methods for analyzing investment projects are divided into two groups: dynamic and static. In some ways, their results and the variables used are intertwined, but differences still exist. In the static version, the time factor is not taken into account and the results are more theoretical. When evaluating a future project, it is necessary to conduct both types of research.
Static methods
They are characterized by ease of calculation, which explains their widespread use for obtaining a preliminary estimate. The most understandable and visual indicators are used here. However, the results obtained by the static method should be regarded only as auxiliary.
A widely used static analysis method metric is return on investment. It is needed to understand over what period of time the investor will be able to receive a net profit that will cover the invested funds. It is calculated in two ways:
- General formula. The payback period (PP) is equal to the minimum time at which the following equality will be satisfied:
- Simplified formula. When profit flows are regular and the slightest changes can be neglected, the formula looks like this:
Here Io expresses the amount of initial investment, and CFcr is the net income for the month or year, expressed as an average. PP can also be calculated in months or years, depending on the long-term duration of the project.
For ease of understanding, this formula can be explained as follows: the time after which the profit received will be equal to the initial investment amount is calculated.
The general method should be used for businesses with unstable or variable returns, such as seasonal activities.
Many investors pay attention to the return on investment (ARR), which shows the ratio of the average net profit for a month or year to the amount of the initial investment. Profitability can be calculated using the following formula:
The disadvantage of such calculations is the lack of consideration of the time factor. In reality, the value of money changes over the years, so it is simply necessary to analyze investment projects in conditions of inflation, taking into account its significance.
The payback calculation formula limits the investor in advance to a given calculation period. All changes outside this period are not taken into account, which is also a disadvantage. That is why static methods for analyzing investment projects are considered auxiliary and make it possible to understand the whole picture. More important are the results of dynamic calculations.
Dynamic Methods
The most important indicators of investment activity are determined here. Among the main ones are the following:
- NPV is the present net value of investments. Determines the income received by a certain date. Investments are taken into account if they were carried out in several stages. The connection between a specific date and cash flows is carried out using the discount rate. Maximizing the present net value of investments is the main task of all project participants. If the NPV approaches zero, the investor will not consider such a project.
- PI – return on investment index. Shows the profitability of a unit of investment, expressed as a percentage. Of several projects with an equal NPV value, the investor will give preference to the one that shows a higher profitability index. Naturally, only those options are considered where the index indicator is a positive value.
- IRR – internal rate of return of the project. Allows you to determine the minimum return value that is acceptable for participants in investment activities. A value of the norm is selected such that cash flows and outflows will be equal.
- DPP – discounted payback period. Similar to the payback period of static research methods, but takes into account the time factor. In practice, the discounted payback period will always be longer than the usual PP period.
It is these criteria that can fully describe the effectiveness and feasibility of investing in the chosen activity.
Project sensitivity chart
Based on the data from the previous example, we will conduct a graphical analysis of the sensitivity of the NPV of the project to changes in factors.
Graph of NPV sensitivity to deviations of influencing factors
The graph shows that the project is most sensitive to price changes. If the price decreases by only 5%, the project goes into the negative area, that is, NPV < 0 .
The next most sensitive factor in this example is average variable costs. If they increase by 10%, the investment project becomes unprofitable.