Lazy Investor Blog > Stock Exchange
We have already noted more than once that the ruble is one of the most undervalued currencies in the world. Judging by a number of signs, the same can be said about the Russian stock market. The shares of our companies are unique in that they are both cheap and have a high dividend yield. But is there some kind of trap hiding here? Let's figure out why Russian shares are considered undervalued, but at the same time not very prone to growth. What factors underlie this situation, and should they be neglected?
What does volatility mean?
Stock volatility is a value that reflects the fluctuation in the price of an asset over a certain time interval. The most volatile securities during the day can show price changes of up to several hundred percent. Developed markets typically report a moderate rate of less than 30%. With a share price of less than $1, price fluctuations are not always noticeable. For this reason, attention is paid to its percentage equivalent. For a clear understanding of the concept of volatility, as one of the main criteria for assessing the value of a stock, a practical situation is presented.
Example.
Let's take two shares A and B. Over 12 periods, they bring the same profitability - an increase in the range from 100 to 210 rubles. But asset B is characterized by a strong fluctuation amplitude within the time interval, which theoretically provides an opportunity for speculators to earn good profits. At the same time, with long-term investing, high volatility becomes a negative factor, because a significant drawdown of the stock pushes its holder to close the transaction.
Introduction to shares (equity securities)
Shares (from the English “stock”) are equity securities that give the right to own a portion determined in proportion to the number owned to the total issue.
For most people, the stock exchange is a “quote game”: buy low, sell high. But this is not the approach of investors, but of speculators. For real investors, the word “share” does not mean the quoted price, but primarily a share in the business. If you treat this as an investment, then there is no need to constantly monitor quotes. They can rise or fall at the moment, but the share in the company remains unchanged.
- Shares - what are they and why accumulate them;
- Shareholders - who they are and how to become one;
- Minority and majority shareholders;
- How to become an investor from scratch;
- Preferred and ordinary shares;
If you just buy shares and do nothing, then most likely you will earn quite a bit. But this takes time. If you actively trade, then success depends only on the trader himself. Which approach to choose is up to everyone to decide for themselves.
Young people often choose active trading, while more mature ones choose quiet investing. But in fact, the “average” approach will give the best results. This is a medium-term investment with profit taking and further purchase at cheap prices. But to make such precise movements you need to be a professional with strong nerves.
- Trading vs investing - what to choose;
- Is it possible to live on earnings from trading?
- The truth about trading;
- Trading psychology - what you should understand;
Reasons for volatility
In practice, the volatility indicator increases when an important event occurs that affects the entire market, industry or individual financial instrument.
Table of the relationship between individual events and market dynamics.
| Event | Object of influence | Reason for influence |
Geopolitical events:
| Indices and gold | Investors are wary of the increasing scale of the geopolitical event and are getting rid of shares, shifting capital into gold |
| Oil reserves statistics - OPEC+ deal | Oil and assets of airline and oil companies | Changes in the cost of jet fuel affect the costs of air carriers |
| GDP Statistics | Indices and shares | GDP growth stimulates the development of business, services and other areas |
The Central Bank's decision regarding the interest rate:
| Exchange rates, securities of financial and insurance structures | The interest rate is reflected in the cost of funds in the economy |
Significant statements by politicians and terrorist attacks cannot be predicted, which causes increased volatility in the stock market. The release of economic statistics and enterprise reports is carried out in accordance with the schedule.
An example of a calendar of statistics and corporate events posted by many brokers, according to Moscow Exchange.
Agencies collect analysts' forecasts several days before the publication of official data. If the indicators match the actual numbers, the markets do not react to the information posted. But when expectations and reality differ, an imbalance occurs and the price rapidly rises or falls. At the same time, volatility increases.
How to buy shares for an ordinary investor
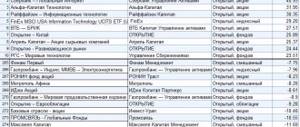
The best way to buy shares is through stock brokers. I recommend the following companies that have been providing brokerage services in our market since its inception (I work through them myself):
- Finam (promotion: Free Trade tariff, trading without commission forever)
- BCS Broker
They have the lowest commissions for trading turnover. Free deposits and withdrawals. They provide access to the full range of financial assets traded on the stock exchange:
- Bonds;
- ETF funds;
- Futures;
- Options;
After completing online registration, you can open and fund your brokerage account with any amount. There are no restrictions on the starting amount.
Brokers will provide access to trading terminals where you can purchase shares. If this is difficult for you, then you can leave requests for the purchase of shares by phone.
A step-by-step guide with screenshots can be found in the articles:
- How to start trading on the stock exchange - a detailed guide
- How to buy Sberbank shares - instructions with screenshots
- How to buy Gazprom shares - instructions with screenshots
- How to become an owner of foreign shares
- Investing in securities - a detailed overview
Volatility indicators
A volatility indicator is a financial tool that helps an investor visually assess the amplitude of share price fluctuations over a certain period of time. He is involved in forecasting future market movements and identifying the current trend. Volatility is assessed using many indicators, but traditional financial instruments are the most effective.
ATR
The structure of this index allows you to determine the average range of price movements, taking into account gaps between sessions. ATR is limited to establishing the volatility value and does not indicate the presence or absence of a trend.
Calculation formula:
ATR = (average TR (n-1) periods + current TR / n)
Where,
ATR is an average calculated based on the actual price range;
TR - true range.
The ATR index is used for various time intervals, but was originally created exclusively for daily charts. The most popular parameter for calculating ATR is 14 periods.
ATR index using APPLE as an example.
ADX
ADX determines the trend value based on the high and low prices for a certain time interval, for example 14:
- crossing levels from 20 to 25 indicates an upward or downward trend;
- a value less than 20 reflects that the market is in a consolidation phase.
During the period of index growth, the trend remains strong, but after it turns downward, it begins to weaken. ADX, like most indicators, is a lagging indicator. That is, the signal about the beginning and end of a trend arrives with a slight delay. For this reason, when using technical indicators in practice, it is important to remember the possible risks.
ADX index using APPLE as an example.
Bollinger Bands
Compared to ATR and ADX, this indicator is able to determine the volatility and movement of the stock market. An increase in the volatility indicator causes the bands to expand; a fall causes them to narrow. The value provides an opportunity to clearly see the position of the sideways market, called flat.
Flat is a market condition in which the value of an asset moves in a certain range without a clearly defined direction.
When the market movement changes from sideways to an upward or downward trend, the bands also change direction. The close location of the price to the bands indicates a strong trend, and its movement from one band to another reflects an approaching trend change. Bollinger Bands are a good indicator of volatility and trend, but like other tools, they lag behind actual market prices and show the beginning and end of changes with a delay.
Bollinger Bands Index using APPLE as an example.
Types of trends
Trends in the market can be classified according to two criteria:
- by direction
- by duration
There are 3 types of trends.
Upward or bullish trend. On a quote chart, each subsequent high and low (peak and bottom) is higher than the previous high and low.
Downward or bullish trend. We get a completely opposite picture. On the chart we have a group of decreasing highs and lows, where each subsequent one is lower than the previous one.
Sideways tendency or flat (or as it is also called - flute). This is the absence of a specific movement in any direction. We can say that prices are marking time in a certain price range (price corridor). As a rule, after exiting it there is a very strong movement towards the breakdown. A flat occurs when the market is uncertain. When none of the players has the desire (or reason) to enter a position. The longer the sideways move lasts, the greater the movement potential it accumulates in the event of leaving the corridor.
Margin, Leverage and Stock or Forex Trading
Advantages in favor of Forex trading versus stock trading include the leverage offered by Forex brokers.
- If you trade stocks physically, you are likely trading without the benefit of leverage.
- If you trade shares using CFDs (Contracts for Difference), you can trade using margin.
Generally, the best leverage offered is 1:10.
It is not uncommon for FX brokers to offer leverage of 1:50, while Admiral Markets offers leverage of up to 1:500.
This makes it possible to manage a larger position with less funds in the account. Of course, it's important to know how big your underlying position really is and to fully understand the risks involved.
Leverage can be a powerful tool, but it can also cause you to lose a large portion of your deposit.
Stock market or Forex, which is better and what to focus on?
Perhaps the key difference when it comes to the Forex vs stocks question is the scale of the trader's focus.
When you look at an individual stock, you can focus on a fairly narrow set of variables.
Although you'll likely look at broader trends, factors directly affecting the company in question will be more important, along with market forces in its particular sector.
Relatively narrow metrics such as a company's debt level, cash flow, earnings guidance, etc. will be important.
These indicators will also be important:
- Company debt level
- Cash flows
- Revenue management.
In Forex, the focus is broader. Currency reflects the overall performance of the entire economy.
Therefore, FX traders are interested in macroeconomics.
The focus will be on broad indicators such as unemployment, inflation and GDP, rather than on private sector productivity.
When you trade a currency pair, you are necessarily trading two currencies at once. You will always buy one currency while selling the other currency in the pair.