Many players in the Forex market have tried and are trying to find a win-win trading system. But for those who are familiar with game theory, it is obvious that there are no absolutely win-win options for working in financial markets. You can only try to reduce risks on the one hand, and on the other hand, increase the amount of winnings or the percentage of profitable transactions. From the postulates of the same game theory it follows that these tasks are in inverse proportion to each other. If you do not enter the market, then the cost of your trade is zero, but the risk is zero. If you enter the market very often, then your winnings may be very large, but the likelihood of losing also increases.
Where is the golden mean that can allow you to achieve harmony between reasonable risk and sufficient winnings? Many solutions have been proposed in this regard. And one of them is trading using the Ichimoku Kinko Hyo indicator.
How to use the Ichimoku indicator in Forex
Many of you probably know about the existence of Ichimoku, but only a few use it in their trading systems. Meanwhile, it is included in many different programs for analyzing financial markets and MetaTrader 4 / Metatrader 5 is no exception. But despite this, there is quite a bit of information on its use in both Russian and English. Therefore, today we will take a closer look at this wonderful indicator.
Ichimoku was developed by Japanese analyst Hosoda, better known by his pseudonym Sanjin Ichimoku, to analyze stock markets in the 1930s. Later it began to be used in the Forex market. The indicator is designed to determine the market trend, support and resistance levels, and generate buy and sell signals. It works best on weekly and daily charts.
The most interesting thing from the history of creation
The past is important and sometimes interesting. Briefly about the main thing:
- The Ichimoku indicator was developed by the Japanese journalist-analyst Goichi Hosoda back in 1930, with the aim of analyzing the Nikkei index;
- The world learned about the Ichimoku indicator only in 1968. It got its name from the author’s pseudonym – Ichimoku Sanjin;
- The original name sounds like Ichimoku Kinko Hyo, or “graphic balance at first sight,” which may not be the most accurate, but the most understandable translation.
Goichi Hosoda - author of the Ichimoku indicator - Ichimoku Kinko Hyo
Ichimoku was created by Japanese journalist Goichi Hosoda. Goichi was incredibly talented and at the same time very quiet and calm. He spent most of his time compiling reports on trading in the Japanese rice market. He understood how price moves on a chart and how it reacts to certain situations. After some time, he discovered that the price of rice moved according to certain rules, which we now call support and resistance levels. Goichi's goal was to create an "all information in one" indicator that would allow for more accurate chart analysis and less time spent on it.
Clear, human description of the indicator
After applying the indicator to the chart, you may completely lose sight of the price candles or bars. To avoid confusion, let's break the tool down into individual elements. It consists of:
- Conversion and baseline - similar to moving averages, but have some differences;
- Ichimoku cloud or Ichimoku cloud is similar to the MACD and is the most popular aspect of the instrument, with Japanese echoes in the name.
Now let’s look at the description of the individual elements of the Ichimoku Kinko Hayo indicator.
Conversion and baseline lines
Like a moving average, they follow a trend and indicate its direction. But they are built interestingly:
- Conversion line or Tenkan-sen / Tenkan-sen – the last 9 candles of the chart are taken, the maximum and minimum of this period are determined, and the Tenkan line is built in the middle;
- Base line or Kijun-sen / Kijun-sen - the principle is the same, but the period is taken to be 26 candles.
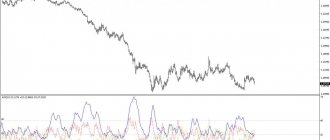
In the example below, the green and red lines represent the tenkan and kijun, respectively, and the gray line represents the 9-period simple moving average, which is very close to the conversion line, but does not coincide 100% with it.
What is their meaning:
- Tenkan is the fastest line and indicates the direction of the trend. The steeper it is, the more pronounced the trend;
- Kijun is considered support when the price is above it and resistance when it is below it. In other words, this line demarcates bulls and bears.
What is the Ichimoku cloud
Ichimoku cloud on the chart looks like a shaded field between two lines. What’s interesting is that it is similar to MACD, both in function and purpose, only it is built on the chart itself.
What does the cloud consist of:
- Senkou Span A or Senkou Span A - average between tenkan and kijun;
- Senkou Span B or Senkou Span B is the average value between the high and low over a period of 52 candles.
- Cloud Ichimoku or Kumo is the space between these lines and, as a rule, it is either colored or shaded.
Senkou Span lines A and B are calculated similarly to the previous two, but have their own period: 17 and 52.
INTERESTING: the period of 52 candles was not chosen for Senkou B by chance. Ichimoku analyzed weekly charts, and 52 weeks is 1 year.
IMPORTANT: the Ichimoku cloud has been shifted forward by 26 periods to correct for lag!
As already mentioned, the cloud, as an indicator, resembles the MACD. What does this analogy look like:
- When the fast line crosses the slow one from bottom to top, we are observing an upward trend. The Ichimoku cloud is green and the MACD line is below zero.
- We observe the opposite situation if the fast line crosses the slow one from top to bottom.
- The greater the distance between the lines, the faster the price movement, that is, the stronger the impulse. The cloud area increases and the MACD moves away from zero.
TIP: When price enters the cloud, it is considered a time of calm or uncertainty. Price in flat.
Ichimoku Cloud - what does it mean?
The distance from Senkou Spen "A" to Senkou Spen "B" forms the shaded Ichimoku cloud. If Senkou Spen “A” is located above Senkou Spen “B”, then the cloud is colored green, otherwise – red.
These colors show the current market situation. Naturally, “green” means growth, red “fall.” Very similar to the MACD indicator.
If the price enters the Ichimoku cloud, it means that one of the following options is happening on the market:
- Correction;
- Trend reversal;
- Flat;
The price in the cloud can remain for a relatively long time and at this moment there is no single trend in the market. During such periods, it is recommended to refrain from trading, or to apply strategies to work from levels.
Settings and recommended options
The Ichimoku indicator is primarily a trend indicator , despite the fact that its cloud is shifted 26 periods into the future. This means that he:
- Will work well in a trending market;
- And bad in flat. Although we remember that there is some sideband filter in the form of a cloud.
Now let's look at where this indicator can be used:
- Originally developed for the Nikkei index. But, it can be used for the stock market, Forex currency market, futures;
- Higher timeframes are recommended: daily, weekly chart. But, it is also actively used on intraday time frames: h4, h1, m15, m10, m5, and even m1;
- Recommended settings for the Ichimoku indicator are 9 – 26 – 52. These parameters are suitable for higher timeframes. For an hourly - minute chart, it is recommended - 8 - 24 - 48.
Selecting the Ichimoku timeframe
Ichimoku is a trend indicator, so in order to receive the most reliable signals, a large time frame must be selected. I recommend working with four hourly (h4) and daily charts (d1).
Many traders do the following: they determine the direction of the market over long periods, and look for more accurate entries (m30, h1) over small periods. This is a good approach that allows you to kill two birds with one stone: entering potentially large movements with a good entry point.
On large timeframes, signals will appear quite rarely. Only 5-10 transactions per year (or even less).
Signals and how to use them
There are a lot of signals in the Ichimoku indicator and a detailed description of each does not make sense. It's just that not all of them are significant. But, they can be placed in the following groups:
- Signals of indicator lines crossing each other;
- Signals of price intersection with lines;
- And the so-called three-line signal , when from top to bottom, in a clear sequence, there are: price, Tenkan, Kijun and Kumo. It signals a strong trending market.
As you can see, if you look at every intersection of lines and prices, you can easily get lost. But, several of the most important and strong signals need to be highlighted:
- Golden cross is a bullish signal when Tenkan and Kijun cross upward;
- Dead cross – a bearish signal when Tenkan and Kijun cross downwards;
- The price crosses the upper boundary of the cloud upward or the lower boundary downward.
Rules for working with the indicator
Since Ichimoku is not just one indicator, but a whole set of tools, beginners will need some time to learn the features of using this trading system. On the other hand, it has several advantages. Ichimoku clearly shows the development of a trend and is a full-fledged trading strategy, and not an auxiliary indicator. It can be used for different trading methods - both on small and large time frames.
How to set periods
The periods of the 3 Ichimoku lines are of great importance:
- Senkou Span B – in the classic version, 52, since there are 52 weeks in a year.
- Kijun-Sen – 26 (a correction or rollback in the market is often half a wave).
- Tenkan-Sen – 9: This number was obtained empirically based on years of calculations by the discoverer Goichi Hosoda. The parameter reflects short-term price movements, so it can be used to assume the formation of a local trend and a correction in the price of the cryptocurrency.
The classic “9-26-52” option is mainly used in weekly forecasts, when traders analyze higher time frames D1, W1 and M1, i.e. daily, weekly and monthly. However, such trading strategies are not suitable for all users. Therefore, it is allowed to use Ichimoku with other periods:
- “2-24-120”: used on small intervals from M1 to M. Suitable for scalping strategies, i.e. making small profits due to a large number of market entries during the day (on small trends and rollbacks).
- “24-60-120”: applicable on M30 and H timeframes These are slower cycles that allow for multiple entries per week. There are days when it is impossible to open a position, so you should either wait for the next trading session or move on to lower time frames.
- “120-240-480”: used on the H1 and H intervals. These are medium-term strategies (both intraday and for several days in a row).
Beginners are recommended to start with the classic combination “9-26-52”, and then adjust the values to suit their strategy. First, she must undergo mandatory testing on a demo account for at least 1-2 months.
Signals for entry
Ichimoku gives quite a lot of entry signals because it combines several different strategies. For example, one of the classic options is the interaction of 3 main lines - red, blue and green:
- Signal to buy BUY: The cryptocurrency chart is located above the lines. Immediately below it is the red level, then the blue level. The green one crosses the chart from bottom to top.
- Sell signal SELL: the green line has crossed the chart from top to bottom, the red line is located above the candles, followed by the blue line above it.
Ichimoku also gives other signals, which are discussed below.
Stop-loss and Take-Profit
To set stop loss and take profit, you can apply the classic rules:
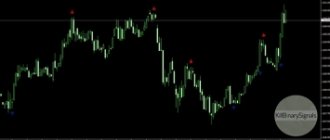
- The line for fixing possible losses (lower in the figure) is drawn along the nearest maximum or minimum immediately before the entry point.
- The line for fixing possible profits (top in the figure) is drawn along the nearest Ichimoku cloud - a zone of possible resistance.
The arrow shows the entry point
Ichimoku trading strategy
There are many tips on the Internet on how to trade the considered signals of the Ichimoku indicator, but they are “separated” from one another. But we have a full-fledged trading tool, where everything is very harmoniously connected.
I offer you 2 strategies on how to use the Ichimoku Kinko Hyo indicator.
Conditions for the first trading system:
- Long – the price is above the cloud, and Tenkan and Kijun have formed a golden cross;
- Short – the price is below the cloud, and Tenkan and Kijun have formed a dead cross.
In this strategy, we use the Ichimoku cloud indicator as a trend filter and trade after it.
Conditions for the second strategy:
- Long – the price crosses the cloud upward and closes above its upper line Senkou Span A.
- Short – the price crosses the cloud down and closes below its lower Senkou Span B line.
Where to set stop loss?
We sorted out the opening of the position. Now we need to set a loss threshold if the deal goes against us.
In this situation, you need to start from two points:
- We have trend strategies that do not “like” close stops;
- Trading on the Ichimoku does not proceed from the level, and we have nothing to “attach” our stop to.
Therefore, we need to set a stop loss using the following systems:
- In terms of volatility of a stock or currency pair – at least 2 ATR (if you want to find out more, read “Position size – taming volatility”);
- “Hide” behind the nearest support or resistance level. It shouldn't be too far away, but it shouldn't be too close either.
- Place clouds behind the Senkou lines.
I understand that the phrases “not too far, but not too close” do not sound accurate, to put it mildly. We focus on 2 ATR. This will allow the price to determine the direction of its movement, and will allow us to expect a decent risk/reward ratio.
Closing a position
You also need to be able to close a profitable transaction correctly in order to get a good risk-to-reward ratio. Let's look at a few options:
- When receiving a return signal - the most conservative method. For example, if a long position is opened according to the first strategy, then we close the deal if a dead cross has formed;
- Trailing stop – gradual movement of the stop behind the price. For the first trading system, you can move along the minimums/maximums of candles, and for the second, you can move along significant rollbacks. For more information about this, see the article “Move your stop loss, save your profit!”;
- According to the established risk/reward ratio - if your stop is 2 ATR, then set a take profit at a price of 6 ATR from the entry and go for a walk. This is for a 1:3 ratio.
How to install?
Today the indicator is available for trading on any platform - for example, in the MT4, MT5 terminal, live chart, etc. Adding it to the screen is quite simple. For example, for MT4 and MT5 terminals the instructions are as follows:
- Go to the "Insert" section on the top panel.
- Select "Indicators".
- Select "Trade".
- Find “Ishimoku Kinko Hyo” in the list.
As a result, the following graphics will appear. Similar colors are used here as in the indicator description. These are the default settings and can be changed at any time.
Traders who prefer to use a live chart can also install the Ichimoku indicator. To do this you need:
- Go on the website.
- Click on the indicator icon.
- Select "Ishimoku Cloud".
- As a result, the following picture will appear on the chart.
It is a little more convenient compared to displaying Ichimoku in the terminal. The fact is that here the clouds are marked in red (resistance zone) and green (support zone). Therefore, a trader can easily identify them and use them in his work as a main or additional tool.
The tool can be downloaded for free on almost all specialized websites. It is often called Ichimoku or Ichimoku Cloud - in fact, they are the same thing. The resulting file should be downloaded to your terminal and used to enter the market. The algorithm of actions is quite simple:
- .
- Save the resulting folder to your desktop.
- Open it and copy the file (usually it contains only 1 document in which the entire system is “packed”).
- Open your terminal and go to "File".
- Then go to the data directory and open the MQL4 or MQL5 folder (depending on the terminal version).
- In it select “Indicators”.
- Copy the resulting file there.
- Reload the program - that is, exit the terminal and then enter it again.
- Install the indicator on the cryptocurrency chart in exactly the same way as described above.
Sometimes the tool is used to develop trading advisors and robots. These are automated trading programs that can independently open and close positions. It is not recommended for beginners to use them - it is better to start analyzing the market on your own to see how the indicator works from the inside.
Note! On some sites you can download Ichimoku with alerts - these are special sound and graphic signals that are triggered when the price reaches the channel boundaries, the chart crosses the Ichimoku lines, etc. (depending on the settings). Such systems can be used as auxiliary tools for entry, since the final decision should always be made independently.
Ichimoku Cloud Baselines and Reversal Lines
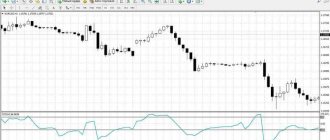
Another signal for a potential entry into the market is the intersection of Kijun-sen and Tenkan-sen . The signal for opening a position in Sell looks like this:
- The price chart is located below the lilac Ichimoku cloud.
- The reversal line crosses the base line, moving from top to bottom.
The signal to enter a long position is similar. The signal is considered quite strong and quite reliable, but with a strong trend it will rarely occur.
Some useful tips
- The thicker the cloud, the stronger the support and resistance levels. Once you see that the cloud is wide, you can assume that support and resistance are strong enough to withstand a breakout. When the cloud is thin, it may indicate that it can be easily penetrated.
- The greater the difference between the slow and fast lines, the higher the likelihood that the price will return to consolidation. Try to capture this movement! If the price has moved away from the slow or fast line, it is better to wait for a return and analyze the market before making a specific decision.
- The name of the indicator Ichimoku in Japanese means that we can understand the market situation at a glance. You should see the opportunity within a few seconds. If you have spent a lot of time analyzing the chart and still do not see an opportunity to enter a position, you should abandon the trade or find another instrument to find a better opportunity.
Ichimoku Settings (TradingView)
Click on “Indicators”.
Select “Ichimoku Cloud”.
Next, the indicator itself appears; double-click on any of its lines to open the settings of the indicator itself. Select “Arguments” and set new settings.
Great, we have figured out the mathematical component of this indicator and now let’s move on to reading, we will look at how to effectively use Ichimoku in technical analysis and what strategies exist when trading using this indicator.
Characteristics and history of the indicator
- Recommended broker for trading
- MetaTrader of any version, the indicator is present in the terminal by default
- any
- H1 and larger, the most suitable are H4 and D1
- any
History of appearance. This indicator was created by Japanese trader and analyst Goichi Hosoda back in the 1920s. His pseudonym was Sanjin Ichimoku (roughly translated from Japanese - “watchful from the mountains”), hence the name of the development and the concept of the indicator - to quickly determine at a glance the entire situation on the market without additional tools. Since the indicator externally forms a certain area on the chart, it is also called the “Ichimoku Cloud”. The author worked for a long time to improve his instrument, and in the 60s his works gained great popularity among traders already in the West.
Many traders today successfully build their strategies using this indicator. Initially, it may seem confusing or insufficiently clear to beginners, but once you understand the principles and nuances of the work, you will receive an excellent trading tool in your “piggy bank.”
Placement of stop loss and take profit using Ichimoku
The Ichimoku strategy also has unique methods for exiting a position and possibly closing it in case of protecting capital from large losses.
Stop Loss - Fast line, slow line and cloud can be potential support and resistance levels. If a support or resistance level is broken, the price may gain momentum that will direct it towards the next support or resistance. Therefore, you can set a stop loss on the other side of the cloud or on the other side of the slow or fast line. Once the price reaches our level you should exit your current position without hesitation. Also, when you are long, the stop loss may be slightly below the last trough, while in the case of a short position, the stop loss may be a few pips above the last peak.
Take profit - as an option, the position can be closed when a signal appears opposite to the one you entered. That is, if you are in purchases, then close the position when the line (Tenkan sen) breaks through the slow one (Kijun sen) from top to bottom.