olegas May 17, 2021 / 211 Views
Technical analysis indicators play a fairly important role in the work of a modern trader. The very purpose of indicators is to simplify as much as possible the analysis of the huge amount of information presented on price charts. Therefore, now it is hardly possible to find a trader who has not heard of such a concept as technical analysis indicators.
Thanks to the use of computers, the use of indicators has been simplified as much as possible for modern traders. In order to attach one or another of them to the chart of any financial instrument, just click a couple of buttons on the control panel of the trading terminal. The terminal will automatically calculate all parameters (according to the specified settings) and display a convenient and easy-to-read indicator chart.
A trader only needs to know how to correctly interpret the readings of a chart issued in this way in order to isolate from them reliable trading signals to buy or sell the financial instrument in question.
Below are the most popular (and therefore present in the tools of almost every trading terminal) existing indicators.
Indicators distract from what really matters
Previously, all my trading decisions were based on signals from a group of indicators. I didn't even look at the charts. It didn’t matter at all to me what exactly I was trading. That is, I relied on a set of lagging indicators to make the decision for me. I considered myself a trader and hoped to make a lot of money, but in reality I was just lazy.
Because of all these indicators, I practically did not pay attention to what phase the market is now and how far the price is from key levels. I just followed the signals because a few squiggly lines told me it was time to buy or sell.
My account balance gradually decreased. As a result, I lost my entire deposit. I had to radically reconsider my trading and completely abandon most indicators.
Do not misunderstand me. I don't want to say that indicators are bad or that they don't work. Even now, I sometimes use two moving averages to help me trade in a trending market.
However, I now firmly believe that relying solely on indicators without understanding price action is a big mistake. There is no better indicator than the price itself, which clearly shows the struggle between buyers and sellers in the current market situation.
Indicators are tied to specific market conditions
Undoubtedly, you have more than once encountered offers to buy a trading robot or advisor. Most often, their creators talk about a high percentage of profitable transactions.
However, the percentage of winning trades is not the only factor. It is also important to take into account the risk-to-reward ratio and the size of the stop loss. Because one losing trade can cancel out a series of profitable ones.
How do developers manage to achieve such beautiful yield curves that they post on Myfxbook? It's simple. They create an advisor that works great in certain market conditions. Trading looks great, but the robot is completely dependent on specific conditions. They also work well only on certain currency pairs, because it was on these pairs that they were set up and tested.
Perhaps the robot was adapted for trading in a range or on a trending market. But what happens when the market situation changes? Trade goes into drawdown. And you will have to look for a new advisor that would fit the current conditions.
Perhaps some of the advisors can be configured to work in different phases of the market, but the vast majority of them still show only losses in the long term.
The key factor here is the inability of robots to dynamically adapt to the current market situation. If they are designed to trade in a trending market, they will most likely start trading in the red when the market goes into consolidation. Even large hedge funds are not immune to this. They pay millions of dollars for developments in automated trading, and still sometimes suffer losses.
But you know what doesn't depend on market conditions? Price action. Simple but effective patterns such as the pin bar, inside bar or engulfing pattern have worked for decades and will continue to work for a very long time.
If you create a smart risk management strategy, price action trading will bring you consistent profits.
Of course, most of the time you will have to stay on the sidelines and not trade. But once you know exactly what you need to see on the chart, price action will work regardless of whether the market is trending or consolidating.
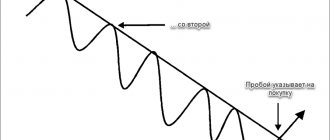
Chart patterns such as ascending and descending channels, double tops and head and shoulders have been around for ages.
Technical analysis methods (graphical and mathematical)
Methods for assessing market quotes can be divided depending on the object of study, for example, order book, volumes, analysis of classical patterns or candlestick iterations. To clear the mess out of my head, I’ll tell you about each specific method separately.
Classic technical analysis - graphical analysis
The method is based on the postulate of cyclicality of the stock market. To structure visual models, they began to be divided into price formations, or patterns. Each such formation in the stock market has its own formation rules. Of course, the amplitudes of price fluctuations are always different and do not repeat completely identically, however, the conditions for determining graphical models are quite clearly described.
The most common are “trading channels”, “head and shoulders”, “double top”, “flag”, “pennant”, “consolidation”, etc.
Psychology of the majority
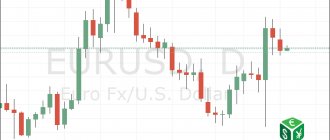
The psychology of the majority drives the price. Gather millions of people from all over the world, give them access to a computer and the ability to open trades to buy or sell. This is trading. Of course, making a profit from price movements is a completely different matter. It is we who must decide whether a given instrument will trade higher or lower. Essentially, all actions of market participants are reflected in the price movement on the chart.
What happens when the EURUSD currency pair approaches a level that has acted as resistance for the past six months? If it's an obvious level, it will likely attract a lot of traders. Each of them will see a given resistance level. You may not have marked it on your chart, but it's still there.
Key support and resistance levels are available to everyone. While individual indicators or combinations of indicators differ from one trader to another. How many indicators are there in total? 500? Or 5000? Their number is infinite. Everyone can create their own indicator. That is, for each trader the indicator signals will be different.
As I wrote above, indicators may give incorrect signals if the market situation changes. If your indicator-based strategy performs well in a trending market, it may fail when markets enter a consolidation phase. For price action traders, key support and resistance levels are universal. They reflect the psychology of the majority and work in any market phase.
Volume
Also the simplest and one of the most popular is Volume, or in other words, volume.
There is no specific trading method for this indicator, but it helps a lot with the concept of the overall picture of supply and demand. Based on it, you can understand what the mood of the market is today and in which direction it is necessary to open transactions.
Technical indicators complicate things
I have written more than once that trading should not be too complicated. However, most traders like to complicate things.
Let's see how the MetaTrader platform, perhaps the most popular trading platform among Forex traders, greets us after installation:
We immediately see four eyes of charts with indicators.
I'm not saying that technical indicators are bad per se. The problem is that many traders overuse them. They add four or five indicators to their chart, watch for crossovers or oversold and overbought levels, and only then make trading decisions. They don’t even pay attention to which currency pair they are currently buying or selling.
These traders typically end up with nothing but losses after a month or two. Then they start looking for a new indicator or perhaps a completely new trading strategy. And with the endless number of indicator combinations, it's no wonder that many never find what they're looking for. It's a vicious circle.
I believe that every new endeavor has its learning curve. For some, this process may last several months, and for others, several years. The process of learning to trade usually takes years.
When you use indicators, it will be very difficult for you to understand why they are not showing profit. Let's assume that we are using a trading system based on MACD, RSI and moving averages. So far our trading system brings only losses. But we really want to make a profit from it. It will be incredibly difficult to determine which indicator is the problem. Perhaps our results are spoiled by one indicator, or perhaps two or three. There are hundreds, if not thousands of technical indicators available for the MetaTrader platform.
In fact, the solution is to remove each of the indicators from the chart. Exactly each of them.
You can add one or two indicators later. However, first you need to learn to understand price movement. Otherwise, you won't know if the indicators actually work or if you just like them because they look cool.
Let's face it: most new traders choose indicators for their appearance, not for their practical use.
I can say with confidence that adding indicators without understanding price movement is a mistake.
Technical indicators I use
The only technical indicators I sometimes use are exponential moving averages (EMA) with periods of 10 and 20. You will never see any MACD or RSI on any of my charts.
Why 10 and 20 EMA? I primarily use these moving averages to determine the price average.
In mathematics, the average is the number between the smallest and largest of their values. This is the "central" meaning of any set of numbers. So if we had a set of numbers 1, 2, 3 and 4, the average would be 2.5. We get this by adding four numbers and dividing by four:
(1 + 2 + 3 + 4) / 4 = 2,5.
What does this have to do with the market? The price always tends to return to its average value. This is not even a probability, but a mathematical pattern.
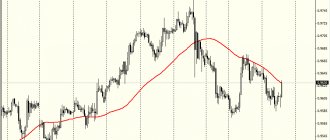
With this in mind, I use the area between the 10 and 20 EMA as an average during trends. This helps me avoid buying or selling at price extremes.
Notice how the price reverts to its mean before taking the next step and moving on.
The concept of mean reversion is one of my general rules for taking a trade in a trending market. If the price is too far from its average, I stay on the sidelines, no matter how attractive the entry points are.
Dependence on indicators
Many traders do not know how to use indicators correctly. They believe the answer lies in the "right" combination of indicators that will make them rich.
So they test many indicators and after many unsuccessful attempts they wonder why they are losing money.
Indicators are derived from price. They simply tell you what has already happened in the market, not what will happen. So, no matter how many different indicator combinations you use, you will never be a profitable trader if you rely only on trading indicators to make decisions.
Technical indicators are designed to help your decision-making process, not to make market entry decisions for you.
How often are you wrong?
You might think, “Look how strong the signal is.” “All three indicators point in the same direction.” “The market is going to move higher.”
Sorry, but you are wrong. And this is the wrong way to use technical indicators. Why?
Because the RSI, CCI and Stochastic indicators belong to the same category (they are called oscillators).
This means that the values of these indicators are calculated using similar mathematical formulas, which explains why their lines move in the same direction. Therefore, do not think that the signal is “strong” because numerous indicators confirm this.
Don't copy other traders
There are profitable traders who use technical indicators in their trading. And you're probably thinking, "Since they make money with these indicators, why don't I just copy them?"
You try to use the same indicators, trading settings, instructions, etc. But you still lose money. Why?
Because you only see the surface and not the full picture.
Here's an example:
Vitya is a profitable trader who relies on technical indicators to determine when to enter and exit the market.
Now, the reason why Vitya trades successfully using indicators is not because he found the “ideal” settings or anything else. Rather, it is because he knows how different indicators are correct for different market conditions.
So if you blindly follow what he does, when the market changes, your trading indicators will stop working and then you will have a drawdown.
Bollinger Bands
The Bollinger Band indicator also acts as a channel and is very similar to the Keltner channel, except for its multifunctionality. Bollinger is perfectly used both in scalping and trend trading.
It combines the principle of trading according to Keltner, but also adds the feature of trading based on channel exits. The scalper strategy involves catching small knives, and Bollinger will tell you where exactly to catch.
How do professional traders use technical indicators?
At this point we have learned that technical indicators should not be the basis of your analysis and why you should not copy other traders. Now the question arises, how to use indicators correctly?
The secret is to categorize the indicators according to their purpose and then use the appropriate trading indicators. You can use them for:
- Filter market conditions.
- Significant area definitions.
- Search for entry points.
- Managing your transactions.
Trading strategies for short-term and intraday trading
Traders use about a dozen trading strategies for short-term and intraday trading. It is difficult for beginners to keep up with rapid market changes, so experienced brokers recommend using indicators for better guidance in margin trading. Such transactions involve increased risk. To avoid losses, especially much attention must be paid to technical analysis.
As an example, we can cite several intraday trading strategies that use highly liquid assets and operate with the shortest possible time frame. They are universal and specific. Universal ones are applicable in any period of time, and specific ones are focused on time frames from M5 to M30. The easiest to learn trading strategies for short-term and intraday trading are:
- From horizontal levels;
- For a breakout of the morning flat;
- Scalping;
- Trading on the news.
How do indicators help filter market conditions?
All trading strategies can work for some time. But no trading strategy can work all the time.
Therefore, you must know the appropriate market conditions in which your trading strategy will work and avoid market conditions in which it will be ineffective. This is where technical indicators can help you.
The moving average is a trend tracking indicator that can be used to filter trends in the market. For example, if the price is above the 200-day moving average, the market is in a long-term uptrend.
The ATR indicator measures volatility in the market and can be used to identify low or high volatility. For example, if your trading strategy performs well in low volatility environments, then look for ATR values trading at 52-week lows.
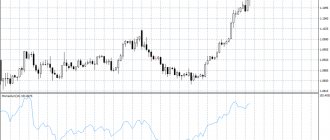
MACD
The MACD indicator (MACD) - Moving Average Convergence and Divergence can be translated as “Convergence and divergence of moving averages.” It is used in technical analysis to evaluate and predict price fluctuations in markets.
It is used to check the strength and direction of a trend, as well as to determine reversal points. It belongs to the family of oscillators, and is essentially an improved version of two moving averages.
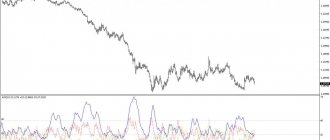
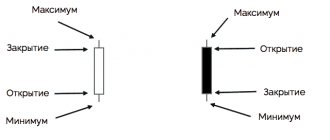
The MACD indicator is built on the basis of two lines - solid (main) and dotted (signal), which is usually of a brighter color.
The main line is built based on two average fluctuations in the exchange rate of the instrument being traded. It is more mobile and reacts quite quickly to price changes in a short period of time. The signal line reacts much more slowly to price fluctuations, but covers a longer time interval.
Trading using the MACD indicator is based on the intersections of the Main and Signal lines. So, in the case when the Home falls below the Signal (dashed) line, this is a signal to sell. And in the case when the Main rises above the Signal line, this is a signal to buy. Also, the moments when the Home crosses the zero line down or up are used as sell/buy signals.
Example: we buy when the histogram columns begin to go below the zero line and then close above the moving average. The trade is closed when the histogram columns cross the average in the opposite direction. A sell transaction requires the opposite conditions.
On hourly timeframes (and less), the MACD indicator gives a lot of false positives. It is recommended to use it on daily charts or higher.
Using Indicators to Find a Significant Area
You're probably wondering, "What is a significant area?"
Well, this is an area on your chart where potential buying or selling pressure could occur. For example, price action traders use support and resistance levels, trend lines, and price channels to identify a significant area.
However, you can also use indicators.
The RSI indicator is a momentum indicator that allows you to measure price movement over a certain period of time. It is useful to apply to the stock market. When stock prices fall, they tend to continue a long-term upward trend.
Therefore, one way to identify a price rebound is to look for trade setups when the 10-day RSI crosses below 30.
One trading indicator can be useful for several purposes, such as the moving average. How does a moving average help identify a significant area?
In a trending market, price rarely retests previous support or resistance. This is where the moving average comes into play. In a healthy trend, price tends to find support near the 50-period moving average.
In a strong trend, the market tends to find a significant area near the 20-period moving average. In a weak trend, this could be a 200-period moving average.
Volumes
Trading volumes in the stock market are the number of lots of shares that were traded over a specific period of time. Volume analysis helps determine how important certain technical analysis formations formed during trading sessions are.
How to read volumes in Tradingview
As a rule, volumes are placed at the bottom of the charts. They represent a histogram, each column of which corresponds to a separate time period. Those. If you select a 5-minute chart timeframe, the volume indicator will take into account the number of shares or lots for each reporting 5 minutes of time. The size of the bars varies depending on the size of the transactions: the larger the volume, the higher the bar. If the volume scale is located on the vertical part of the chart, the same principle can be used to analyze volumes relative to the price levels of stock instruments.
Other volume sources
For technical analysis of volumes in the stock market, you can use alternative methods of obtaining information, for example, a deal feed. It makes it possible to see all transaction flows and isolate interesting points from the overall picture. This also includes volumetric indicators, such as volume oscillators, etc.
Divergence by volume
Divergence is the discrepancy between the dynamics of volumes and quotes. To understand what this is, you can imagine a simple situation when the price updates its maximum, but the volume indicator does not, i.e. the new extreme is established by smaller volumes than the previous one. This means that the peak of the trend has already been passed earlier, and with each further movement the turning point becomes more likely.
Volumes and figures
The relationship between volumes and graphic formations is quite simply characterized. Volumes partially confirm the validity of the patterns. If a technical figure is formed on a significantly increased volume, then the significance of such a formation will be higher than that of one that was not accompanied by an increase in volume.
How to use technical indicators to find entry points?
Most price action traders are familiar with various trading methods. For example, they know how to trade a breakout, pullback, or market reversal.
But when the time comes to pull the trigger, doubts often arise because the price movement does not look convincing.
- The candle may not be large enough.
- Perhaps the candle is bearish and not bullish.
- Perhaps the upper shadow of the candle is too long.
So you need an objective entry trigger so you don't have to guess.
Stochastic is a momentum indicator (analogous to RSI). When its value exceeds 30, it indicates that bullish momentum is underway, and this can serve as a bullish entry trigger to enter a long trade. If it crosses below 70, there is bearish momentum and it can act as a bearish entry trigger for a short trade.
Trade setup and entry trigger are two different things. You must first have a valid trade setup and then look for an entry trigger to enter the trade, not the other way around.
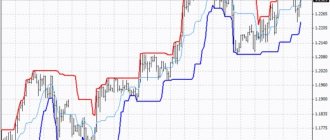
The Donchian Channel is a trend tracking indicator developed by Richard Donchian (a pioneer in trend trading).
By default, it plots the highs and lows over 20 days, so you can easily determine the high or low price for the last 20 days. This is useful for breakout traders as you can time your entry when price reaches the upper Donchian channel or sell when it reaches the lower one.
How to use indicators to manage trades?
Trade management is an integral part of successful trading. Even if you have the best entry points, if you manage your trade poorly, you will still end up with a losing trade.
When you set your stop loss, it can't be too tight, otherwise you'll be taken out of the market by random price movements. Instead, you should let the price breathe. And here the ATR indicator comes in handy.
- Determine the nearest price structure (for example, support and resistance levels, trend line, etc.).
- Set your stop loss at 1 ATR from the price structure.
The price structure acts as a "barrier" that prevents the market from moving against you.
However, this "barrier" is not a specific level, and you cannot know for sure how far the market may move. This is why you can use the ATR indicator to give the price some buffer.
The exit from the chandelier is a trailing stop indicator. It calculates the current ATR value and multiplies it by a certain factor.
The coefficient can be any number, such as 3, 4, 5, 10, etc.
If you choose a factor of 3, then the chandelier's output will be built at a distance of 3 ATR from the maximum or minimum. And if the price closes below the chandelier exit, you will exit your trade.
If you want to trade a longer-term trend, use a higher odds value, such as 5, 6 or 7. And if you want to trade a shorter-term trend, use a lower odds value.
Chaikin Oscillator
Like other oscillators, the Chaikin oscillator works using an identical technique. What distinguishes it from others is its more accurate construction method and the ability to use it on local trend movements.
Basically, all transactions are carried out when the zero mark is passed. Crossing from bottom to top means buying, and crossing from top to bottom means selling.
How can you combine technical indicators?
We learned that every technical indicator has a purpose, be it to identify market conditions, entry trigger, trade management, etc. How can indicators be combined for better results?
So here are two rules to follow:
- Every indicator on your chart should have a purpose.
- You should only have one indicator for each goal.
A mistake that almost all new traders make is adding many indicators to their charts regardless of whether they have a target or not. But as you know, having more indicators doesn't mean anything. Instead, they only add noise to your trading and make market analysis more confusing.
If you want to identify a trend, you can look at the moving average. If you want to time your entry, you may want to consider Stochastic or RSI. If you want to track your stop loss, you might consider a chandelier exit or a moving average.
If you have an indicator on your chart and you can't find a target for it, remove it from the chart.
You don't need to use multiple indicators from the same category because they are correlated and do not provide any new information.
If you want to track your stop loss, you can use either the moving average or the chandelier exit, but not both. Or if you want to time your entry, you can use the RSI or Stochastic indicator, but not both together because they have the same goal.
About us: Admiral Markets
This material does not contain, and should not be construed as containing, investment advice, recommendations or an offer or solicitation for any transactions in financial instruments. Please note that such trading analysis is not a reliable indicator for any current or future trading as circumstances may change over time. Before making any investment decisions, you should seek the advice of independent financial experts to ensure you understand the risks.
Trader evolution
Everything you need to know about price movement is right in front of you. If you want to become a professional trader, you need a clean chart. Otherwise, you will spend your time sifting through useless technical indicators rather than studying price action.
Trying to create a working strategy based on indicators is incredibly difficult. By using simple price action patterns, you can reduce your learning curve by at least half.
If you feel deep down that indicators are the way to go, that's okay. Just be sure to spend some time learning about price action. This will help you in the long run, even if you decide to use an indicator-based strategy.
Whatever you do, be simpler in your trading. Learning to trade doesn't have to be a difficult process. Everything should be just the opposite. First, learn a few patterns. Add an indicator or two if you like, but remember that price action is all you need to make consistent profits.