- History of creation
- RSI formula
- How the RSI indicator works
- How to use RSI
- Overbought and oversold
- Divergence
- Internal spread
- Bullish reversal (for price growth)
- Bearish reversal (for falling prices)
- Divergence confirming the trend
- Reverse divergence
- Stochastic RSI
- MACD RSI
- RSI Settings
- Let's sum it up
The Relative Strength Index (RSI), also known as the Relative Strength Index (unconscious citizens call it “resai”), is one of the key oscillators that is used all over the world.
If you turn on our or Western economic news, take a closer look at the charts on traders’ monitors. There is a very high probability that RSI will flash on one of them.
This indicator displays the so-called “momentum” – that is, the speed and amplitude with which the price movement changes.
In other words, with the help of RSI we can analyze the strength or weakness of the current market price state. The indicator is based on the use of closing prices over a certain period of time, on the basis of which time-tested effectiveness is born.
As a result, it is used everywhere - for real indices, futures, options, currency pairs and to determine whether it will rain on Thursday. In short, the RSI trading strategy is just what the doctor ordered for the poor binary trader.
Simple, reliable, super popular indicator - what else can I add? Just how to use the RSI indicator for binary options.
Open a live chart , select RSI, profit:
History of creation
The indicator was developed by J. Welles Wilder and published in Commodities magazine in June 1978. Later, Wilder wrote the book “New Concepts in Trading Systems,” where he outlined in detail the essence of the relative strength index. After the publication of the book, the RSI oscillator became very popular among traders and helped many users assess market strength.
Wells Wilder is a stock trader, one of the leading specialists in technical analysis and the developer of many trading systems and indicators. An engineer by training, Wilder managed to work both in his specialty and in the real estate market, but he became truly interested in futures trading. Wilder spent many years researching technical analysis, which resulted in several books (“New Concepts in Technical Trading” (1978), “The Adam Theory of the Markets” (1987)) and “The Delta Phenomenon” (1991)).
In the early 80s. Wells founded the Delta Society International. The purpose of the society was to study financial markets. The society's own company, Trend Research Ltd, develops trading software.
Wilder is the author of such well-known indicators as the Average True Range , Relative Strength Index , Directional Movement Indicator and Parabolic Stop and Reverse .
Today, G. Wells Wilder Jr. is perhaps the most famous living market guru. The retired trader lives in the beautiful South Island of New Zealand. He reflected the experience of his past years in his latest book, “The Wisdom of Ages in Acquiring Wealth.”
He says that if he had known in his youth what is written in this book, he would be much richer than he is now. Its indicators are considered basic for many technical analysis programs and are included in almost all modern trading terminals.
J. Wells Wilder Jr. remains an active trader and consultant on technical trading systems and methods, the author of many articles, and appears on radio and television.
And finally, a couple of interesting quotes from this wonderful trader:
“If you can’t cope with your emotions, quit trading.”
“Some traders are born undisciplined. Life will teach you. It will hurt.”
General description of the indicator
The RSI indicator is an oscillator, which means it fluctuates in a certain zone limited by the maximum and minimum values. The Relative Strength Index is measured on a scale from 0 to 100. It works best when reaching extreme areas. The evaluation criterion is two lines drawn at the level of 30 and 70. It is believed that above 70 there is an overbought zone, and below 30 there is an oversold zone. Therefore, when the Relative Strength Index value reaches and rises above 70, there is a threat of a price decline; movement below 30 is perceived as a warning of an upcoming rise. Some analysts advise taking levels 30 and 70 as boundaries only for sideways trends, and 20 and 80 for pronounced bullish and bearish trends.
Of course, exceeding the levels of 30 and 70 does not mean that you need to immediately start making deals. After all, the market may be in a state of overbought and oversold for a long time, and the oscillator, warning about a trend change in advance, does not explain exactly when this may happen.
When introducing RSI, W. Wilder recommended using its 14-day version. Later, 9 and 25 day RSI also became widespread. Often the period is 5, 7, 9, 14, 21 or 25. Most programs offer one of these numbers as the default value.
The daily RSI will be based on price data covering the last 9 or 14 days. The weekly chart will include the past 9 or 14 weeks. Minute, naturally, 9 and 14 minutes.
The number of unit periods when calculating RSI can be varied, so I recommend experimenting with them to choose the most suitable option. The shorter the RSI calculation period, the more sensitive the indicator is to current price changes.
How to choose the optimal period? The fact is that it will be different for different timeframes of the same currency pair, so it will not be possible to use a successfully selected indicator period on all time scales of the pair you need. As a rule, the smaller the timeframe, the longer the period should be and vice versa. Finding the optimal period for the RSI indicator is not difficult - you need to sequentially go through the periods and look at the overbought and oversold zones. As soon as the main pronounced (reversal, key) highs and lows on the price chart begin to be reflected by the indicator in the overbought and oversold zones, and the rest (at least most of them) are outside these zones, consider that the optimal period has been found.
As usual, the shorter the period we use, the more sensitive the curve will be and the more signals we will receive. The shorter the period is selected, the closer to the extreme values of the scale are the RSI index indicators corresponding to the “overbought” or “oversold” state of the market. The greater the number of days in the period when calculating the index, the smoother its indicators will be.
You can learn more about the nuances of setting up oscillators here.
How can you confirm divergence?
The first thing to understand is that you cannot “confirm” any trading signal in a way that will guarantee a profitable outcome. You probably understand, but some new traders think that there is always a way to be sure of a profitable trade. However, this is simply impossible. Trading is a series of victories and defeats.
However, you should do your best to ensure that you have an obvious divergence trading signal before entering a trade. Fortunately, there are only a few components that can serve as a reliable signal of divergence.
The first thing to look for in RSI divergence is when the RSI is in an overbought or oversold state. This shows that there is a relatively extreme move and the price is likely to bounce from that level.
Then look for a situation after that where:
- Oversold: Price makes a lower low and the RSI indicator makes a higher low.
- Overbought: Price makes a higher high and the RSI indicator makes a lower high.
Also remember that a candle must close to be a true RSI divergence signal. Do not enter trades before the candle closes and you have a confirmed divergence.
As with any indicator-based trading strategy, the specific RSI indicator settings will vary between traders. However, it is best to start with the default RSI settings:
- 14th period
- 30/70 signal levels
Now that you understand what RSI divergence is, let's look at several ways to optimize divergence trading strategies. These techniques can help you increase your profit percentage or average profit per trade.
Calculation formula
Since the computer does all the calculations for you, there is no need to memorize the formula. Nevertheless, knowing it will help you better understand the essence of the indicator’s operation, and this is the key to its correct use and interpretation of the signals it provides.
Wilder argues that there are two main problems with constructing a price rate curve (based on price differentials). The first is due to the chaotic movement of the rate curve due to frequent sharp changes between price values during the period under review. A sharp increase or decrease in prices that occurred ten days ago (in the case of a ten-day tempo indicator) today can cause a sharp turn in the curve - even if current prices remain relatively calm. Therefore, in order to reduce such distortions to a minimum, the tempo curve must be smoothed. The second problem relates to the need for constant oscillator band boundaries for benchmarking purposes. The RSI index formula solves both of these problems: it not only flattens the curve, but also provides a constant vertical scale from 0 to 100. It should be noted that the term “relative strength” is used by Wilder to some extent erroneously and is often misleading to those who is familiar with this concept from stock market analysis. “Relative strength” is traditionally understood as a curve of the relationship between two different objects. As for the Wilder Relative Strength Index, it does not measure the “relative strength” of various objects, and therefore the meaning that the author gives to this term is not entirely accurate. However, the RSI index solves the problem of chaotic movement of the oscillator curve and allows you to set constant upper and lower limits of fluctuations.
RSI is calculated using positive (U) and negative (D) price changes. A day is called “up” if the closing price today is higher than yesterday.
A day is called “down” if the closing price today is lower than yesterday.
If the closing prices today and yesterday are equal, then U and D are equal to 0. After the values of U and D are smoothed by an exponential moving average with a period of N, the “relative strength” (RS) is first calculated:
Based on RS, RSI itself is calculated:
It's easy to verify that:
Many sources indicate not an exponential moving average (EMA), but a simple one (SMA).
When calculating RS, it is necessary to take into account the situation when the denominator turns out to be zero. This is possible when using a simple moving average (SMA), when over the entire averaging period the price only went up and, accordingly, all values D = 0. In this case, it is necessary to take RSI=100.
Of course, any price can be used to calculate the indicator. For the MT4 terminal, this is the closing price, opening price, highs or lows, average, typical and weighted price. It is also possible to build RSI using data from another indicator.
Overbought and oversold levels
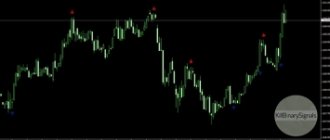
RSI index values are plotted on a vertical scale from 0 to 100. When the indicator is above 70 or below 30, the index registers overbought or oversold conditions, respectively. Two horizontal lines are plotted on the oscillator chart, corresponding to the values of 70 and 30. These lines are often used to receive buy and sell signals. As already mentioned, an oscillator value below 30 indicates that the market is oversold.
Let's say a trader believes that the price decline is about to reach its limit, and is waiting for an opportunity to open a long position. He sees the oscillator curve falling below 30, entering the oversold area, and hopes that there will be some divergence or a double bottom in the oscillator dynamics in this area. When the curve crosses the boundary again - this time rising - many traders view this as confirmation that the oscillator's trend has turned upward. Conversely, re-crossing the 70 line when the curve falls from the overbought area is often regarded as a signal to take a short position. Of course, exceeding the levels of 30 and 70 does not mean that you need to immediately start making deals. After all, the market may be in a state of overbought and oversold for a long time, and the oscillator, warning about a trend change in advance, does not explain exactly when this may happen. You should always keep a close eye on the intersection of the 70 line and the 30 line. During a strong uptrend, it is not unusual for the RSI oscillator to rise above 70 and stay there for quite some time. This is usually a signal of a strong upward trend. In such cases, it is probably best to ignore the oscillator for a while while it remains above 70. A cross below 70, especially if it occurs after a long time, often gives a good signal of a change in trend. Many traders consider a cross below the 70 line to be a sell signal and a cross above the 30 line to be a buy signal.
It is not necessary to use exactly 70 and 30 as levels. Experiment with the levels. For a bullish market, 40 and 80 are better, and for a bearish market, 20 and 60. To reduce the total number of signals and increase their quality, you can use levels 20 and 80. I recommend using the 5 percent rule: draw a line so that the RSI remains 5 percent behind it total time over the last three months, for example, if you trade on daily charts. Adjust the reference line as necessary.
In a very calm market with low volatility, you may notice that the RSI line fluctuates between 70 and 30. You may want to try to increase the amplitude of the RSI swing by shortening the time period. Try to find a lower period, such as 7 or 5. The opposite case involves a situation where the RSI line is too volatile. Frequent transitions above 70 and below 30 become less significant, making it difficult to determine between real signals and market noise. In this case, it is necessary to reduce the amplitude of the RSI line by increasing the period, for example to 21. This will eliminate many minor movements and help identify those that are valuable.
A buy signal is when the RSI leaves the oversold zone, a sell signal when the RSI leaves the overbought zone. Such signals are taken only in the direction of the main trend. Signals against the trend are ignored! It is better to combine these signals with signals from other indicators or with technical analysis. A signal to exit a position is when the overbought or oversold zones are reached. For example, when the RSI reaches the overbought zone, we close buy positions or pull our stops closer.
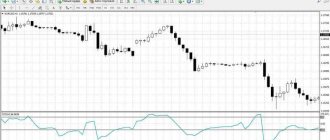
Most often, the RSI indicator is used by scalpers in their work during periods when there is a narrow flat on the market. Pay attention to the picture with examples of entry points for the RSI indicator: the euro/dollar rate entered the overbought zone - 70, crossed it from top to bottom and we enter to sell, and as soon as the price entered the oversold zone - 30, we enter to buy. This tactic is very effective in a flat, when positional traders are waiting for clarity in the Forex market, then scalpers using the RSI indicator simply stuff their pockets with money with such precise short transactions.
What is the RSI indicator?
The RSI indicator was developed by Wells Wilder in 1978. It quickly became one of the most popular oscillatory indicators in financial markets.
RSI readings fluctuate between 0 and 100. RSI is considered overbought when it reaches a reading of 70 and oversold when it falls below 30. The standard setting for RSI is 14 periods, which means that RSI evaluates the last 14 candles.
Indicator formula:
RSI = 100 – (100 / (1 + (average upward price change / average downward price change))
The RSI compares the average price movement and analyzes how many of the last 14 candles were bullish versus bearish, and also estimates the size of each candle. For example, if all 14 price candles were bullish, the RSI would be 100, and if all 14 price candles were bearish, the RSI would be 0. An RSI of 50 means that the last 7 candles were bearish and the last 7 were bullish. The more bullish candles there were compared to bearish ones, the higher the indicator value will be.
The highlighted area includes the last 14 candles that the RSI analyzes. Of these 14 candles, 13 were bullish and only 1 was bearish, resulting in an RSI reading of 85.
Here's another example:
- The first area shows a bearish period with 9 bearish candles, 4 small bullish candles and 1 doji. The RSI for this period was 15, indicating a very strong bearish period in the market.
- The second area includes 9 bullish candles and 5 (mostly small) bearish candles. The RSI showed a reading of 70, which is a relatively strong bullish indicator.
- Next we see 6 bullish candles, 8 bearish candles and 1 doji, resulting in an RSI of 34, indicating moderate bearish strength.
As you can see, just by analyzing 14 candles, you can very accurately understand the RSI value for a certain period. However, using an indicator can still be beneficial as it removes the guesswork and allows you to process chart data faster.
RSI is a great tool and while you can easily estimate the value of RSI just by looking at the last 14 candles, using RSI will help you gain more confidence in your trading.
Levels 40/80 and 20/60
As I said above, in an uptrend it is advisable to use levels 40 and 80. In this case, we only make purchases when the indicator level drops to level 40.
In a downward trend, it is advisable to use levels 20 and 60. In this case, we only consider sell transactions when the indicator level rises to level 60.
Determining a trend change at the 20/60 and 40/80 levels
When using the 20/60 and 40/80 levels everything comes out pretty smoothly, but how do you know when to use which levels? It's pretty easy. So, during a downward trend, the RSI indicator constantly drops to the level of 20 and never reaches the level of 80. During an upward trend, it hangs around 80 and does not want to go to 20. Therefore, when a situation occurs, as in the picture above, we can talk about a change in trend from a downward one to the ascending one in our case. During a downward trend, the indicator dropped to the level of 20 several times, never reaching the level of 80. But one day, the RSI still broke through the level of 80 - from now on you need to be careful, a change in trend is expected. The next decline in the indicator, which did not reach level 20, confirms the change in trend.
Positive and negative reversion
The signals, which were developed by Andrew Cardwell, are the opposite of divergence. If RSI divergence tells us about a possible trend reversal, then reversion tells us about its continuation . This way we can easily interpret pullbacks and corrections.
A positive reversal should be sought in an up market, when the chart shows rising lows (pullbacks) and the RSI oscillator shows falling lows.
The opposite can be said about a negative reversal, which occurs in a down market and looks like this:
Level 50
While the RSI oscillator's main focus is on the oversold and overbought lines, the 50 line is also important. You may notice that in strong trends the price often finds resistance at this level.
If you are looking for confirmation of an uptrend, then make sure that the RSI is above 50. If you think that the market is in a downtrend, then make sure that the RSI is below 50. Let's say you have found an uptrend, but you doubt its strength. To avoid false signals, wait for the moment when the RSI crosses above 50, thereby confirming the assumption. Now we can say quite confidently that a trend has formed; crossing the RSI level above 50 is a good confirmation. You may notice, for example, that during an uptrend correction the RSI line will often find support at the 50 line before moving back up again. During a downtrend, RSI line bounces will often stop near the 50 line.
Use the 50 signal line to confirm the trend. If the RSI is above the 50 line, the trend is upward and it is recommended to enter only into purchases; if below, we consider only sales.
When does RSI divergence not work?
Like any other trading methodology, divergence does not work 100% of the time.
Most often, divergence fails in strongly trending markets. If you take too many divergence trades when the trend is strong, you will lose a lot of money. So make sure you have a solid money management plan.
Your profit percentage and loss percentage will also be determined by your exit strategy, your trading discipline, and your ability to objectively analyze your results.
The most common reasons for the failure of any trading system are:
- Not enough testing
- Give up too early
- Not logging your trades properly
- Trading strategy has no advantage
- Unrealistic expectations
- Ignorance of expected statistics
- Lack of good trading opportunities
These are problems primarily related to your trading psychology and trading process. Therefore, if you have a trading strategy that has a statistical advantage and you are on a losing streak, you need to take a hard look at your trading process and psychology.
Don't change your trading system just because you have a losing streak. This may not be a problem with your strategy. Try to look at all aspects of your trading objectively.
We have studied how RSI divergence works. Remember that while divergence may look good on a few well-chosen examples, you need to have a complete, well-tested trading strategy in place to have long-term success with RSI divergence.
This starts with creating a trading plan and backtesting it. Then, if your strategy passes these tests, you can move on to testing on a demo account and, if it works, to live trading. Take the time to go through this process step by step.
Failed Swing
When index indicators are in oversold or overbought zones, a special pattern can form on the oscillator chart, which Wilder calls a “failure swing.” A “failed swing” in the position of the top is that during an upward trend, the next peak of the indicator curve never reaches the level of the previous peak, after which the curve falls below the level of the previous decline. A "bottom swing" occurs when a falling indicator (below 30) fails to fall below the previous decline and then rises above the previous peak.
However, despite the reliability of the pattern, it should not be used blindly and without confirmation by other tools. At a minimum, you need to filter trades by trend direction.
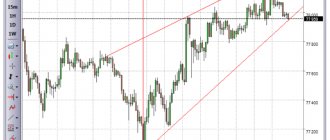
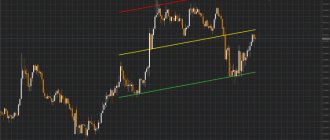
Levels and trend lines
Classic graphical analysis works quite well on the RSI indicator chart.
In the figure above, a regular horizontal level is plotted on the RSI indicator chart. In this case, the support points of the indicator coincide with the support points of the trend line on the price chart. Notice how the RSI told us about the breakout of the trend line 4 bars before this event. Example of trend lines:
Absolutely classic behavior of the indicator when breaking out trend lines - a lot of touches, then a breakout and almost always a mandatory retest of the broken trend line provides an excellent opportunity to enter a trade at the best price. The best signals are taken in overbought and oversold zones. In this case, you need to act in exactly the same way as when analyzing price charts - the more touches, the higher the time frame, the longer the model in time, the more reliable the signal.
Graphic shapes
In addition to levels and trend lines on the RSI chart, technical analysis figures, such as head and shoulders, triangles, wedges, rectangles and others, are also often analyzed. With their help, you can predict the dynamics of the Index movement, as well as the time when exactly the price trend should change.
RSI often forms graphical patterns that may not appear on the price chart. However, such figures can be quite good signals for entering a position, often ahead of most other methods.
Trend identification
In Technical Analysis for Professional Trading, Constance Brown suggests that oscillators do not move between 0 and 100. In an uptrending stock market, the RSI moves between 40 and 90, with a support zone of 50 to 40.
When the stock market moves down, the RSI fluctuates between 10 and 60, and the support zone is between 60 and 50. In other words, depending on the direction of the trend, you can shift the overbought or oversold levels to receive signals during a trend correction. Examples are presented in the graphs.
Divergences
Another tool for predicting prices using the Relative Strength Index is to study the discrepancy that has arisen between the direction of movement of the Index chart and the price trend. Divergence refers to two cases: 1. RSI is growing, but the price is falling or staying at the same level. 2. RSI falls, but the price rises or does not move. The divergence in this case is a strong reversal indicator. And although it does not occur at every turn, it is often encountered at particularly serious turning points.
The divergence between the RSI curve and the price movement curve with index values above 70 or below 30 is a serious signal that is dangerous to ignore. Wilder himself calls the divergence “the most significant indicator for the relative strength index.” In such a case, the index curve shows either a double bottom or two rising bottoms. In this example, the oscillator signal very accurately indicated the beginning of a price correction and the need to take profit in a bearish market.
The RSI indicator shows quite well the discrepancies (divergences) between the price readings on the chart and the values of the oscillator itself.
As stated above, divergences occur when price makes a new high (low) but it is not confirmed by a new high (low) on the RSI chart. In this case, prices usually correct in the direction of the RSI movement. More detailed information about divergences and their types can be found on the blog pages.
Stochastic RSI
What happens if one super-popular indicator - stochastic - is combined with another? You get Stochastic RSI, two shampoos in one bottle.
It is enough to put all three options on the chart to evaluate the difference. Top down:
- RSI;
- Stochastic RSI;
- Stochastic.
As you can see, Stoch RSI is an indicator that takes the best of RSI and regular stochastic. In fact, I regard this turkey simply as a more convenient, smoothed version of the usual stochastic.
Detailed description of Stochastic .
Actually, it is this version of the stochastic that I use. It works great for the 5-minute timeframe and above. But for a 1-minute period it is sometimes better to use a regular stochastic - it is more “fast”.
And here is the second popular couple.
RSI and moving averages
Most traders use the RSI indicator only in the traditional manner of analyzing overbought and oversold levels. The chart below shows how simply adding a Moving Average to the indicator creates a smoothing effect and shows the trend direction of the RSI indicator.
The moving average (red) shows the direction of movement of the RSI indicator, as well as the location of the index itself relative to the moving average (above or below), which also indicates the current trend. In addition, the moving average can act as a resistance level for the indicator.
If plotting one average on the relative strength index gives such good results, then two averages must be the holy grail.
This, of course, is not entirely true, but still, if you take into account the direction of the trend, you can get good signals at the intersection of two moving averages constructed using RSI data.
Let's sum it up
Between us girls: for several decades now, the relative strength index has been haunting stock traders all over the world. If you go to any paid courses on technical analysis, I guarantee you that they will definitely tell you about RSI.
Book on RSI on the forum.
In fact, RSI is considered one of the best indicators for creating market metrics and various trading strategies and systems. It just seems as simple as nose hairs - in fact, the indicator hides impressive depths that are very interesting to uncover.
As with any other indicator, do not try to use it blindly. Neither the resai nor any other indicator. Experiment. Put it on the chart, watch what it shows. Don't rush to place bets - the train is not leaving. The price, the pace of its development, the depth of the market - all this is monitored using RSI and done correctly.
A wonderful turkey, both for beginners and for growing. So show respect to him and pronounce “resai” with aspiration, otherwise the turkey will be offended, appear in your dreams and breathe nervously into your ear. And who needs it? No one. Don't hurt the turkeys.
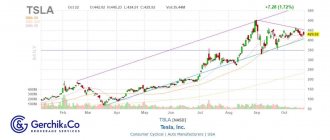
How to determine the trend using the RSI indicator
When John D. Rockefeller was asked how Standard Oil's share price would behave, he allegedly replied, “I think it will fluctuate.” Price fluctuations are, of course, the essence of the market, where buyers and sellers collide. Prices can fluctuate within a range that has lower and upper limits, often called support and resistance levels. In other cases, prices may fluctuate within an ascending or descending price channel. When prices break through the range and move towards their final goal - up or down, we can talk about a trend.
Determining the presence or absence of a trend is one of the most important tasks of technical analysis. The classic indicator used in a trending market is the moving average, since price, while moving in a trend, tends to remain on one side or the other of the appropriately chosen moving average throughout most of the trend. The main disadvantage of the moving average is its lag. It cannot reflect current reality, because... is based on historical data.
RSI is based on price changes and is thus an indicator of price speed. With this in mind, when most price movements are on the upside, you can expect the RSI to read 50 or higher, indicating that a moving average with the same period as the RSI has a positive slope. The opposite is true when most price changes are downward and the RSI is below 50.
The 200 period Simple Moving Average (SMA) is shown in red and the RSI (200) in blue. Level 50 is indicated in blue. At point A, the slope changes from downward to upward, while the SMA 200 turns upward, and the RSI 200 rises decisively above 50. Please note that it is difficult to determine the change in the slope of the moving average by eye, but it is easy to notice a drop in the RSI. We have seen that the RSI can detect a change in the slope of a moving average when it moves above or below 50. But this is not the same as defining a trend, since the slope of a moving average price may briefly flatten or even reverse during a major trend.
One way to solve the problem is to use a simple moving average of the RSI index itself as an indicator. Moving averages with periods of 100 and 200 are depicted in green and red to identify the trend. The 100-day average of the RSI 200 is shown in red, with a horizontal line at 50. As stated earlier, a change in trend occurs when the RSI line crosses the 50 level. The same applies to the RSI moving average. The RSI signals occurred a little later than the moving average crossovers (points 2 and 6 vs. 1 and 5). But note that SMA 100/200 prices had sawtooth movements at points 3 and 4. In addition, there were several sawtooth price movements crossing the SMA 200. The 100-day moving average RSI 200 - on the contrary, had no such movements at all during this period .
A more sensitive method is to compare the RSI to its own moving average. The figure above shows the RSI 200 plotted along with its own SMA 200. The RSI 200 crosses its SMA 200 from bottom to top at point 1 and from top to bottom at point 2. Note that the signal at point 1 occurred before the moving average crossover. This method shows us most of the upward phase of the market.
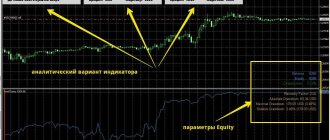
Indicator with alert and arrow RSI Crossover Alert
It calculates two oscillators with different periods. The one with more is called slow, and the other is called fast. These periods are specified by the variables:
- FastRSI Period – for fast;
- SlowRSI Period – for slow.
The price at which the calculation is carried out is also specified - it is the same for both oscillators and is determined by the RSI AppliedPrice value. Some other variables set the parameters of the calculation mode:
- StartCandle – initial calculation candle (0 – current, 1 – previous, etc.);
- History – the number of candles on which the calculation takes place.
Several other variables determine the properties of visual arrow alerts:
- ArrowDistance – vertical distance from the end of the candle to the arrow;
- BuyArrowCharacter – code of the “up arrow – buy” symbol;
- SellArrowCharacter – code of the “down arrow – sell” symbol;
- BuyColor – color of the “up arrow – buy” symbol;
- SellColor – color of the “down arrow – sell” symbol.
And the alert mode is set by variables:
- PopUpAlert – whether to notify with a system message;
- AlertResetBy – frequency of repetition of each alert.
Figure 1. Indicator with alert and arrow RSI Crossover Alert.
The recommended trading strategy for RSI Crossover Alert is to set the oscillator periods to 14 and 5. Additionally, a slow exponential moving average of 200 is applied to the chart, serving as a filter:
- if the quote is above the EMA, then only purchases are made (Buy signals);
- if the quote is below the EMA, then only sales are made (Sell signals).
At the same time, Take Profit is only two or three average amplitudes of a certain number of last candles. This strategy is best used on short time frames, so it is ideal for scalping on minutes and five minutes.
Buy RSI Crossover Alert for MT5 or MT4 for 30 USD.
Using channel indicators
Using channel indicators makes the interpretation of RSI signals somewhat easier, since in this case the overbought and oversold levels become dynamic and move along with the relative strength index chart. In addition, the direction of the channel itself indicates to the trader the direction of the trend. For example, you can build Bollinger bands based on RSI values.
Just as the RSI chart itself generally repeats the price chart, often ahead of price reversals, so Bollinger Bands, built based on RSI values, in some cases can generate earlier or more clear signals to open a position. If you are able to use the Bollinger Bands indicator effectively, you may find that using Bollinger Bands based on RSI values will provide you with a number of additional benefits, especially when you consider the other signals generated by the RSI indicator. You can also use Envelopes, or, for example, TMI, as well as any other channel indicator.
Personally, I prefer TMI, the use of which can be seen in the figure above. In addition, some traders use moving averages based on RSI values as the 50 average line.
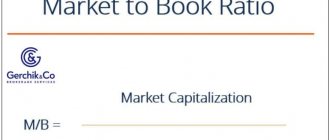
conclusions
The Connors RSI oscillator can be used on trending assets with moderate intraday volatility. These include only stock exchange indices or shares of companies with significant capitalization. When working with currency pairs, there is a high risk of losing your deposit. The percentage of profitable trades relative to unprofitable ones is insignificant, so using the Martingale method will only aggravate the situation. Based on the objective data presented, it is recommended to use the Connors RSI oscillator exclusively for trading stock market assets in the medium term.
RSI on different timeframes
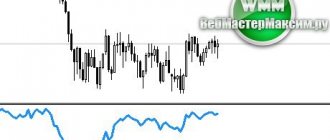
The RSI indicator shows good signals, but its readings still need to be filtered. One such possible filter could be the RSI from an older period. While in the M15 period the RSI signals oversold conditions, in the H4 period the indicator may be in the overbought zone. In this case, entry based on RSI readings on M15 may result in losses.
In the figure above, two RSI indicators with a period of 14 are plotted on the EURUSD H1 chart. The upper one is built according to the H1 period, the lower one - according to H4, all other settings are the same. Red dots show exits of the RSI indicator during the H1 period from the overbought zone, green dots - from the oversold zone. Orange and blue circles are the same, but for the RSI indicator built on the H4 period. Notice how well minor fluctuations are filtered out and only really large movements remain when the readings of both indicators are combined.
RSI Settings
Setting up the resai is like two fingers on the asphalt. Actually, we can only change the time period, which, by default, is 14 days. And that's a good value, really. I wouldn't change it unless absolutely necessary.
Well, on the Style tab you can easily change the style of the indicator:
- RSI – line of the indicator itself;
- Upper band – color and thickness of the upper line in the shaded area; the value 70 can be changed to 80 ;
- Lower Band – the same for the bottom line; the value 30 can be changed to 20 ;
- Background – instead of the cute purple color, you can use any other color.
And in general, no one bothers you to make an RSI for fans of chernukha, so that they can clearly see when it leaves the colored zone: