The US economy, being the largest in the world, attracts the attention of a huge number of investors from many countries. The attractiveness of the US market is due to the wide variety of trading platforms, trading instruments, and a huge number of issuing companies that place their securities here, including global giants of various industries. And these are not only American companies. The US Stock Market can be considered international. Shares and depositary receipts of companies from different countries are traded here, including Russia, China, Germany, etc. Thus, the US market still offers huge opportunities for geographic diversification of investments. And it is very important for investors to monitor the state of the “market climate” in order to select the most attractive assets or timely rebalance their portfolio (“Portfolio Rebalancing”). Stock indices serve as indicators reflecting the state of the entire market or individual industries.
This article will talk in more detail about US stock indices:
- What is an index?
- US stock indices, their types.
- Popular US stock indices.
- How to invest in US stock indices.
- What American indices can be bought on the Moscow Exchange?
What is an index?
Stock indices are calculated summary indicators consisting of a specific list of companies that reflect the state of a sector, a group of companies in the stock market or the entire market. When they say that the market has fallen or the market has grown indicating a specific percentage, then the growth or fall is judged, first of all, by the dynamics of the market index. That is, the index serves as an indicator or is also called a “barometer”, which speaks about the situation on the market or in a specific industry. That is, depending on the object and purposes of monitoring, investors monitor either industry indices or broad market indices.
Indices are created and tracked by specialized providers or exchanges.
Indices are formed from securities of issuers selected according to certain criteria. There are no universal criteria. Each market index has its own set - from market value (capitalization), industry, place of registration to free-float value and the number of periods in which the company operated with a profit. The composition of the indexes is not constant. They are reviewed at certain intervals, that is, so-called rebalancing occurs. Companies that no longer meet the established criteria are excluded from the index. And they are replaced by new participants. Typically, for an issuer, inclusion in an index is a significant driver of growth in market quotes. And usually, price increases do not occur at the time of news announcement or an already completed revision of the index structure. Investors monitor information about candidates long before news is announced, and therefore, at the time of rebalancing, the price of shares of new index participants is already built into this event. For example, in the Fin-Plan RADAR service you can see in advance the candidates for the Moscow Exchange index.
The US stock market is one of the oldest. The first US stock index dates back to the 1890s, when Charles Dow developed the Dow Jones Transportation Average based on data from eleven transportation organizations in the country. This index is still used today as the most recognized indicator of the American transportation sector.
Thus, all stock indices that exist today meet their specific goals. For example, the DJ Transportation index reflects the state of the transport industry, the DJ Financials financial index is an indicator of the state of companies in the financial sector, etc. Thus, monitoring an industry index allows one to assess the state of the industry for which the index is compiled. The main indices that reflect the general state of the US economy include the S&P500, NASDAQ100, etc. And then we will talk in more detail about these and other indices.
New Home Price Index in Canada
The new home price index from Statistics Canada is a component of the CPI indicator, consumer prices. The indicator is published separately in the general block of economic data released in the first week of each month (08:30 EST).
This publication format distracts the attention of traders assessing consumer spending inflation from the new home price index, but investors closely monitor percentage deviations from the previous period, studying dynamics over the course of a year or quarter.
US stock indices, their types
There are approximately 765 stock indexes maintained in the United States. These include all kinds of indices, starting with such well-known ones as the S&P500, Nasdaq100, Dow Jones Industrial, Dow Jones Composite Average (DJA), and ending with narrow-profile indices, where the PHLX Semiconductor semiconductor index can be cited as an example.
All existing US stock market indices can be grouped as follows:
- Industry indices.
As an example, indices (the quantitative content of the index is indicated in parentheses):- healthcare DJ Health Care (DJUSHC) – an index reflecting the state of the healthcare sector (100 companies from the pharmaceutical and biotechnology industries);
- transport DJ Transportation (DJT) – an index that tracks the state of the transport industry (20 transport and logistics companies);
- utilities DJ Utility Average (DJU) – index of the state of the utilities sector (15 utility companies);
- financial DJ Financials (DJF) is an index reflecting the state of the financial sector (257 financial companies).
- Broad market indices.
These include S&P500, S&P1500, DJ Composite, NYSE Composite, NYSE Amex Composite, Nasdaq Composite. Used to assess the state of the entire market. - TOP capitalization indices.
These include S&P100, Dow Jones, Nasdaq100. These indices allow you to assess the complex state of the most “expensive” companies, grouped according to certain characteristics in various indices. - Indices of companies
with small and medium capitalization. These include the Russell 2000, S&P 400, and S&P 600. These indices measure the health of companies with relatively small market capitalizations. - Other indexes.
This includes the market volatility index - the VIX index (more information about the volatility index can be found in the article “VIX Volatility Index”), which is calculated based on the volatility of the S&P500. This group also includes the VXO volatility index, calculated based on the amplitude of fluctuations in the S&P100 index. <
Dow Jones Industrial
The Dow Jones Industrial is one of the oldest US market indices; it was invented and began to be used in 1896. The index is considered one of the main indicators of the American economy. It helps investors and stakeholders to assess the market dynamics of the industrial sector of the economy in a simple way.
Its structure is formed by 30 largest industrial sectors, including the famous Apple, Boeing, etc.
When selecting for this index, the company’s impeccable business reputation, stable growth and expression of interest from investors (determined by trade turnover) are taken into account. However, there are no clearly formulated quantitative criteria - the decision is made by a special committee. For an issuer to be included in the DJIA, its headquarters must be located in the United States, and the bulk of its income must be generated here. In addition, it must be a systemically important company, that is, its activities must make a tangible contribution to the country’s economy. And to top it all off, the company's securities must be listed on the NYSE or NASDAQ.
Rebalancing is carried out every few months: if a company no longer meets the criteria, its shares leave the index. They are being replaced by new issuers.
China House Price Index
The People's Bank is responsible for statistics and tracking of housing costs in China. The strong economic growth of the Middle Kingdom has led to the emergence of the “investment housing” phenomenon. Enormous amounts of money have been invested in real estate due to the lack of alternatives - the Central Bank strictly limits any attempts at external private transfers.
Published monthly statistics are the percentage change in the average cost per square meter compared to the previous period. The parameter has two calculation features:
- The weighted average price includes only the cost of housing purchased with a mortgage
- The data does not have predictive values - any statistical information is confidential
Therefore, the indicator is often ignored by investors and speculators. Data enters the economic calendar at 4:30 Moscow time, usually by the middle of the month.
Dow Jones Composite Average
This US index appeared in 1934. It tracks the stock price dynamics of 65 companies that are leaders in their industries. This is an extended index composed of three indices:
- Dow Jones Industrial Average Yield Weighted (DJIYW) - DJIYW is an analogue for the main index, consisting of thirty companies from the DJIA list with high dividend yield. The organizations included in it must have a clearly defined dividend payment schedule and excellent financial performance. The index is weighted by their respective 12-month dividend yield.
- The Dow Jones Transportation Average (DJTA) is a transportation index that has been around for over a century and tracks logistics companies throughout the United States and beyond.
- Dow Jones Utility Average (DJUA) – it consists of fifteen organizations from the utility sector.
The presence of the DJA index allows you to more broadly assess the current state of three indices simultaneously, which may be convenient for certain investors.
House Price Index - India
Statistics and processing of real estate prices in India are carried out by National Housing Bank (NHB), a financial institution 100% owned by the Central Bank. The index, called NHB RESIDEX, is compiled from an analysis of transactions in the largest five metropolitan cities: Delhi, Mumbai, Kolkata, Bangalore and Bhopal.
The index has a relative value tied to 2013, taken as 100 units. Data is published monthly on a special website of NHB Bank with detailed statistics on Indian real estate.
Standard & Poor's 500
The S&P500 index is the best known and most widely used index of all. In terms of its significance, it is analogous to the Moscow Exchange index. Many agree that the S&P500 is one of the best indicators reflecting the situation of the US market. The S&P500 is sometimes considered an “economy barometer,” representing the performance of the US market and serving as a benchmark for many investors. Its calculation is based on the capitalization indicator of issuers.
The index is based on the 500 largest companies by market value that are listed on the NYSE and NASDAQ trading platforms.
In its composition you can see many famous companies: Apple, Microsoft, Walmart, Amazon, COCA-COLA, Mc'DONALDS, Facebook, Alphabet and other legendary companies.
When deciding whether to add a company to the index, a company is checked against the following criteria:
- The organization must be US registered.
- Estimated market value (capitalization) is at least $6.1 billion.
- Free-float size ≥ 50%.
- The company should be operating with positive operating profit for the last four quarters.
- Only common stocks can be included in the index, and they must have large trading volumes (more than 250,000 shares/month) and have a long market trading history.
The structure of the S&P500 index is reviewed once every 3 months at the end of each calendar quarter. Companies that do not meet the criteria are removed from it.
Standard & Poor's 100
This index is calculated according to the same principle as for the 500 corporations in the S&P500 index. However, only companies that have options listed on the Chicago Board Options Exchange can be included in the index.
The S&P100 index is used in trading derivatives instruments - futures and options. In terms of selection criteria, the largest S&P 500 companies with registered options are generally selected for inclusion in the index. The S&P100 index is formed in such a way as to maintain a balance between the ratio of companies from different sectors.
This index is important for speculative traders who are interested in trading options of large companies.
Nasdaq 100
The Nasdaq 100 Index has been calculated since the mid-1980s. It is composed of hundreds of organizations with the largest capitalization (except for the financial sector), and takes into account not only US corporations. The majority of the structure is IT companies.
The index does not include companies from the financial, oil and gas, or mining sectors. The most prominent representatives of the index are: AMD, Adobe, Intel, Netflix, NVIDIA, Tesla, etc.
The following criteria are used to decide whether to add a company's shares to the Nasdaq 100 Index:
- The company must not carry out financial or insurance activities.
- The company's activities must be related to the field of high technology.
- With more than 1.25 million shares outstanding at the time of listing, affiliates must not own more than 10% of the company.
- At the time of listing, the company's share must have an offer price of at least $4, and the listing procedure requires the participation of three or more market makers.
The index is rebalanced once a year, on the third Friday in December after the close of trading. Companies ranked in the top 100 based on annual revisions remain in the index. Those occupying places from 101 to 125 remain if they were in the top 100 according to the results of the previous year’s review. Those who do not make it into the top 125 are excluded, regardless of the previous year’s rank.
The Nasdaq 100 Index is of interest to investors as it is one of the key indicators of the American market.
Nasdaq Composite
The Nasdaq Composite is a capitalization-weighted composite index. It includes over 3,000 securities of high-tech companies, as well as companies with high growth from various industries - biotech, space, aircraft manufacturing, etc., traded on Nasdaq. This index contains approximately one hundred of the largest companies with high market values. The index is maintained and calculated by the Nasdaq exchange; unlike other indices, it is expressed in dollar terms and not in points.
To be included in the index, an organization must meet the following criteria:
- Listing on Nasdaq.
- An index can only include common shares of a company. No convertible bonds, preferred securities, derivatives or ETFs may be included.
- The company must not engage in insurance activities.
The index can include a variety of companies, ranging from world-famous large corporations to little-known small companies. The most famous index participants are: Apple, Autodesk, Cisco, NVIDIA, Google, eBay, etc.
Various investors are interested in tracking the index, primarily those who want to invest in the technology sector.
House Price Index - UK
Several analytical agencies are engaged in accounting and analysis of current prices at which real estate is purchased in the UK: Rightmove, Nationwide Building Society.
An online portal for real estate advertisements owned by Rightmove, a national leader in the number of transactions in this area. Economic calendars include a monthly figure for the weighted average cost per square meter, but experts criticize the calculation method based on demand prices. Of greater interest is a detailed report on trends in different geographic areas of the country.
Nationwide Building Society is a bank that grew out of the world's largest building society, a mutual lending society with 15 million active members. The corporation is the world's largest property developer and mortgage bank, headquartered in London.
Nationwide's House Price Index is published at the start of the month as a percentage change to the previous period. Before the news is released, traders have access to expert forecasts, and if they differ negatively from the actual ones, the pound may fall in the short term against the major currencies and rise on the positive side.
A little later in the week, data appears on the calendar from Halifax Bank of Scotland (HBOS), the region's number one lender by mortgage loan volume. Consistently released optimistic data, expressed as a percentage increase in price, relative to the previous period may cause an ambiguous reaction - from growth to fixation of purchases of the pound, which were speculatively opened on Nationwide's reports.
Government agencies also calculate a housing price index:
- The Department of Community Affairs and the Department of Local Government (DCLG) publish monthly data based on closed (paid off) mortgages.
- The Office for National Statistics produces the HPI, which is calculated using the average house price taken from transactions financed by mortgages, in a monthly newsletter on its official website.
The indicators are a percentage of the previous annual period and are released in the middle of each month at 11-00 Moscow time.
Russell 2000
The Russell 2000 Index is one of America's investment indices, which, like most indices, is weighted by capitalization. Originated in the mid-80s of the last century, it allows you to track the dynamics of 2000 small-cap companies. The most expensive companies have the greatest weight, as well as the greatest influence.
This index assesses the health of US small businesses. The peak of its popularity was in the 90s, the reason for which was strong movements in the share prices of its member companies.
The index contains companies that, as a rule, do not have a globally recognizable brand. An example of part of the list of index companies at the beginning of 2021. can be seen in the following picture.
The economic sectors that make up the Russell 2000 are financials, healthcare, technology, consumer discretionary and cyclicals, industrials, consumer non-cyclicals, basic materials, utilities and energy. At the end of 2021, there were five industries making a significant impact on the index composition, which are presented in the figure below.
This index is of interest to those investors whose investment objects are small capitalization companies.
We can conclude that index monitoring has the following goals:
- Obtaining information about the aggregate dynamics of index quotes.
- Obtaining information and assessing the current situation on the market.
- Long-term study of the investment climate in a specific group of companies, industry or country.
- Obtaining aggregated information about the actions of market participants.
Content
- 1 Mathematical methods for real estate valuation used by statistics
- 2 Australian House Price Index
- 3 House Price Index - USA
- 4 House Price Index - UK
- 5 New home price index in Canada
- 6 House price index in Spain
- 7 Housing price index in Germany
- 8 China House Price Index
- 9 House Price Index - India
- 10 The impact of changes in housing prices on the Forex market
The indicator is calculated by commercial institutions (real estate agencies, mortgage banks) and government statistical agencies. Despite the general principles, calculations can be specified only for new objects, large cities, or take into account the total amount of transactions given by the number of participants (sellers/buyers). They can also be linked to property or households to take into account mortgage pressures, especially relevant after the 2008 crisis.
How to invest in US stock indices
There are two main ways to invest in a stock index: purchasing futures and purchasing ETFs (“ETFs”). US index futures are traded on the Chicago Mercantile Exchange. Before making a decision to purchase futures, you need to remember that futures are high-risk financial instruments; to purchase them, you must have either the status of a qualified investor (“What does the status of a qualified investor provide”) or an open account with a foreign broker, which is not always possible.
A more convenient way is to purchase an ETF for a stock index. Among the advantages are the following:
- Opportunity to invest in all stocks included in the index.
- Relatively low purchase price for ETFs.
- It requires a relatively small amount and lower exchange fees to purchase one ETF per index than to replicate the index yourself by purchasing each share in the index. In other words, buying an ETF allows you to achieve broad investment diversification with small amounts of capital.
Currently, there are various ETFs for a large number of popular stock indices. For example, the S&P500 has the following ETFs:
- SPDR S&P 500 ETF (SPY) is the most popular ETF with a fee of 0.09%.
- iShares Core S&P 500 ETF (IVV) – this ETF ranks second in terms of trading turnover, commission – 0.04%.
- SBSP ETF (SBSP) is one of the funds in Sberbank’s own line.
There are also ETFs for other indices:
- Invesco QQQ ETF (QQQ) is a Nasdaq 100 ETF.
- Fidelity Nasdaq Composite Index Tracking Stock ETF (ONEQ) is an ETF on the Nasdaq Composite.
- SPDR Dow Jones Industrial Average ETF – ETF on the Dow Jones Industrial Average.
- iShares S&P 100 ETF (OEF) – S&P 100 ETF.
- iShares Russell 2000 ETF (IWM) – Russell 2000 ETF.
There is also a wide range of ETFs for sectoral indices.
- Healthcare – Health Care Select Sector SPDR Fund (XLV), Vanguard Healthcare ETF (VHT), iShares US Healthcare ETF (IYH).
- Biotechnology – iShares Nasdaq Biotechnology ETF (IBB), SPDR S&P Biotech ETF (XBI), First Trust Amex Biotechnology Index (FBT).
- Energy – ProShares Ultra Bloomberg Crude Oil (UCO), United States Brent Oil Fund (BNO), United States 12 Month Natural Gas Fund (UNL).
- Financials – Vanguard Financials ETF (VFH), iShares US Financials ETF (IYG), Invesco KBW High Dividend Yield Financial ETF (KBWD).
- Transportation – iShares Transportation Average ETF (IYT), SPDR S&P Transportation ETF (XTN).
The ETF's price curve has a close or exact correlation with the index. To confirm this pattern, we will demonstrate several examples.
Example 1.
Price charts for S&P500 and SPY, a popular fund for this index:
As you can see in the chart above, the blue line representing the S&P 500 index almost completely coincides with the orange line reflecting SPY, an ETF for this index.
Example 2.
Price charts for Nasdaq 100 and QQQ – an ETF for this index. Here you can also see a perfect match:
You can learn more about the parameters and technologies for choosing ETFs for investing with real practical cases from the article “How to choose ETFs.”
The main disadvantage of investing in an ETF is that, in addition to companies with good financial performance and growth prospects, it may also include companies with poor performance results or simply unprofitable.
However, there are options for "smart investing" in an index, where you choose which companies to invest in. This approach involves targeted investments and exclusion from the portfolio of ballast in the form of unprofitable companies that do not have fundamental sources of growth. This approach, firstly, reduces the risk of loss of capital, and secondly, increases investment efficiency.
For example, instead of buying the entire index, you can select the best companies from its composition based on the fundamental indicators of the companies. To do this, you can use the professional investment service Fin-Plan RADAR, where you can select stocks based on their inclusion in the S&P500 or Nasdaq100 indices. Then, using a wide range of filters and ready-made strategies, you can choose companies that are truly interesting in terms of investment attractiveness.
Also, “good” companies can be selected by using the “ETF 2.0” investment strategy. This strategy is based on selecting the best companies from lists of companies compiled on the basis of the structure of certain industry indices. The service allows you to analyze these lists and, using specified selection criteria (service filters), select the best representatives of industry indices. Now the service has about 40 ready-made selections of companies, and their list is constantly expanding.
US IT sector. Choosing a favorite
In this review, we will evaluate the heavyweights of the US information technology sector and select a favorite for inclusion in an investment portfolio.
The sample consists of 4 companies: Apple, Microsoft, Intel and IBM. The shares of these issuers are traded not only on American exchanges, but also on the St. Petersburg Stock Exchange, which means they are available for purchases on an individual investment account.
The sample did not include representatives of the Internet segment, as this is a topic for a separate review. For now, let’s focus on providers of related IT services.
The product line of these companies is not uniform, but in general they can be classified as a single segment with similar business scales and capitalization.
Apple (AAPL)
At the end of the second financial quarter (first calendar year), Apple reported a 25.3% increase in net profit (y/y), to $13.8 billion. Revenue increased by 15.6% and amounted to $61.1 billion.
Sales of iPhones, iPads and Macs fell short of market expectations. In the first case, we have only a 2.8% increase compared to the same period last year. But revenue from the services segment soared by 31%, to $9.2 billion. Apple managed to create a comprehensive Apple ecosystem, which allows us to rely on the services segment as a reliable source of income.
Source: zerohedge.com
Geographically, China shone with 21.4% revenue growth. This is an important area of Apple's business, which competes fiercely with local smartphone makers. A risk factor for sales in China is the high price of Apple devices.
However, this is generally a risk for Apple. In this regard, Apple’s reporting shows a sharp increase in inventories, which exceeded $7 billion in the second financial quarter. This may mean an oversupply of unsold iPhone models in the company’s hands.
Let's note Apple's friendly policy towards shareholders. Tax reform approved late last year allowed the company to repatriate huge amounts of foreign cash at a preferential rate. Some of the funds have already been spent on dividends and buyback programs.
At the moment, Apple's yield is not too impressive 1.6% per annum, but don't forget about buybacks. After the release of the report, Apple announced a new $100 billion buyback program.
Microsoft (MSFT)
At the end of the third financial quarter, the company reported a 35% increase in net profit compared to the same period last year, to $7.4 billion. Revenue increased by 15.6% and amounted to $26.82 billion. A positive forecast was presented for the current fourth financial quarter: revenue is expected to be range of $28.8-29.5 billion.
The “cloudy” direction flashed. Office (belongs to the Productivity and Business Process segment) was able to transfer to the SAAS model - software as a service, that is, by subscription. Office365 has 135 active commercial subscribers and 30.6 million private users. According to the forecast of the investment house Evercore ISI, by 2021 revenue from Office 365 could reach $32 billion.
Let’s not forget about the cloud business platform Azure (belongs to the Intelligent Cloud segment), which is hot on the heels of Amazon Web Services. In the third financial quarter, Azure revenue soared by 93%. Currently, Azure accounts for about 20% of the market compared to 60% for AWS, but at this rate Microsoft can close the gap.
Research firm IDC estimates that public global spending on cloud services will be $266 billion by 2021, up from $128 billion in 2021.
Intel (INTC)
At the end of the first quarter, the company's net profit soared by 32% (y/y). Revenue increased by 9% to $16.07 billion.
The largest increase occurred in the Data Center Group segment. We are talking about an increase in revenue by 24%, to $5.2 billion. There is a transformation from specialization in computer processors to the field of data, artificial intelligence and the “Internet of Things” (49% of Intel’s total revenue in the first quarter).
In addition, the company improved its financial forecast for revenue for 2018 by $2.5 billion, to $67.5 billion.
IBM (IBM)
At the end of the first quarter, the company reported the second reporting period of revenue growth (y/y) after 6 years of decline. The indicator increased by 5%, to $19.07 billion. A 65% increase in sales of the security services segment was recorded, and a 25% increase in the cloud segment.
In recent years, the company has been transforming, moving to a more marginal segment, cybersecurity and data analytics, increasingly moving away from hardware.
Despite this, the company's gross profit margin fell to 43.7% in the first quarter, compared to 44.5% in the same period last year. Intel attributes this to one-time factors. In addition, the corporation did not improve its profit forecast for 2018.
Comparative assessment
Dynamics of financial indicators
In terms of net profit growth, Apple and Intel are leading - about 8% average annual increase in eps over 5 years. IBM, on the contrary, is an outsider with an average annual decline of 4%.
In addition, Apple is the most active free cash flow generator (FCF, operating flows minus capex). The funds received can be used to implement new investment projects and remunerate shareholders.
Accordingly, Apple’s reserves of “cache” and short-term investments are very solid - $72.3 billion. Microsoft is the leader in this regard with $132.2 billion. At the same time, Intel is an absolute outsider with $5.6 billion.
Multiplier valuation
According to market multiples, IBM is the cheapest within the sample. For example, the company's P/E ratio is 12.1, with a median value of 16.6 for the group of comparable companies.
At the same time, IBM's dividend yield is a quite respectable 4.4% per annum with a quite normal (low) level of payments from net profit of 49%.
Forward multiples (adjusting future earnings, Reuters data) paint a similar picture. I note that according to both types of multipliers, Microsoft is the most “expensive”.
To confirm the adequacy of the conclusions obtained from the multipliers, let’s look in more detail at the financial indicators of the companies. The fact is that low (high) values of multipliers are often justified by weak (strong) fundamental characteristics of the enterprise.
IBM's relatively low operating margin and high level of debt, as well as weak expectations for earnings per share growth, clearly justify the company's formal undervaluation by multiples.
In this regard, Apple and Intel are the most interesting. Apple's PEG (P/E adjusted for earnings per share growth expectations) is the lowest at 1.11. All other things being equal, such a PEG value is in favor of buying shares.
Estimated growth potential
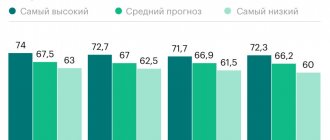
Let's see how undervalued the shares are relative to the median analyst targets (12 months). According to this criterion, Apple is not that interesting (+6% potential relative to the closing level on May 24, 2018). At the same time, IBM looks the most undervalued (+16%).
Conclusion
Based on a combination of factors, Apple looks the most interesting, but here the levels are clearly too high. For purchases I would expect $165.
IBM is still a stagnant option in terms of fundamental indicators. But here there is a clear underestimation of the analysts’ consensus target.
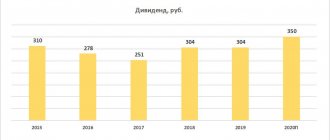
In principle, we have an interesting dividend story that can be added to an investment portfolio at current levels. The nearest ex-dividend date is August 8. The expected quarterly payout is $1.53 per share.
IBM dividend forecast from Reuters
Oksana Kholodenko, international markets expert BCS Broker
What American indices can be bought on the Moscow Exchange
Qualified Investor status is required to purchase any ETF traded on US exchanges. However, an investor who does not have such status can purchase an ETF on the Moscow Exchange. There are 12 stock ETFs traded here, of which we can highlight the TSPX ETF (ticker: TSPX) and TECH ETF (ticker: TECH) of the issuer Tinkoff Capital Management Company. The first TSPX ETF invests in 500 companies of the S&P 500 index, the TECH ETF invests in the top 40 information technology companies. Both ETFs feature reasonable fees of 0.79%. More detailed information about the parameters of the instruments can be found on the ETF page in the Fin-Plan Radar service.
In total, at the time of publication of the article, 27 ETFs for the American market are traded on the Moscow Exchange. The entire list can be found in the Service Assets - US Stock ETFs section. Select an ETF depending on your investment goals and the specified criteria of replication, dividends, industry, etc. You can use the “Select etf” search service.
Home Price Index - USA
The U.S. Department of Housing and Urban Development tracks home prices by calculating the average cost of purchased single-family home ownership with a mortgage, according to data provided by Fannie Mae and Freddie Mac. These debt agencies receive funds from the US government to support social real estate programs, so their activities are under government supervision and control.
The index is calculated using the repeat sales method, essentially representing the change in the cost of reinvesting a loan.
Indicators are published monthly (beginning of the third decade) at 16-00 Moscow time, representing a percentage change compared to the previous period. Despite the presence of analysts’ forecasts, traders pay little attention to this data, tracking other indicators: issued construction permits, sales of real estate on the secondary market, the number of concluded contracts for new buildings.
The most accurate estimate using the repeat sales method is the Case-Shiller Index, named after its two creators, one of whom is Nobel Laureate in economics Shiller. It tracks changes in the value of existing homes in 20 major US metropolitan areas. The complexity of the calculation leads to a large lag in the indicator, so traders and investors do not take this data into account when making forecasts and drawing up positions.
Residential Price Index is a housing price index from FNC Inc, which operates a platform for accounting for collateralized mortgage property. The indicator is calculated based on incoming information about the collateral price of real estate, due to the fact that the largest banks, real estate agencies and developers use the software of this company.
RPI is calculated monthly based on a hedonic approach, without taking into account the cost of houses sold due to default; the data is published on the company’s website.
Conclusion
Stock indices are one of the important tools at the disposal of investors. The main goal that is achieved with the help of this tool is to monitor the situation or, as investors also say, temperature, the entire stock market or industries of interest. The family of American market indices occupies a special place in the world hierarchy due to its size and, of course, its “authority”. Monitoring the dynamics of changes in certain indices allows you to make a judgment about the current state of both the entire US economy and its individual sectors, and helps in making one or another investment decision.
The presence of an ETF for stock market indices allows its participants to invest in a financial instrument that allows them to diversify their investments at a lower cost than by independently repeating the index. However, you need to remember that buying futures or investing in an individual index ETF does not allow you to select only the best representatives of the index, but forces you to purchase the entire set of shares of the companies that make up it, both “good” and “bad”.
The professional Fin-Plan RADAR service will help you select companies that have excellent indicators in terms of fundamental analysis. We share our methods for finding reliable assets, including using the service, at our open webinars. You can become a participant in the next open lesson by signing up using the link.
Good luck with your investment!
House price index in Germany
The German economy is called the locomotive of the European Union, whose national real estate acquires special importance after the separation of Great Britain. As part of the financial world leaves London's business center en masse and moves to Frankfurt, property transactions and rental rates are becoming an indicator of the EU's investment climate.
The national house price index EPX is calculated using the EUROPACE platform, which records 15% of actual home purchases by individuals. The indicator represents the smoothed average cost per square meter for a period of three months, reduced to the prices of the 2005 base, taken as 100.
The index is published in relative units monthly, separately for three separate indicators
- Apartments
- New buildings
- At home
The economic calendar contains the resulting value for three indicators, which is a percentage monthly change compared to the previous period.
The collection and processing of statistics is carried out by Hupport AG, the owner of the EUROPACE software.