Oil price forecast for 2021 (by month) and for 10 years (by year) for marker grades Brent, Urals, WTI. Expert opinions and trends from leading financial and resource organizations.
In 2121, the situation with coronavirus should stabilize, and an agreement on production cuts will depend on additional OPEC agreements. The main trend for the first quarter of the new year is an increase in prices; Russia and Kazakhstan were even allowed to increase production at the latest negotiations. But in March, quotas for other countries will begin to increase to 2 million barrels per day, so the rate is expected to fall.
By the end of the year, oil prices are likely to fall. The general downward trends continue, the economy is entering the phase of another crisis, and the need for hydrocarbons is decreasing. The transition to alternative energy sources, the introduction of cold fusion technologies, and the shift of automakers towards electric vehicles and hybrids will influence trading.
Oil forecast for 2021 in the table by month:
| Brent | Urals | |
| January | $55,20 | $54,98 |
| February | $64,33 | $62,55 |
| March | $65,17 | $62,97 |
| April | $67,62 | $63,30 |
| May | $68,02 | $64,12 |
| June | $71,33 | $69,88 |
| July | $40,11 | $39,14 |
| August | $53,66 | $49,31 |
| September | $47,10 | $45,88 |
| October | $40,33 | $38,12 |
| November | $37,11 | $36,01 |
| December | $35,20 | $34,03 |
In general, the maximum oil price in 2021 will not exceed $65-70 per barrel. The average rate forecast is $45-51. A number of experts are making optimistic forecasts due to the recovery of production from the pandemic crisis, however, excess production and accumulated reserves are unlikely to allow hydrocarbons to rise in price sharply.
At the same time, the two-year OPEC agreements have built a system of guidelines, so the oil market should be stable.
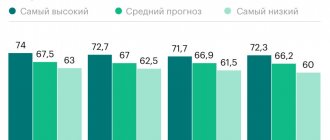
Forecast of large organizations
Ministry of Economic Development
In 2013, the Ministry of Economic Development predicted prices from 130 to 158 dollars per barrel in 2021, which today looks truly ridiculous.
The new macro forecast promises rates of $43.4 per barrel in 2021, $45.6 in 2022 and $46.5 by 2023. Accounts Chamber
Increase to 50 dollars per barrel. And in 2022 - even up to $55. But general “decarbonization factors” will not allow a return to 2017-2019 prices.
International Monetary Fund (IMF)
The IMF predicts for 2021 a decline in prices to $37.54 per barrel and an overall drop in global GDP of 5-8%. The IMF's five-year forecast is an increase to $57 by 2024-2025.
The World Bank
The average World Bank forecast for 2021 is $44 per barrel of Brent oil. The organization is looking at increased consumption, although it notes the impact of the pandemic. In 2022, WB experts call rates up to $50.
Organization of the Petroleum Exporting Countries (OPEC)
The OPEC Secretariat makes contradictory statements every month. In general, demand is expected to increase, which is why quotas are being increased. Demand will be 5-6 million barrels per day higher than in 2021. Of course, the price will be “eat up” by increased production.
International Energy Agency (IEA)
In 2021, demand for petroleum products will reach 97% of the 2019 level. Low prices for WTI $40/barrel, Brent $42/barrel will not be an incentive for oil producers, especially for American shale oil.
Bloomberg
Bloomberg points to rates of $44-45 per barrel in 2021. Further forecast implies a downward trend in oil prices. After 2025, electric cars could destroy oil. Agency experts have repeatedly warned that oil could fall to $20 per barrel or even lower.
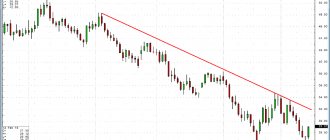
A simple strategy using Moving Averege
Using Moving Averege involves combining a “live” oil price chart with a moving average.
The technical analysis strategy in this case is simple:
- if a breakdown occurs when the MA line is located below the quote chart (that is, the price breaks through its average from bottom to top), there is a signal for an increase - a buy deal should be opened;
- if the breakdown occurs from top to bottom (that is, the MA line lies above the quote chart), a downward signal occurs, calling for opening a sell trade.
The advantages of a strategy based on MA are ease of use and high efficiency in case of pronounced trends. The main disadvantage is the frequent generation of false signals.
A breakout of the MA curve precedes any change in the trend, but often the change in rate occurs with a delay (the exponential curve is below the chart, but the price falls, and vice versa).
Recommendations for working with the indicator:
- experiment with the type of moving average, changing the number of time periods of averaging depending on the volatility of the asset and the trading horizon;
- make a decision to open a position only if after the signal the trend has not changed within a set time;
- vary the size of the trade opening interval in search of the optimal option.
The Moving Average technical indicator is widely used by both beginners and experienced traders.
More complex strategies use moving averages built at the maximum and minimum prices, or pairs of moving averages with different periods.
Experts' forecasts on the oil market
Elvira Nabiullina (Head of the Central Bank)
According to information from the press, Nabiullina maintains a “conservative premise.” Her oil forecast for 2021 is $50 per 160-liter barrel, and everything else will depend on OPEC+ and energy demand.
Alexey Kudrin (Head of the Accounts Chamber)
Back in October, Alexey Kudrin predicted a return of oil to $40. But in the future, the economist predicts a decrease in rental demand.
Stepan Demura (financial analyst)
The expert predicts that in 2021 oil will lose price very sharply for financial reasons. Demura's position is that a crisis is approaching, so the demand for gasoline will fall due to the lack of money for essentials.
Trend and moving average
MAE, or exponential moving average, is one of the most common trend-type technical indicators (graphically: a curve that “averages” the quote values of a given asset). The main purpose of the indicator is to track trend changes.
Trend (from the English Trend, or tendency) – the direction of the prevailing movement of indicators; in relation to technical analysis – the direction of movement of prices or index values. The moving average cuts off random (high-frequency) fluctuations in these indicators, highlighting only low-frequency activity represented by long-term cycles.
A signal to change the current trend is the intersection of the MAE curve of the exchange rate chart (the so-called breakdown).
If the moving average is located below the price chart line, the trend is considered upward (best conditions for buying); if the MAE rises above the price chart, the trend is considered downward (the best conditions for selling).
Although theoretically you can trade both in the direction of the trend and against it, the simplest strategy is to trade “with the trend” (buying in an up market and selling in a down market).
For 10 years
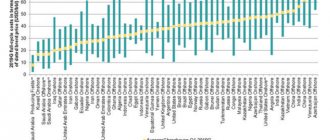
Speaking about oil price forecasts for 10 years, different sources differ in their assessment of the situation. The Ministry of Economic Development promises an increase in demand by 1.22 times. The International Economic Agency predicts a reduction in oil production by up to 47% by OPEC countries. In general, most Western experts agree on the end of the “golden era of oil,” while Russian experts support the idea of a sudden rise in the price of black gold.
Table for 10 years by year:
| Year | Brent oil price |
| 2021 | $46,85 |
| 2022 | $48,15 |
| 2023 | $45,33 |
| 2024 | $51,12 |
| 2025 | $59,40 |
| 2026 | $55,21 |
| 2027 | $45,74 |
| 2028 | $37,66 |
| 2029 | $36,96 |
| 2030 | $40,73 |
After 2024, short-term growth will be caused by a lack of investment in oil production. However, the oversupply will still have an impact unless the world economy is affected by a major military conflict, another epidemic or environmental disaster.
Analytics for WTI Oil Futures
Weekly options analysis of the Forex market Dmitry Zeland – 03/13/20212
We bring to your attention an option analysis of the main currency pairs: EUR/USD, GBP/USD, AUD/USD, USD/JPY, USD/CHF, USD/CAD, stock indices S&P 500, Dow Jones Industrial Average,…
The Moscow Exchange and RTS indices continued to rise by the end of trading Elena Kozhukhova - 03/12/2021 The Moscow Exchange and RTS indices continued to rise by the end of trading due to a number of corporate stories, despite the deterioration of sentiment abroad. By 18.05 Moscow time, the Moscow Exchange index increased by...
Futures and volume analysis of key market assets Vitaly Shevchenko – 03/12/2021 We offer you a comprehensive analysis of the USDX dollar index, the main currency pairs: EUR/USD, GBP/USD, USD/JPY, AUD/USD, USD/CAD, DAX stock indices, Nasdaq 100, as well as...
Parameters of laboratory oil analysis
The determination of sulfur content in oil is carried out using energy-dispersive X-ray fluorescence spectrometry. The technique is described in GOST 32139-2019. Sulfur content is regulated by industry standards and is also important when choosing a method for refining oil. The study takes no more than 5 minutes and allows you to accurately determine whether the sulfur content complies with the established regulations. The study requires an X-ray source and detector. Such research refers to spectrometry methods.
The water content in oil is determined according to GOST 2477-2014. For laboratory analysis, solvents that are immiscible with water are needed, for example, xylene, toluene, isoctanes. Using a distillation apparatus, you can separate the water into a special receiver and determine its quantity.
The content of chloride salts in oil is determined in accordance with GOST 21534-76. For this purpose, indicator or potentiometric titration is used.
The density of oil can be used to judge its composition. High density indicates a high content of aromatic hydrocarbons, low density indicates a predominance of paraffin hydrocarbons. Low-density crude oil is optimal for processing and allows obtaining high-quality petroleum products.
The fractional composition of oil is determined by the method of determining the boiling points of all components. The technique is described in GOST 2177-82. The following fractions are distinguished: hydrocarbon gas, gasoline, kerosene, diesel, fuel oil, vacuum distillate, medium and heavy oil fraction. This analysis makes it possible to determine which petroleum products a particular sample is suitable for.
Mechanical impurities are determined according to GOST 6370. For this purpose, samples heated to a certain temperature are filtered. To isolate some impurities, vacuum filtration is used.
To determine the amount of hydrogen sulfide, methyl and ethyl mercaptans, the gas chromatography method is used. The determination method is described in GOST R 50802. Plasma photometric detectors are used to accurately assess the results.
Another important characteristic that affects the storage, transportation and refining of oil is saturated vapor pressure. This indicator characterizes the content of hydrocarbon fractions with low boiling points. Knowing this indicator, it is possible to calculate the loss of oil volume during its transportation and refining.
Also, oil sediment is studied in laboratory conditions. This allows you to determine which third-party components are contained in the sample and in what quantities.
A comprehensive study of crude oil samples allows us to determine what type of processing they are suitable for and what quality of petroleum products can be obtained. Oil from the same field, extracted at different depths, can differ significantly in composition. That is why many samples are subject to laboratory testing.
Peculiarities of the oil market
For those who prefer to work over long periods of time, perspective is especially important. And oil is extremely controversial in this regard. On the one hand, this product will be decisive for the existence of the planet’s economic system for a long time. On the other hand, humanity is struggling to find a way to stop consuming that part of the raw materials that goes into fuel production.
Petroleum-based energy sources are used in the production of electricity (usually fuel oil) and in transport.
In the first case, alternative energy sources (so-called green energy extraction methods) are used as a replacement for power plants using fossil fuels. This is mainly:
- wind power plants;
- photovoltaic generation.
So far, both of these methods of generating energy are uncompetitive due to high capital costs, however, technologies are increasingly being improved and the efficiency of installations is increasing. At the moment, the efficiency of solar panels has jumped by 46% (from 18%), and the cost of “wind kilowatt” in the projected wind farms in the North Sea promises to drop below 10 euro cents per kilowatt hour. And this is already a zone of direct competition with thermal and nuclear generation.
In the second case, in transport, electric vehicles are being actively introduced.
Usually everyone remembers the famous Tesla. However, an overwhelming number of manufacturers present their electric car models. The price of the models is permanently decreasing (Tesla Model 3 at retail promises to cost no more than $35 thousand). Analysts predict that as battery production becomes cheaper, electric cars may fall in price below $20 thousand, which will displace cars with internal combustion engines.
These two trends put pressure on oil, lowering its rate. In the future, they may completely overturn it when the extracted volumes one day do not find their buyer. However, this will happen beyond the horizon of visible events. In the meantime, the oil workers have prepared and implemented their “knight’s move,” and its name is shale oil (the United States has set its sights on producing it).
Interestingly, the direct cost of its production, on the one hand, is higher than that of traditional oil. But this is compensated by its prevalence. And the technologies for its extraction are constantly being improved and cheaper. In addition, the oil transportation infrastructure is being developed (both by tankers and via pipelines), which, together with the anti-monopoly measures taken (such as the 3rd Energy Package of EU countries), can lead to a reduction in prices for using this transport infrastructure.
Qualifying ETFs
| Name | Ticker | Price | Change % | Volume | Time |
| United States Oil | USO | 44,35 | -0,56% | 4.64M | 04:00:00 |
| ProShares UltraShort Bloomberg Crude Oil | SCO | 6,35 | +0,79% | 2.09M | 14/03 |
| ProShares Ultra Bloomberg Crude Oil | UCO | 62,68 | -0,87% | 920.07K | 04:00:00 |
| United States 12 Month Oil | USL | 22,72 | -0,44% | 73.25K | 14/03 |
| iPath Pure Beta Crude Oil Exp 18 Apr 2041 | OLEM | 12,58 | 0,00% | 0 | 28/07 |