Greetings, colleagues. Are you familiar with the Fibonacci Fan tool from the Fibonacci category? As for me, I’ve been trying to use this tool for 5 years now, I’ve accumulated solid experience with which I must share (otherwise it will deteriorate due to the statute of limitations).
The instrument is extremely attractive, like most other Fibo instruments, and is designed to help in searching for corrections. It has its own subtleties in interpretation, but it’s okay if you don’t know, read and find out, if you know, reading the article cannot be called superfluous either.
How to use the Fibonacci fan
You can install the Fibonacci fan on a price chart, like any standard tool of the MetaTrader 4 platform, from the toolbar or the main menu.
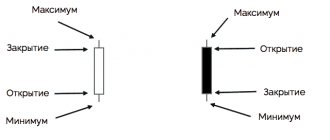
To correctly construct a fan, you must, first of all, determine the price maximum and minimum for the selected period (taking into account the trend). The main line (trend line) is drawn from minimum to maximum in an uptrend, and from maximum to minimum in a downtrend.
By default, three lines are drawn from the starting point, corresponding to the Fibonacci ratios of 38.2%, 50% and 61.8% (added as 0.382, 0.50 and 0.618, respectively). The principle of these lines is similar to Fibonacci levels - they are regarded as levels of a likely price rebound.
Unlike horizontal Fibonacci levels, the fan lines are located at an angle to each other, which is the definition of additional correction levels. Because of this, working with a fan is somewhat more difficult than with regular levels, since it requires constant price checking.
To draw a Fibonacci fan, you need to select this object and indicate the starting point on the chart. After this, without releasing the mouse button, you should draw a trend line of the required length and direction.
In this case, auxiliary parameters will be displayed next to the end point of the trend line: the distance along the time axis and the distance along the price axis from the starting point, as well as the angle of inclination relative to the horizontal line drawn through the starting point, on a one-to-one scale.
There are three points on the main trend line that can be moved with the mouse. The first and last points are intended to change the length and direction of the line. Using the midpoint (move point) you can move the Fibonacci fan without changing its size or direction.
For the Fibonacci fan, the settings for constructing trend lines can be changed.
This object also has the following parameters:
• Date/Value—coordinates of the starting point of the trend line (date/value of the price scale);
• Date/Value—coordinates of the end point of the trend line (date/value of the price scale);
Read about Fibonacci lines.
Features of using the Fibo fan
There are some features of using the Fibonacci fan that should be considered before starting to work with this tool.
Firstly, the price does not always consistently stop at each of the Fibo levels.
Secondly, the fan levels are “a springy trampoline sheet, not a concrete wall.” The price can form false breakouts of levels, trade them, but still rebound.
In this regard, it is better to use the Fibonacci fan as an additional trading tool in your strategy to confirm the correctness of trade entries.
If the trading tactic is based on the Fibo fan, then it is necessary to add additional signals to it, for example, candlestick patterns. If, for example, a “bullish engulfing” has formed at one of the levels of the ascending Fibo fan, then this is a double signal of a price reversal upward, and you can open a buy deal.
How fans work
The Fibonacci fan works based on one of the key principles of technical analysis - after a fall or rise, the price, as a rule, will return to the initial level.
At the same time, it will definitely cross the support and resistance levels. If after the correction the price crosses the levels and the movement towards the trend continues, then a correction of the fan is necessary, since the local extremum has changed.
If you use the Fibonacci fan, then you can use three tactics to enter the markets:
— Enter with the trend.
The signal for you will be a special formation. For example, you decide to open a bullish trade, then the trend on which the fan is built should be upward. Next, the price bounces off one of the levels, and then one of the trend candles closes above 0.382.
Stop loss for this position should be set at the level of 0.618 or at the minimum of the correction. Take profit is determined by the level of volatility of the pair used for Forex trading. You can also use trailing stops and simultaneous entry with several lots at once.
Using this tactic brings a stable, but less profitable result, since it requires the presence of a stable trend.
— Define a grid of pending orders.
We place a grid of pending orders, that is, we do not wait for the price to cross the lines from above. We set deferred buy limits at fan levels. In this case, it would be excellent for them to set the stop loss at 0.764. And then we carry out the activated positions manually using the trailing stop technique.
This tactic is more aggressive, but brings greater profits.
— Combine data from the fan with Wulf waves and other possibly compatible techniques.
I advise you to read the article about Fibonacci trading.
The concept of collective intelligence
The fact is that any of the technical tools requires rearrangement to the newly developed market situation. You see, what happened “yesterday” is not entirely relevant “today”, and the absolutely wrong assumption will be “tomorrow”, if we do not operate with newly developed circumstances...*
Video: Fibonacci Fan – MetaTrader terminal indicator – how to use it and its settings.
Not only in trading, but also in any other field of activity, in order to make it easier and clearer to understand the current situation, condition, principle, action, position, condition, consequences or circumstances, all you need to do is mentally reduce or increase the conditions of this situation . For example:
Our character has two very ordinary lighters for lighting cigarettes. And since they are cheap, he can easily give one of them to a colleague on the team. In this situation, we understand that our hero is acting at the expense of his budget (after all, someday he will still have to spend money on a new lighter). Yes, it’s a small thing, but it’s a fact, it’s a stubborn thing, and it can’t be disputed; the damage is present. It is not significant, but a fact is a fact.
Receive free signals on the stock market and futures. You don’t need to register anywhere, replenish your account – the same. Just subscribe to our pages and receive quality information quickly and with a guarantee.
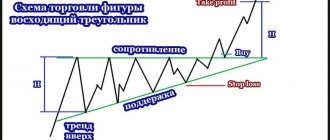
Trading strategy based on Fibonacci fans
The procedure for using the Fibonacci fan in trading is as follows: Apply the Fibonacci fan to the uptrend.
The price breaking through the first line of the 38.2% fan from top to bottom is a signal of the beginning of a correction. That is, there is a possibility that the price may rebound from this or subsequent lines and continue the current trend.
The price may fluctuate for some time between the 38.2% and 61.8% lines. The price crossing the 61.8% level may signal a possible trend reversal. It is also worth taking into account that the breakout point of the 61.8% line can be both the starting point of a new trend and the corrective bottom of the current trend.
Often, such signals are false. To filter them, you can add another level 0.764 (76.4%) to the fan. To do this, you need to double-click the main line of the fan, select “Fibo Fan Properties” using RMB and set the desired level in the “Fibonacci Levels” tab.
If the price crosses this level, the likelihood of a new trend forming increases significantly.
You might be interested in reading about Fibonacci levels.
Video description of the Phi fan
Watch the video about the Fibonacci fan (how to use it, how to build it).
In conclusion, I must say that it has been noticed that many traders avoid, or even fear the fibo fan, due to a misunderstanding of its use, and maybe even consider it too complex a technical analysis tool. I hope that after studying my article, there will be no questions left regarding the use and application of the Fibonacci fan in trading on the Forex market, and thanks to it, you will be able to make even more profit than now.
Still have questions? Let's continue the conversation in the comments, but in general, that's all I have. Until new articles.
Fibonacci Extensions for MT4
Fibonacci Extensions, also called Fibonacci Extensions in Forex, are an analysis tool that allows you to set goals as well as trade against the trend. The Fibonacci extension method allows you to find the price points that price is most likely to move towards, and even reverse!
These price levels are set according to a chart of Fibonacci extensions against highs and lows, which take into account previous price movements to use the Fibonacci extension in line with the trend.
How to build a Fibonacci extension?
- Select the Fibonacci extension
on MT4. - Find the last trough or peak
(X) and click on it for the first time. - Click a second time on the last peak or trough
(A) - Keep the mouse button pressed
- Release the mouse button on the last trough or peak
(X)
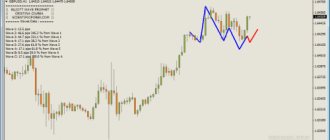
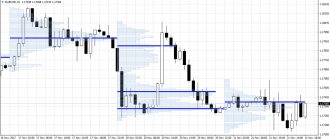
Source: Admiral Markets MetaTrader 5. GBPUSD, GBPUSD, M15 chart, July 27, 2021 – July 28, 2020, as of 11:30 (GMT) November 22, 2021. Please note: data presented refers to past performance and are not a reliable indicator of future performance.
The example above clearly shows a quasi-exact test of the 127.2% Fibonacci extension before the reversal.
Fibonacci Extension Strategy
By plotting Fibonacci extensions, you will immediately see on your trading chart the Fibonacci levels associated with the following percentages:
✔️ 127,2%
✔️ 161,8%
✔️ 261,8%
✔️ 423,6%
This Fibonacci method indicates interesting price levels for potential profit taking. These extensions represent levels beyond the price level of the last peak or trough.
Fibonacci extension levels are used to calculate how far a trend can go, usually after a correction has completed, before reversing, and thus to determine the most attractive possible exit/profit taking levels.
Now you know how Fibonacci retracements and extensions work. But this is all just theory, the best way to progress in Fibonacci trading in Forex and master this new knowledge is to start practicing on a risk-free demo account.
START TRADING FIBONACCI
But that's not all - Fibonacci even allows you to analyze time!
A selection of strategies for trading using Fibonacci levels
Rebound strategy for turbo options
The strategy does not use indicators, and entry points are selected on the minute chart. There is no point in looking for trends on such a timeframe; they are too short-term; it is enough to limit yourself to impulse movements.
The idea is based on the fact that an impulse is always followed by a rollback; with a correction depth of 38.2%, 50.0% or 61.8%, there is a high probability of a chart rebound . This bounce takes a few minutes to form, but when working with turbo options, it is enough to make a profit.
You need impulse movements that develop almost at an angle of 90⁰. As soon as it is completed, Fibo levels are extended to it. A rebound is considered to be touching the line and closing the candle above it (after a bullish impulse) or below the line (during a bearish movement).
The expiration period is set to 1-2 candles.
With more aggressive trading, you can try to buy an option when it touches the 38.2% level, but there is no guarantee that the candle will not close behind it. A conservative trading option is preferable.
Working hours depend on the type of asset and the payment from the broker. If payments do not change during the day and remain above 80%, then:
- You can work on cryptocurrencies both during the day and at night. There is no concept of a “trading session” in the crypto market; impulses are formed both day and night;
- For currency pairs, sessions are selected where maximum liquidity is observed. For EURUSD, for example, these are European and American trading sessions.
It is not advisable to work at night and at the opening of the trading week. Gaps may form, and confusion reigns on the minute chart during such periods.
Fibonacci Method
In this Fibonacci strategy for binary options, Fibo levels themselves play the role of an auxiliary tool. The work is carried out according to the trend on higher timeframes, so deals are rarely concluded.
To determine the priority direction of trade, standard indicators are used:
- RSI (on D1 timeframe) with a standard period . Oversold and overbought zones are not taken into account; a level of 50 is added to the oscillator and the position of the indicator line relative to this “watershed” is assessed. Crossing the line upward means that only Call options are purchased, downward - only Put options;
- on H4 EMA100 and SMA150 are added , their position relative to each other is taken into account. If EMA100 is above SMA150, both lines have an upward slope, this confirms the priority of working in Buy.
After receiving a signal from the RSI, go to H4 and check the fulfillment of the condition using the moving averages. If it is fulfilled, we proceed to search for a trend wave and extend the Fibo levels to it.
A trend movement is considered to be a wave of at least 100 points in size (for GBPUSD) in the direction of the expected trend. To identify extreme points, you can use the fractal indicator or determine them visually.
Fibo levels are stretched by this movement, a reversal of the chart is expected from the zone limited by the levels of 38.2% - 61.8%. The end of the correction is considered to be the closing of the candle below the level of 23.6%. It is advisable to wait until the candle completely exits the 38.2% – 61.8% zone, that is, so that both the body and the shadows are behind 23.6%.
If a large candle is formed and, simultaneously with the exit from the 38.2% – 61.8% zone, the Close price is below the 0.0 level, then you can immediately buy the option. The expiration date is selected for each currency pair. If a candle with a small range is completely closed beyond the 23.6% level, but has not reached 0.0, then expiration can be set to 5-10 candles.
If the Close price of the signal candle goes beyond 0.0, it is considered that the trend movement has already resumed and expiration is reduced to 1-3 candles.
For bullish trends, the rules are reversed.
Fibo + Stochastic strategy
Another indicator strategy based on Fibonacci levels, in which indicators are used to determine the trend, and Fibo lines allow you to determine the zones in which the end of the correction is most likely. The principle is the same as in the previous vehicle, but the set of tools changes.
In addition to Fibonacci levels, you will need:
- “heavy” simple moving average with a period of 120; when working on H1, it averages the price over a week;
- Stochastic (13, 5, 3 or similar parameters).
If the chart of a currency pair is above the moving average and the moving average line is directed upward, then Put options are not bought. Call options are purchased at the end of corrections.
In the described scenario with a bullish trend, you need to get a clearly visible upward wave, the Fibo lines stretch to it. The turning point may form in the range of 38.2% – 61.8%. Since the very fact that the chart touches the level of 38.2%, 50.0% or 61.8% is not enough, an additional filter is introduced - the Stochastic oscillator.
If the price has entered the range of 38.2%-61.8% and a reversal is emerging in this area, then the intersection of the Stochastic lines in the oversold (Call options) or overbought (Put options) zone gives a signal to enter the market. Since the work is carried out according to the trend, you can play it safe and set the expiration to 5-10 candles or more. If the forecast is correct, this will allow an upward movement to develop and by the time of expiration the option will be “deep in the money”.
According to the trend, several cycles of trend wave-correction-trend continuation are formed. If one deal has already been concluded, then the option for the next entry into the market is considered only after updating the previous trend high.
This cycle continues until the trend changes or the flat begins.