The financial market knows a considerable number of real professionals and gurus, or simply those who are familiar with trading. Traders who have achieved the desired financial success in the foreign exchange market create original Forex strategies and teach them to beginners, which allows them to continue their great work.
Constant training in current trading strategies is the main task of a Forex trader. After all, you will never move forward without improving your skills.
One of the most popular trading methods was invented by Larry Williams. We will discuss it in this article.
Main features of the strategy
The trading method suggests is limited to speculation on M5 or M15. The second timeframe is aimed at those who prefer a calmer method of trading compared to the five-minute chart. The same qualities are required from the trader as in other scalping methods:
- ability to concentrate and concentrate on what is happening
- ability to make quick decisions;
- sense of the market, because on the M15, and even more so, the M5, it is the internal sense of the market trend that comes to the fore in importance.
The author called the trading method the “Three-bar system of highs and lows.” According to Williams, guided by strategy, he was able to consistently enter the market to make more than 30 profitable trades in a row.
The essence of the Larry Williams system and recommendations for work
Despite the fact that Williams determined key levels on higher time intervals, trading could also be carried out intraday. The trade could have been open for several hours or days.
The entire movement of the chart can be divided into flat zones, when the price moves in a relatively narrow range, and trend areas that connect these zones.
Flat zones are highlighted.
Larry Williams' trading system involves the use of 2 candlestick patterns:
- Inside bar – it is also used in Price Action. The pattern consists of 2 candles, the first one with a large body and small shadows is called mother, the second is called internal. The inner candle must be completely within the range of the mother candle (the distance between the High and Low of the previous candle). It is desirable that the inner candle has a small body; the shadows may not extend much beyond the mother candle. If the mother is 10 or more times larger in size than the internal one, we do not take the signal into account.
- An outside bar resembles an absorption, but we are interested in the very fact that the next day the market has decided on the direction of movement.
Larry Williams' strategy uses both of these patterns in combination with the levels built through the extremes that we discussed in the previous section. Williams considered the inside bar itself not as a trend reversal, but as a section where a set of positions occurs before continuing the movement.
It is recommended to enter this pattern with pending orders; they are placed at a short distance from the high/low of the inside bar. Larry Williams' strategy provides for quick execution of a pending order. If this does not happen on the next 1-2 candles, then it is better to remove it.
An example of placing orders behind an inside bar.
Larry Williams' original trading strategy does not focus on this, but an inside bar can also be a reversal if it is based on a strong support/resistance level .
In the example in the screenshot above, everything went as Williams indicated - a small correction after a strong movement and its continuation. So within a few days, both trades would have turned out to be a solid profit.
Indicators
Although the trading method refuses additional indicators, it is impossible to completely eliminate the use of analytical tools. However, Williams almost succeeded. The trading system uses only one indicator - the moving average.
We need to build two lines:
- Period 3, build based on the minimum of candles, the construction method is selected Simple;
- Period 3, build according to the maximum of candles, the construction method is selected Simple.
Additionally, it is necessary to set the appropriate line color. The color must be chosen according to your taste, so the main criterion is ease of perception and aesthetic appeal.
Larry Williams' Simple Intraday Trading Strategy
All Williams methods are applicable to small time intervals. One of his strategies, based on a pair of moving averages and local highs/lows on 3 candles, worked well in the past on H1.
To work on the chart you need to add 2 MA:
- EMA indicator with a period of 3, will be calculated based on High prices;
- EMA3, but calculated at Low prices.
We get a Forex channel in which the price moves most of the time. You can add an EMA with a long period, for example, 20, and use it to determine the direction of the trend. This Larry Williams strategy requires working with the trend, but does not indicate exactly how it should be determined, so any method can be used.
Moving averages form a channel, signals are received in the form of a rebound of the chart from its borders. The target is the opposite border of the channel (moving average).
Arrows indicate entry points and directions.
The main problem of the TS is the number of false signals and this is due to the period of moving averages. The market is too volatile and signals come too often; many candles have a range comparable to the width of the channel. Don’t forget - Larry Williams’ trading strategy was created for working with futures; it was used on Forex later.
Entry and exit rules
The rules for entering the market are simple. You must buy an asset if two conditions are met:
- the value of the asset has reached the 3-period moving average, which is set to the minimum;
- the presence of a pronounced upward trend.
You should exit the transaction as soon as the value of the asset reaches the 3-period moving average, set at the maximum. If a trader is looking for signals to sell, he must look for mirror opposite conditions. Williams additionally stipulates: one must focus exclusively on local trends. If the trend is aimed at increasing prices, then you need to enter the market with a purchase. If the trend is towards a decrease in price, you need to enter the market by selling.
The trend and its reversals are determined on the chart using moving averages. When turning points appear, you can see a change in the movement of the lines themselves. This means that the local trend is changing, therefore it is necessary to switch from purchases to sales, or vice versa - from sales to purchases.
Most often, a trend reversal can be seen using a separate candle. If this happens, you must skip this signal. It's still fuzzy. We must wait for a clearly expressed, clear signal of a change in trend.
The trader is required to follow the trend that is formed by the market. There is no need to try to predict a future reversal, or try to play against the trend. Strategies that require the trader to perform these actions are more dangerous. Williams' trading method is convenient and offers significant income with minimal risk. The level of income depends only on the size of the deposit.
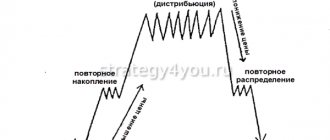
Impact days in strategy
Shock days play a special role in the strategy. This term means a correction to a strong trend movement and looks a bit like an inside bar pattern. The difference lies in the size of the corrective candle – the depth of the correction should be approximately 25% of the range of the previous candle.
Entry, as in the case of the inside bar, is performed only with pending orders.
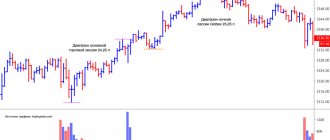
An example of a “shock day”.
Larry Williams' basic trading system allows 1 day for correction (when working on a daily chart). A shock day does not always end with a continuation of movement in the direction of the main trend line. If the resumption of movement does not occur within 2-3 days, then the likelihood of a reversal increases.
The correction turned into a reversal.
The screenshot above shows how a shock day turns into a reversal. Already the second black candle after a shock day indicates that the likelihood of continued growth is decreasing. Larry Williams' strategy allows only one day for correction, but in Forex this rule is often violated , so you can take into account not 1, but 2-3 candles. And only if the movement does not resume on them, then we conclude that the market is reversing.
Larry Williams' trading system allows the use of indicators when working with patterns such as the inside bar and the shock day. The RSI indicator can be used as a filter in determining whether a breakout is true.
We will be interested in the level of 50, as well as the entry of the oscillator line into the oversold/overbought zones.
Confirmation of a breakout from the RSI.
Patterns that are not confirmed by the RSI signal can also be used.
An Alternative View of Time Frames
Although Williams' trading method shows good results, a number of traders question the correct choice of five- and fifteen-minute time frames. The reason is that the income risks being too small. The asset will pass through quite a bit during this time. But that's only half the problem. The second is the spread, which may be too large. The result is that the trader may lose even the level of income that would have been in the case of a smaller spread.
Williams stipulates: you must choose only those assets that have a minimum spread, which means: no risky financial instruments. Consequently, potential income is further reduced. Theoretically, you can increase your income level if you choose the M30, or even H1 timeframe. On them, the local tendency still exhibits the features indicated by the author. But higher timeframes are not recommended.
The author did not say anything about the stops that should be used, so each trader is free to experiment and try his own approach. One of the popular options is to abandon stops altogether and close the trade as soon as the trend changes to the opposite. An alternative option is to act intuitively, depending on market conditions.
Various figures
This method is suitable for those who do not like to deal with indicators. Here you will have to analyze the asset price charts yourself. At the same time, you need to follow this rule - the strategy will not always work. There are two options when it can and should be used:
- If at the market open you see that the first candle has a lower low than the previous day.
- If a candle has a higher opening high than after the closing of the trading session.
What does this mean? Usually this situation indicates that there are many non-professionals in the market who for some reason are in a panic. Perhaps some news came out to which they reacted inadequately.
The gap that appears is the result of placing their orders. But they will definitely see that their forecast was wrong and will want to correct the situation. Accordingly, the price movement will change. This is the moment you need to seize. In this case, you should look for the following patterns on the chart:
- Limit points of fluctuations.
- Inner day.
- Outside day.
- Impact day.
Let's deal with them.
Vibration limit points
See what this pattern looks like.
The middle bar is very important here, showing the current minimum or maximum price value. If you see it, it means there will be a trend reversal. Accordingly, when the minimum is reached, you need to place a buy order, and when the maximum is reached, you need to place a sell order. In this case, the closing price of the bar following the average is used, and the stop order is placed at the level of the local minimum or maximum.
Inner day
It looks like this:
Here only two bars are considered, and the second one is, as it were, absorbed by the first. Its price values are always lower than the first one. To determine what to do (sell or buy), you need to look at the opening and closing prices.
In this case, the second bar is important. Let's say there was a downtrend, and then you see that the last bar engulfs the next one. This means that there will be at least a small reversal and you need to buy.
A similar picture can occur during an uptrend, but there you should place the opposite order - to sell. Be sure to compare the closing and opening prices of the second bar. If the opening price is higher, you need to sell. Otherwise, you should proceed with the purchase.
Outer day
This is the following pattern:
It is similar to an internal day, but here the second bar absorbs the first. This may also indicate a reversal. For example, if there was a downward movement and this pattern formed, the price will increase. So you should buy it. When this pattern forms in an uptrend, the price may begin to decrease. Accordingly, you need to sell.
Shock day
This pattern looks like this:
First, let's understand the concept of a “shock day.” This is a day when there is strong movement - prices seem to run up or down at high speed. As a rule, such a trend does not last too long, but its emergence should be taken advantage of. This can be done in two ways:
- trade with the trend;
- wait until the shock day is over and continue to place opposing orders.
In this case, a pattern is used in which there are two bars. It is available in two versions:
- To purchase. Here the closing price of the second bar is higher than the high of the previous one.
- For sale. Here the current closing low is higher than the previous low.
In my opinion, this figure works very well when there is an already formed trend, although Larry Williams just suggests waiting for it to reverse. And the shock day is characterized by the fact that it happens quite quickly.
But all the same, a specific movement is again formed, albeit opposite to the previous one. The main thing is to grasp its duration. However, the Williams strategy is used on small time frames, which reduces the possibility of losing trades. So don't be afraid to use it.
Market orientation
Initially, the system was created to work on futures markets, only then enthusiasts began to use it on the Forex market. Some consider it a mistake that the strategy cannot be used on the Forex market.
In fact, traders successfully make money using the system by choosing the appropriate spread level and other features of the currency pair. Many traders show excellent results in the stock and futures markets. Therefore, the strategy is considered universal.
Larry Williams - childhood and study years
The small town of Miles City, located in the state of Montana (USA), became the place where on October 6, 1942, a boy was born into the family of Silva Berthea and Richard Siegwart Williams, whom his parents named Larry.
The future celebrity spent his childhood in Billings, the largest city in Montana, where the boy’s father worked at a local oil refinery. Larry Williams went to high school in this city, graduating in 1960. While still in school, Larry demonstrated a thirst for knowledge. He not only studied well, but also took an active part in public life - he was a member of the school football team, and also the editor of the school wall newspaper.
While studying at school, many could hear that Larry Williams clearly had literary abilities. Therefore, no one was surprised when he entered the University of Oregon, located in Eugene (Oregon), to study journalism, and in 1964 he successfully graduated.
Subsequently, Williams will remember with warmth and gratitude the years spent at the university and his teachers. In memory of university professor Max Wales, he will establish a scholarship for student journalists and communication majors who have demonstrated creative talent but do not have a GPA.
Start of work
After graduating from university, then still an aspiring journalist, he went to New York, where he got a job at an advertising agency as a proofreader. But this job did not suit Larry Williams. He strived for more. Therefore, after weighing the pros and cons, Larry decides to leave New York and return to his homeland.
Even then he had the idea of starting his own business, and not being content with little. Williams quickly puts his idea into practice and begins publishing a newspaper called “The Oregon Report.”
The main content of this newspaper was economic and political news. By publishing economic materials in the newspaper, Williams gradually came closer to radically changing his life and becoming a stock speculator.
System construction
If the hypothesis is correct and the TDM pattern really works, then you can build a full-fledged trading system. Thus, after the basic test, we will add to the system the use of stops based on ATR and takes as a percentage of the stop value.
The third step will be to add different exit options to improve the results of the strategy. These will be outputs based on the readings of various indicators and non-indicator signals. Then we will select various options for tracking positions, such as an ATR trawl. And the last step is to apply the TDW pattern - we will prohibit trading on those days of the week on which the system’s results will be the worst.
Hypothesis testing
To test this theory, I wrote a simple advisor that opens a trade in a specified direction on a specified day of the month or week and keeps the trade open for a certain number of days. No support for positions, stop levels and take profits is provided so that they do not affect the result. The exit point, as we know, is of great importance for the final result of the system, sometimes even more important than the entry point. You can often turn a losing trading system into a profitable one by choosing the optimal exit option. Therefore, our exit will be influenced by only one indicator - the number of days the position is held, and it will be the same for all days. That is, we will have only one exit point.
As for the entry point, in the advisor settings I set one of three options for each day of the month - 0 (do not enter), 1 (buy) and -2 (sell). It is these parameters, along with the position holding time, that I will optimize. The system also uses a simple trend filter - if the price is above the moving average with a period of 100, only purchases are allowed. If lower – only sales. The filter parameters remain the same for all currency pairs. Optimization will take place over the period from 2000 to 2013. The rest of the period is reserved for forward testing.
The whole process occurs automatically to eliminate the subjectivity of evaluating the results of the forward test - everything is done for me by an algorithm that offers one, the most optimal result as a result. When selecting parameters, results with a small number of transactions, with a low profit factor (less than 1.1), and with a maximum drawdown exceeding 20% are immediately discarded. In addition, sets of settings are discarded in which the values of the profit factor or drawdown during the optimization and forward periods differ by more than 10%. Thus, only the most stable sets of settings remain, from which the best one is also automatically selected according to a given criterion. To test the resulting system, I selected the number of transactions, profit factor, drawdown and final profit as criteria for selecting the best option.
What are TDW and TDM?
Have you ever had the feeling that the market behaves according to a pattern during the week? Yes, not always, but at least once you caught yourself thinking like this. So, Larry Williams decided to check if this is actually true.
To test his hypothesis, given a certain system, Williams simply added up the resulting system's results on Mondays, Tuesdays, and so on. He discovered that certain days are much more suitable for buying, while others, on the contrary, are much more suitable for selling. He carried out his test for shares of the American market. That is why, if you take and start thoughtlessly applying the results of his research, you will lose your deposit. But fortunately, today we will explore in detail the applicability of his conclusions to the Forex market.
So what is TDW? In English, the decoding of this abbreviation sounds like Trade Day Week or trading day of the week, in Russian. TDM, respectively, Trade Day Month or trading day of the month.
The main idea of these patterns is that the market is subject to cyclicality and due to various processes occurring in the economies of world countries, on some days of the month or week the probability of closing above or below the opening price is significantly higher than 50%.