Indicator characteristics
Platform: Any Currency pairs: any Time frame: any Trading time: 24 hours a day Recommended brokers: Alpari, RoboForex, Amarkets
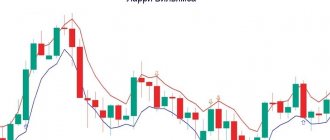
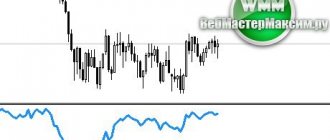
Despite the intriguing name, this oscillator is not much different from the well-known MACD. The principles of working with the indicator are generally the same. Essentially, the indicator helps determine the driving force of the market by subtracting the values of a slow moving average with a period of 34, built at the median price, from a fast moving average with a period of 5. The histogram consists of columns of two colors - red and green. If the column is red, then it is lower than the previous one, if green, then it is higher. The histogram of the AO oscillator fluctuates around the zero line and does not have overbought or oversold levels.
The AO indicator is included in the standard set of the MT4 terminal and has no settings other than color ones. To add it to the chart of a trading instrument, open the menu “Insert/Indicators/Bill Williams/Awesome Oscillator”.
Moving average periods are hardwired into the indicator code. However, for experiments, you can download a set of custom indicators prepared by our permanent king of indicators Pavel888 on the forum in this section. There are many options for the AO indicator, including those with period settings.
The role of momentum in chaos theory
The basis of any trading system based on technical analysis is the concept of extrapolation. In finance, extrapolation means estimating future value based on analysis of previous data.
Extrapolation is the cornerstone of behavioral finance theory. However, keep in mind that proponents of the efficient market hypothesis (EMH), such as Nobel laureate Eugene Fama, believe that it is impossible to obtain a consistent result using such forecasting methods.
However, when we use the alligator indicator, we extrapolate the market behavior and predict that the price will continue to trade in the direction of the alligator signal up or down. Essentially, any directional movement tends to create a ripple effect in the market due to the breaking of a support or resistance level. Then a series of pending orders is usually triggered and an impulsive price movement occurs.
Bill Williams realized that if we could measure the strength of this momentum, it could help us enter the market when momentum was increasing and exit safely when momentum began to wane. It is the Awesome Oscillator indicator that provides us with an understanding of market dynamics and allows us to measure the strength of the impulse.
Indicator calculation
Median Price is the quotient of the sum of the maximum price and the minimum price divided by two. Sometimes the calculation also uses the Typical Price, which is obtained by dividing the high, low and closing prices by three.
The method for calculating the AO indicator is very simple - just calculate the difference between the moving averages and the median price with periods of 34 and 5:
As you can see, two moving averages completely repeat the shape of the indicator. Thus, the calculation formula will look like this:
AO = SMA (Median Price, 34) – SMA (Median Price, 5)
Where:
SMA - simple moving average,
Median Price - median price.
Trading Recommendations
In his book, Bill Williams offers a ready-made trading system. In addition to AO, it includes fractals, an alligator and several oscillators. The system was developed in futures markets, but the author considered it universal and suitable for any trading platform.
The original strategy can still be used today, but much has changed since it was developed. Experts recommend integrating the Williams indicator into your own trading strategy.
It is advisable to use joint stock companies in conjunction with other market instruments. There are trading systems that combine the wonderful Williams indicator with Parabolic SAR. The creators of the Mirabelle strategy combined JSC with the Keltner channel. The indicator can be used in conjunction with moving averages, Fibonacci levels, Price Action trading techniques, etc. Before launching the strategy, all options must be tested on historical data.
- Here is another example of a strategy on AO - the Triple A Method:
Signals generated by the Awesome Oscillator indicator
Despite the fact that AO belongs to the category of oscillators and was developed as one of the filtering tools in the Profitunity strategy, this indicator also provides independent signals.
Crossing the zero line or “Zero cross” signal
The simplest basic signal generated by the Awesome indicator is Zero Line Cross. A buy signal is generated if the histogram crosses the zero line from bottom to top. The first column is below the zero line, and the second is above the zero line. The signals for selling are exactly the opposite.
Signal "Two Peaks"
“ Twin Peaks” (or “Two Peaks”) buy signal To sell, you need to find two decreasing highs. If a third local minimum is formed above the second or a maximum below the second for sales, then it is considered as an amplifying signal:
In fact, this is a rather weak signal, since there may be four consecutive lowering highs, as in the figure above.
Saucer signal
A “Saucer” (or “Saucer”) signal for purchases is generated if the Awesome Oscillator is above the zero line, and the histogram changes its direction from downward to upward, that is, of the three histogram columns, the first has any color, the second is red and below the first, the third column is higher than the second and green. This signal is sometimes called “Saucer”, and it looks like this:
This is the only buy signal that occurs when the histogram is above the zero line. This is also a rather weak signal, since after the first peak/trough the movement may be too short-lived and you may not have time to make money on it. It is best to take saucer signals when the first peak or trough is close to the zero line and the indicator still has room to fall - as is the case with the sells in the figure above.
Remember that for a “Saucer” signal to occur to buy, the histogram must be exactly above the zero line, and for sales – below. Essentially, this model describes an entry to continue the trend after a slight pullback, so on the chart to enter using this signal you should see an upward trend, and the indicator itself should ideally rise consistently from the opposite zone. Here's a good shopping example:
By the way, this version of the sell signal is usually called the “Inverted Saucer”.
Strategies with JSC
Working with this oscillator most often involves the use of other analysis tools - indicators and price levels of support or resistance. A comprehensive study of the situation allows you to filter out false signals.
In addition, a trade should be opened after receiving at least 1 confirmation: for example, JSC shows a change in trend from falling to growing, but it is better to wait for at least 1 additional sign from the indicator or support level.
JSC + Alligator
Another interesting indicator created by Bill Williams is the alligator, based on the use of 3 moving averages. The strategy gives the following signals:
- Buy BUY: JSC crossed the zero line from bottom to top, 3 moving averages crossed the candles in the opposite direction - from top to bottom. Now they are walking under candles.
- Selling SELL: AO crossed the zero line from top to bottom, 3 moving averages crossed the candles from bottom to top. Now they are gliding over the candles.
AO + Bollinger Bands
Bollinger Bands are one of the classic indicators that is still used to analyze price deviations from normal, averaged values. It can also be found in the terminal (section “Indicators” - “Trend”). The strategy is applied only in a trending market. The signals are as follows:
- Buying BUY: the candles touched the lower border of the channel (a small penetration of this line is also allowed), after which the price of the cryptocurrency began to rise, AO shows the intersection of the zero line from bottom to top.
- Selling SELL: the candles touched the upper border and went down, AO also crosses the zero line from top to bottom.
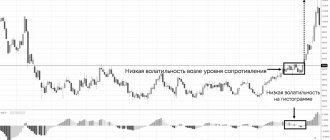
Note! The Bollinger Bands channel must be wide enough - otherwise the market will experience a flat, so it is better not to open orders. It is also clear from the considered example that 2 indicators may not send signals simultaneously - this is a normal phenomenon that is observed everywhere.
AO + support/resistance levels
Experienced traders almost always use price support and resistance levels in their trading systems. These are important lines that have been repeatedly tested by the cryptocurrency, as a result of which it was never able to break through the level and went above or below it again.
Obviously, the more often a line is tested, the greater its strength. Such levels are determined visually - usually on higher timeframes from H1 to W1. Here's what they look like on the daily chart.
The use of levels gives simple, fairly understandable signals, which can also be checked using AO:
- Buying BUY: the cryptocurrency touched the support level 2 times, did not break through it and began to grow again, which is confirmed by AO: the diagrams cross the zero line from bottom to top.
- Selling SELL: the cryptocurrency touched the resistance level 2 times, but in both cases did not break through it, a downward trend begins to emerge, which is confirmed by AO: the columns go from top to bottom and cross the zero line.
Important! AO and AC are multi-timeframe indicators that can be used at different intervals - from minute to daily, weekly and even monthly. They are especially suitable for analyzing the cryptocurrency market and classic Forex Major currency pairs.
The meaning and decoding of signals from AO and AC largely coincide, so in practice their joint use is often observed. These are fairly reliable indicators that show objective trends in the market. But it is safest to do this in a market with a pronounced trend, since during sideways movement (flat) indicators often give false signals.
Where to look for the AC indicator
For the convenience of the trader, all indicators developed by Bill Williams are collected in a separate group. Therefore, to find the AC indicator you don’t have to spend a lot of time and effort; you just need to pay attention to the “Navigator” area located on the left side of the working window of the Meta Trader 4 trading terminal and select “Indicators - Bill Williams” there.
After that, you can add it to the price chart in any convenient way - simply by dragging it with the mouse or selecting the “Add/Attach to Chart” item in the context menu that opens with the right mouse button.
Introduction to the Forex AO indicator
So, the Forex AO indicator. We find its first mention in the ninth chapter of the book, which describes the entry strategy. In this part of the book, the indicator acts as an auxiliary method for entering the market.
Skipping the details, let's say that the indicator is used in the place where you need to wait for the market to go down and the indicator to turn red or up, and then AO turns green. This indicates a change in momentum.
Look
Increasing knowledge about the indicator.
It must be said that the AO indicator is a tool that is actively promoted in the book by B. M. Williams. However, it is quite difficult to judge why this particular instrument was chosen by the author.
He speaks about this analytical method as follows. He writes that the Awesome oscillator is clearly the best momentum indicator that can be found in the stock or futures market.
This is such an effective tool that, according to the author, it may well replace tomorrow's Wall Street Journal. The review, as you can see, is more than flattering. However, what makes the author talk like that about a seemingly ordinary oscillator?
AO indicator
Features and advantages of the AO indicator
Like MACD, Awesome Oscillator is built on the basis of moving average convergence-divergence. However, if in the case of MA the trader can set the MA periods himself, for JSC they were set personally by Bill Williams and cannot be changed.
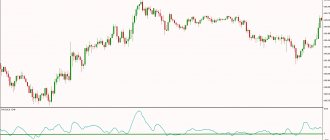
The oscillator is configured in a separate window and consists of green and red columns that reflect the degree of divergence of the moving averages.
When calculating the AO value at a specific time cutoff, the 34-period MA parameter is subtracted from the 5-period moving average indicator. If the fast moving average is above the slow moving average, the AO value will be positive and the oscillator will line up the bars above the zero mark. The stronger the trend and the more the moving averages diverge, the longer the bars up (in an uptrend) or down (in a downtrend) the indicator draws.
Unlike MACD, AO does not have an additional moving average, and all indicator signals are based on the behavior of the histogram, the position of the bars relative to each other and their crossing of the zero line.
Awesome Oscillator is suitable for trading almost any Forex asset, as well as CFDs on shares. The second option is even preferable, because initially Bill Williams created his indicators for trading on the stock market.
Conclusion
Created by Bill Williams, the indicator is designed to work on all types of markets: foreign exchange, stock, commodities and futures. It is especially effective for use on trending instruments with high volatility.
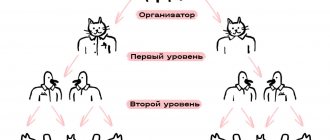
In this context, the market for oil, precious metals, and commodity currencies is interesting. Williams offers an interesting technique for forming trend pyramids using an acceleration oscillator.
It should be remembered that there are no universal tools that work equally well in all types of markets. All strategies must be tested on historical data. Testing the signals of trading systems based on AO shows conflicting results.
Experts recommend using the Williams oscillator in conjunction with other analytical tools. It can be integrated into a trading strategy as an auxiliary indicator or filter for signals.