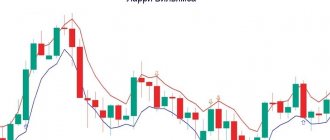
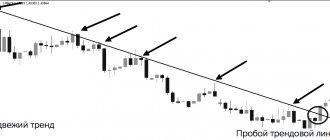
One of the important tools of technical analysis is technical levels. This is a certain price value, which, when the rate approaches it, will be an obstacle to further advancement. Graphically, it looks like an area where the price approached, and then the price on the chart rolled back, then approached again and again could not overcome the resistance. There may be several such returns, and the more there are, the stronger the level.
There are support and resistance levels. Support is at the bottom of the price range, it prevents the rate from falling further down, and resistance prevents the price from moving up. For the current value there are always support and resistance levels. The main rule is that the price will bounce off the level rather than break the level.
Breaking through the level is possible, so be careful: it usually occurs on some strong impulse, for example, the release of important news, and then the price flies beyond the level by a large number of points. Breakout techniques are based on this, but they are considered quite aggressive.
Fibonacci retracement levels also provide resistance or support when the price moves, but this is already partly a computer indicator. Its layout contains a certain dependence, which was derived long before the advent of Forex.
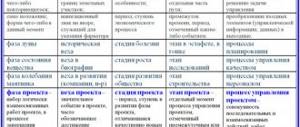
History of creation
Leonardo Fibonacci (12-13 centuries) - Italian mathematician who discovered a series of natural numbers that are in a certain relationship with each other. The meaning of the Fibonacci relationship is that each subsequent number is equal to the sum of the previous two. The series starts from zero and can be continued indefinitely: 0, 1, 1, 2, 3, 5, 8, 13, 21, 34, 55, 89, 144, 188...
Fibonacci himself initially developed his dependence to find a formula for the reproduction of rabbits. Fibo numbers are also related to each other by the “golden ratio”. This is a coefficient of 0.618. Starting from the 4th term, each previous number is 0.618 times less than the next one. If any member of the Fibo series is divided not by the next number, but by the number after one, we get a ratio close to 0.382. And if we take the third term of the series after the initial one, then the ratio between them will be approximately 0.236.
The mathematician did not discover this proportion, he only reminded humanity of it, because these relationships were known and used by the ancient Greeks during the construction of the Parthenon, and by the Egyptians for their famous pyramids.
It was the closeness of the Fibonacci series to the “golden ratio” that led to the creation on its basis of a set of tools for analyzing and forecasting market dynamics: fan lines, arcs, correction levels and Fibonacci time periods.
Most often, 5 correction levels are used. There is also a “golden proportion” between them. If we multiply the level of 61.8 by 0.618, we get a level of 38.2. In total they give 100%. Levels 23.6 and 76.4 also add up to 100%. But I myself use the level of 78.6, which is obtained by taking the root of 0.618.
Key levels are 38.2%, 50%, 61.8%, they will provide the greatest resistance and support for course changes.
Fibonacci retracement values: definition and diagrams
Fibonacci retracement levels were adapted for trading on the stock exchange in accordance with the works of Leonardo Fibonacci , a famous Italian mathematician who developed a unique series of numbers that later began to bear his name. He wrote three great works. Thanks to one of these books, Europe learned about the Indo-Arabic number system, which did not fit into the accepted framework. Fibonacci became an inspiration for many mathematicians and physicists.
Fibonacci numbers are a number sequence in which the next number is equal to the sum of the previous two.
Fibonacci numbers: 1, 1, 2, 3, 5, 8, 13, 21, 34, 55, 89, 144, 188 (hereinafter ad infinitum).
The main feature of these numbers is the constant connection between the elements of the series. There are many interesting connections.
So, the main properties of this sequence are:
- Any number is the sum of the previous two.
- The ratio of the next and previous numbers in the series tends to 1.618.
- The ratio of the previous and subsequent numbers tends to 0.618, etc.
Fibonacci numbers are considered to be the mathematical basis for the “golden ratio”: if a segment is divided using a coefficient of 0.618, then the ratios of the segments will be preserved.
It is generally accepted on stock exchanges that corrections in most cases stop at Fibonacci numbers. That's why they are so popular in technical analysis.
When a correction occurs, the market either reverses at Fibonacci levels or shows a rebound. Fibonacci levels in this case are 23.6, 38.2, 50, 61.8, 76.4. The latter is almost never used.
To build Fibonacci correction levels, you need to draw a line from the minimum point of the trend movement to the maximum, on which you need to mark the Fibonacci levels of 23.6%, 38.2%, 50%, 61.8% and 76.4%. According to theory, these are the levels of the most likely trend corrections.
Some traders draw additional horizontal lines through these levels. The result is a “Fibonacci fan”. These drawn lines are considered to be support and resistance lines.
There are two main methods of application:
To determine the depth of correction.
To determine possible price levels when the movement continues after the correction is completed.
Everything else, modifications and developments, for example, like mine. Based on the depth of the correction, with the help of additional levels, I determine the goals. When goals are achieved, the price usually rolls back.
But first things first
The main levels in the standard line are the levels 23.6%, 38.2%, 50.0%, 61.8%. But only the last three are key levels and provide the greatest resistance and support when the price rate changes. But with more popularization of additional levels, such as 76.4% or 78.6%, 86.0%, I would not call the above levels key. Yes, they still have the greatest influence, but market makers are also “cunning” and began to play for a breakthrough of the 3 main levels.
If a correction begins, then the rollback can be a third of the trend (38.2%), maybe half (50%), two-thirds (61.8%); many sources indicate this as the maximum size of the correction. But according to my observations, the maximum size is the level of 86.0%. If the price rolls back by more than 86.0%, this is no longer a correction, but a reversal of the movement in the other direction. This is from personal observations; it is useless to talk about pure mathematics here.
Determining the end point of the correction is very difficult, I would say almost impossible. The correction accomplishes its task (brings the market into relative equilibrium) either due to its depth or due to its duration. It is not possible to determine in advance how this will happen, but the definition of the goal depends on this. So, if the price does not stop at one of the levels, it will probably reach the next one.
Let's talk about how it is still necessary to correctly use and build the Fibonacci ruler.
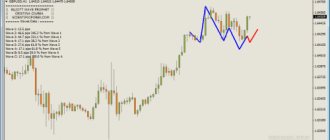
The ruler is laid out between two key points, in the figure points (1) and (2).
As a rule, local extrema are taken as key points, i.e. high and low for some period, for example, within a day. For this purpose, I enabled the display of period separators. But, there are times when one extreme is in the past period, and the second is in the current one. This is allowed.
If the price goes beyond the 0% and 100% levels, then you need to look for other key points for the Fibo.
In the figure, I marked with a cross that the construction of the blue Fib ruler is incorrect. It is better to build the way the orange one is built in the picture. It will be more reliable
Below is another example:
But be careful, very often in such situations, the direction of movement changes.
If we need to measure the depth of the correction to wave (A), then we use the previous trend, because the movement now is a correction to what was before. That is, if the rate is now going down (B), then we will lay out the fibo according to the previous upward movement and vice versa. We always work from the past to the future.
We lay out the ruler so that the 0% level is at point (2), the point of completion of the movement and the beginning of the correction, and the 100% level is at point (1), the point of the beginning of the movement, and then the levels will be arranged in increasing order. (If you use only three key levels 38.2; 50.0; 61.8, then there will be no fundamental difference in how you lay out the ruler).
You can build on any TF (time frames, time periods). Everything will depend on what type of TF you are working with. For example, for 15-minute movements, lay out the levels in a time frame of 30 minutes or 1 hour. If you work with movements that occur on the clock, then the Fibo can be set at 4 hours or days, i.e. in periods that will, in any case, cover the movement we need.
History of the method
Probably, many have heard about the so-called “golden ratio” proportion, which is used in many fields: mathematics, physics, biology and even art. This ratio is equal to the number 1.618 and is denoted as Φ.
Thus, in a regular five-pointed star, the value of Φ is equal to the ratio of the lengths of the segments:
- red to blue;
- blue to green;
- green to yellow.
The proportion of the golden ratio is also observed in the structure of the human body and face. When assessing external attractiveness, we pay attention to the ratio of the sizes of the head and body, the correctness of facial features, etc. And the more beautiful a person seems to us, the more the proportions of his face and body are close to the Φ value.
The number Φ is expressed by the formula:
In the 12th century, the Italian mathematician Leonardo Pisano, better known as Fibonacci (son of Bonacci), discovered a certain pattern of numbers, which was later described in the Book of Abacus. His father was a sailor and traveled often. Leonardo was interested in mathematics and, while traveling with his father, learned about the number sequence that was used for poetry in ancient India. The mathematician delved into the study of this pattern and introduced it to European science, as a result of which the sequence was called the Fibonacci numbers.
This sequence is a number series:
1-1-2-3-5-8-13-21-34-55-89-144-233-377…..etc. to infinity.
Sequence Features:
- Each value is equal to the sum of the previous two. For example, 5+8=13; 34+55=89.
- The ratio of the previous term to the next one is a result close to the value of 0.618: 34/55=0.618; 5/8=0.625. And the inverse ratio gives a result close to the number Φ: 55/34=1.618; 144/89=1.618.
- The ratio of the values of the sequence member to the next one after 1 is close to 0.382: 3/8=0.375; 34/89=0.382.
- Dividing by the value through 2 gives a result close to 0.236: 89/377 = 0.236; 55/233=0.236.
Fibonacci levels. What are they and how to use them in trading
The Golden Ratio or where it all began
Those who are interested in the purely applied aspect of these tools can skip this section - an excursion into the history of Fibonacci numbers, as well as their appearance in trading.
The Fibonacci sequence was well known in ancient India, where it was used in poetry. But it got its name thanks to the 12th century European mathematician Leonardo of Pisa, better known by his pseudonym Fibonacci. Fibonacci, among other numerous mathematical problems, studied and described this sequence in detail in the work “Liber Abaci” (“Book of Abacus” or “Book of Abacus”). This sequence is an infinite series of numbers, each next term of which is equal to the sum of the previous two:
0, 1, 1, 2, 3, 5, 8, 13, 21, 34, 55 …
This series has many remarkable mathematical features, but the main thing is that the ratio of a member of the series to the previous one tends to the famous “Golden Ratio” - the number 1.618. This number has been known since ancient times and was first found in Euclid’s Elements (about 300 BC), where it was used to construct a regular pentagon.
The golden ratio is considered the most harmonious proportion of the relationship between the whole and the part. Magically, the number 1.618 is very often found in natural forms that have nothing directly in common with each other. This proportion can be seen in snail shells, the distance between leaves on a branch, the shape of galaxy spirals, and even in the average ratio of human body parts.
The Belarusian scientist Eduard Soroko, who studied the forms of golden sections in nature, noted that everything growing and striving to take its place in space is endowed with the proportions of the golden section. In his opinion, one of the most interesting forms is the spiral twist.
The proportion 1.618 is also found in music, poems and works of art. Scientific minds of the 19th century recognized the golden ratio as the standard of harmony of proportions in nature.
The idea to look for the golden ratio in stock price charts belonged to the American engineer and manager Ralph Nelson Elliott, who became interested in price analysis after a serious illness in the early 1930s. Elliott studied annual, monthly, weekly, daily, hourly and half-hour charts of various stock indexes covering 75 years of market behavior. During the research, he noticed that the movements of the indices are subject to certain rhythms - waves, in the proportions of which the same 1.618 can be traced. Elliot wrote a number of works on this topic, the largest of which was the book “Nature's Law - The Secret of the Universe,” in which he included all his work concerning the theory of waves and the Fibonacci ratio.
After Elliott, many traders and market researchers looked for various applications of Fibonacci numbers in stock trading. The development of computer technology has allowed analysts to make great progress in this direction. Modern traders actively use tools based on this mathematical principle.
Fibonacci levels in stock trading
Perhaps the most common terminal for trading on the Russian stock market, Quik, offers the user four instruments based on the Fibonacci sequence. These are levels, fans, arcs and Fibonacci time zones. Let's start with the most popular - levels.
One of the oldest and most reliable trader's tools is the widespread support and resistance levels. Market participants need price references to understand whether it is profitable to buy now, whether it is time to sell, and where the price may change its direction. However, it is not always possible to determine exactly which level will work and which the price will not even notice. Fibonacci levels help solve this problem.
Determining correction levels
According to the rules, the Fibonacci Levels tool stretches from the beginning of the trend to its end (in fact, if you stretch the levels the other way around from the end to the beginning, there will be no difference in Quik). If you stretch it in this way, the resulting levels will become possible targets for correction. From these levels you can enter with the trend, or use it as a target in counter-trend transactions.
Using the example of the Norilsk Nickel stock chart, you can clearly see how clearly the levels of 23.6 and 38.2 were worked out. Moreover, there is a peculiarity here: if the Fibonacci level coincides with the level on the chart, as in this example, then the probability that it will be worked out becomes very high. It is even better if it is located on a round number.
It is worth immediately stipulating the limitation of use. This tool is used only if there is a clearly defined trend. If you use it on an instrument that moves inside the sidewall, then the levels are worked out very “dirty”, and their use is unlikely to bring you profit in the long run.
The movement along RusHydro occurred inside the flat with a large rollback. In this case, the level of 23.6 worked very dirty, and the price could have hit the stop order many times.
Also, the levels become dirtier as the correction phase drags on. However, even in this case, Fibonacci correction levels can remain relevant, and they can also work in a mirror way.
Another way to use correction levels is to trade pullbacks. When an instrument makes a rapid move towards a significant level from which there is a high probability of a pullback, the correction level of 38.2 can show you the potential to which the position can be held.
As for timeframes, the tool should be used in the M15 - D1 timeframe range.
Elliott Wave Definition
Fibonacci levels are often used in conjunction with Elliott wave theory. According to this theory, any trend movement in a financial instrument can be divided into five waves: three main (impulse) waves along the trend and two corrective ones against the trend. Impulse waves are numbered as the first, third and fifth, and corrective waves, in turn, are numbered as the second and fourth.
Any corrective movement can also be decomposed, but only into three waves. All internal waves are also laid out according to the fractal principle (a fractal is a self-similar structure). This process is clearly presented in the figure below.
Understanding what wave the price is forming now makes it possible to predict where it will go next. The most interesting for traders is the third wave. It is considered the longest and fastest. The ideal trade using Elliott theory is to enter the trade at the end of the second wave and exit it at the end of the third.
According to the theory, the height of the 3rd wave is related to the 1st as 1.618. This means that if we see the 1st and 2nd waves already formed, then we can calculate the length of the 3rd using Fibonacci levels. For this purpose, some terminals specifically provide a “Fibonacci extension” tool. It is built at three points: the beginning of the first wave, the end of the first wave and the end of the second wave. (the main thing is to observe these points on the price scale vertically. The horizontal position of the points is not so important). Fibonacci levels will appear on the screen, and the level at 1.618 will mark the estimated end of the third wave.
There is no Fibonacci extension tool in the Quik terminal. But it can be replaced with regular Fibonacci levels. To do this, you need to stretch them so that 0 is at the beginning of the first wave, and 100 at its end. And then just drag the entire structure so that 0 is at the end of the second wave.
I would like to note that the end of the third wave does not always occur at the level of 1.618. Quite often the price is slightly below or slightly ahead of this mark.
In addition to determining the length of the third wave, a number of specialists proposed methods for determining other waves. B. Williams’ book “Trading Chaos” proposes the following system for determining wavelengths:
1st wave - determined by the fact of formation
Wave 2 - most often ends at correction levels of 50.0 and 61.8.
Wave 3 – ranges from 1 to 1.618 from the length of the first wave.
Wave 4 - most often ends between the correction levels of 38.2 and 50.0 and most often looks like a sideways movement.
Wave 5 – ranges from 61.8% to 100% of the range between the beginning of the first wave and the end of the third.
Let's look at the Rosseti schedule as an example. Impulse waves are marked in green, and corrective waves in red.
The most difficult question in using Elliott waves is: “What wave is the price in now?” There is still no consensus among adherents of the wave theory on how to determine the starting point of the first wave and, perhaps, there never will be.
From a practical point of view, the most effective approach is: “If you’re not sure, don’t trade.” On some instruments, in a certain phase, the waves are drawn very clearly and are easily identified. On others, it is almost impossible to identify waves. It is necessary, through regular observation, to find among the variety of instruments those that move in a manner that is understandable to you, and trade only them. And as soon as the waves begin to break, switch to another instrument.
It is very important not to become fixated on one security, trying to find waves where there are none. In addition, the trading system must include a plan in case of a negative confluence of events. The stop loss must provide a risk/reward ratio of at least 1/2.
Fibonacci Fan
Like levels, this tool can be used to determine the points where the correction will end. The algorithm by which the fan rays are constructed is quite simple. If you draw a vertical line through the end point of the trend movement, then the rays will pass through the intersection points of this line with the corresponding Fibonacci levels. In most terminals, this algorithm is presented in the form of a ready-made instrument, which stretches from the starting point of the trend movement to its end. The rays of the fan, in this case, will show the possible ends of the correction, where you can open a position along the trend.
There may be different default settings in the tool, but the most common are the ray settings of 38.2; 50.0; 61.8. In Quik, they can be set as follows: right-click on the fan -> edit -> in the “Fibonacci Levels” section, set the desired values.
The fan is recommended to be used in conjunction with other methods for determining the correction length. The construction of a fan has an error depending on the scale and time frame, which can lead to incorrect interpretation of signals.
Fibonacci Arcs
Unlike previous tools, arcs are notable in that they also take into account the time factor. This allows the trader not only to predict how the price will behave, but also at what point this will happen.
Fibonacci arcs are constructed as follows: first, a straight line is constructed between the beginning and end of the trend. Then three arcs are built with the center at the end intersecting the straight line at the Fibonacci levels of 38.2%, 50% and 61.8%. In most arc terminals, they are also implemented as a separate tool.
Fibonacci arcs are very dependent on the scale of the chart. The most appropriate scale can be selected by analyzing the effectiveness of the tool on history. Just like the fan, it is recommended to use arcs in conjunction with other methods of technical analysis.
Fibonacci Time Zones
Fibonacci time zones are based on the same sequence of numbers 0, 1, 1, 2, 3, 5, 8, 13, 21... The starting point for construction is a local maximum or minimum. The second point will determine the length of the unit interval. Vertical lines will appear on the chart with a step corresponding to the sequence of Fibonacci numbers in a unit interval.
Vertical lines help identify times when a reversal can be expected. When the price is in the area of the next line, it is necessary to use other indicators and signals to find an entry point against the movement. You can, for example, combine time zones with fans or Fibonacci levels.
Other tools
In addition to the presented methods of using Fibonacci numbers in trading, a lot of options have been invented: Fibonacci spiral, Fibonacci channel, Fibonacci wedge, etc. They differ slightly in construction methods and appearance, but their essence is the same - determining the length of the correction. You can choose the instruments that are most suitable for you and add them to your trading arsenal.
Books you can read on this topic
In the book “The Elliott Wave Principle” by A. Frost and R. Prechter, you can familiarize yourself with the basic principles of the Elliott wave theory in its classical form.
In the book “(Un)obedient Markets” by B. Mendelbrot and R. Hudson, you can read about a modern view of the rhythms of financial markets and the fractal structure of price changes.
In the book by B. Williams “Trading Chaos” you can learn more about the method of counting waves, briefly outlined in this material.
R. Fisher's book “The Fibonacci Sequence: Applications and Strategies for Traders” provides another view on the use of Fibonacci levels when counting waves.
Open an account
BKS Express
What are Fibonacci levels for?
How are these relationships applied in modern practice?
- Fibonacci numbers are used in economics when studying cyclical fluctuations (forecasting a recession, its duration, how long the recovery period will last, etc.).
- Fibonacci levels determine the direction of the trend in stock trading (stock market, Forex, cryptocurrencies). The coefficient values of 0.236, 0.382 and 0.618 are converted into percentages and plotted on charts as horizontal lines to determine the approximate value of the price retracement.
After a sharp jump in price in any direction, as a rule, there follows a rollback by a certain number of points down or up (depending on the direction of the trend). Stock market professionals know this rule and successfully use it to limit risks.
The meaning of levels in trading
Fibonacci levels are used in several tools that traders use in trading strategies.
The first important level of the Fibo grid - 0.318 - is formed as a number divided by one in the Fibonacci sequence.
So, the principle of constructing golden ratio numbers is clear. Let's look at what the Fibonacci grid is.
- Correction levels: 0.236, 0.382, 0.500, 0.618, 0.764.
- Extension levels: 0, 0.382, 0.618, 1.000, 1.382, 1.618
Many traders believe that since these ratios are elements of universal harmony, why not use them to determine Fibonacci retracement levels?
During a progressive price movement, pullbacks inevitably occur. In these places the price takes a break, after which the movement continues. The size of the subsequent move can be determined from how deep the rollback was. This is why Fibonacci levels are needed, as well as in order to accurately set the correction value and set take profit at the corresponding extension. They can also be used to place a stop order to limit losses.
Fibonacci numbers in financial markets
Fibonacci levels are built into most trading terminals as tools for analyzing price changes and forecasting risks. These values are used when constructing support and resistance levels, predicting the start and end points of impulses. Fibo levels and ratios are used depending on the trading strategy, as well as depending on the volatility of the financial instrument.
Thus, for stocks with high volatility, as well as during sharp market fluctuations, the level of 61.8% can be used. For instruments less susceptible to outside influence, a level of 23.6% is used, etc. How Fibonacci levels work in trading – we will tell you further.
Who is Fibonacci?
Leonardo of Pisa is considered the very first major mathematician in the history of medieval Europe. Despite this, the scientist received his famous nickname “Fibonacci” not because of his extraordinary mathematical abilities, but because of his luck, since “bonacci” means “lucky” in Italian. Before becoming one of the most famous mathematicians of the early Middle Ages, Leonardo of Pisa studied the exact sciences with the most advanced teachers of his time, who were considered the Arabs. It was thanks to this activity of Fibonacci that the decimal number system and Arabic numerals, which we still use today, appeared in Europe.
In one of his most famous works, Liber abaci, Leonardo of Pisa gives a unique pattern of numbers that, when placed in a row, form a line of numbers, each of which is the sum of the two previous numbers.
Fibonacci correction levels
In principle, you already know what Fibonacci retracement levels are - these are horizontal lines with values of 23.6%, 38.2%, etc. These lines are used to place stop orders.
If the price breaks the line with a value of 50%, this indicates a possible trend reversal. Although some consider such a rollback to be normal. Let me remind you that the 50% level does not apply to the Fibonacci sequence, but is always used in conjunction with other values and serves as a criterion for determining the risks of price changes in an unfavorable direction.
On the chart, lines with values below 100% (23.6%, 38.2%, 50%, 61.8% and 76.4%) belong to the so-called Fibonacci “correction grid”.
Fibonacci grid, its levels, important extensions
Of all the Fibonacci tools, the grid is the most popular. With its help, you can not only find a rollback, but also predict further movement. Each trader has his own approach to this tool.
For example, some do not trade with a retracement of less than 50%. It often happens that the price, having reached the level of 38.2, begins to move along the trend again, then goes to the level of 61.8, 78.6 and only then continues to move in the original direction. But the deal has already been closed at stop loss, and the trader suffers a loss, despite correct expectations.
Fibonacci impulse levels
Impulse levels are placed at values above 100% and also correspond to the Fibonacci sequence: 123.6%, 161.8%, etc.
These lines, called the "second grid", are necessary to determine the momentum. The values are placed at the maximum or minimum of the pulses.
So, if the correction was approximately 38.2%, then we should expect an impulse at a minimum level of 161.8% and a maximum of 261.8% of the correction. These values are determined by the trader. When the price approaches 161.8%, it is advisable to take profit or move the stop order to the break-even zone.
Golden Rectangle and Fibonacci Spiral
The “Golden Rectangle” is another relationship between the golden ratio and Fibonacci numbers, because... its aspect ratio is 1.618 to 1 (remember the number 1.618!).
Here is an example: we take two numbers from the Fibonacci sequence, for example 8 and 13, and draw a rectangle with a width of 8 cm and a length of 13 cm. Next, we divide the main rectangle into small ones, but their length and width should correspond to the Fibonacci numbers - the length of one edge of the large rectangle should equal to two lengths of the edge of the smaller one.
After this, we connect the corners of all the rectangles we have with a smooth line and get a special case of a logarithmic spiral - the Fibonacci spiral. Its main properties are the absence of boundaries and changes in shape. Such a spiral can often be found in nature: the most striking examples are mollusk shells, cyclones in satellite images, and even a number of galaxies. But what’s more interesting is that the DNA of living organisms also obeys the same rule, because do you remember that it has a spiral shape?
These and many other “random” coincidences even today excite the consciousness of scientists and suggest that everything in the Universe is subject to a single algorithm, moreover, a mathematical one. And this science hides a huge number of completely boring secrets and mysteries.
Channel, arcs, fan, extensions
The Fibonacci channel is constructed from lines, not horizontal, but located at a certain angle, depending on the direction of the trend. If the trend is upward, a minimum value is set to which the indicator is tied, and a key line is drawn to the maximum, taking into account the trend inclination angle. In a downward trend, on the contrary, the indicator is set at the maximum and the line is drawn towards the minimum.
Next, the remaining grid lines are configured, running parallel to each other. Usually the setup is done automatically. The distance between the lines is determined according to the Fibonacci proportions, for example 61.8%, 100%, 161.8%, 261.8%, etc.
Channel boundaries are support and resistance levels.
Sometimes lines are constructed in the form of arcs (circles). This can be useful if the market is in a flat state (when the price moves without a clearly defined direction, but within a certain range).
Arcs are stretched from the beginning to the end of the trend in order to find correction points. Usually three arcs are built (61.8, 50, 38.2).
A fan is several lines diverging from one point in different directions. The fan rays have a deviation from the trend direction, corresponding to the Fibonacci proportions. The intersection of the ray and the trend line is the correction point. In an uptrend, the fan is located below the price chart, and if the trend is downward, it is located above the chart.
Extensions are Fibonacci levels that go beyond the 100% value (for example, 161.8% 261.8%). They are used when the price passes the 100% level, which indicates a trend reversal. Unlike levels, extensions require the construction of an additional point in the correction end zone. Thus, the Fibonacci extension is built at three points:
- A – the beginning of the trend;
- B – end of trend;
- C – end of correction.
What is the golden ratio
From a mathematical point of view, the golden ratio represents a certain ideal proportion to which all living and nonliving things in nature somehow strive.
This is what the “golden ratio” looks like
Using the basic principles of the Fibonacci series, seeds grow in the center of a sunflower, the DNA helix moves, the Parthenon was built and the most famous painting in the world, “La Gioconda” by Leonardo Da Vinci, was painted.
Even cats unconsciously (although, who knows?) follow the principle of the golden ratio, becoming favorites of most of the world's population
Is there harmony in nature? There certainly is. And its proof is the Fibonacci number, the origin of which we have yet to find.
Application
Fibonacci levels in the stock market
In the stock market, Fibonacci correction levels are built on the same principle as in the Forex market. For example, if the price of a stock rises, then before the next upward movement there is a short-term pullback. So, if the price of a security is 100 rubles, then before it rises to 150 rubles, there will most likely be a rollback to 75 rubles.
The coefficients of 23.6%, 38.2% and 61.8% are used to predict the level of recovery. That is, in our example, if the price was 100 rubles. and went down, then the recovery should begin around 76.4 rubles. (100-23.6%). If a security is highly volatile, then odds of 38.2 or 61.8 are used.
Fibonacci levels on a binary options chart
Binary options are contracts with a fixed profit, which is provided when a certain condition is achieved. If the condition is not met, the trader receives nothing. So, we predict that the dollar will cost 80 rubles tomorrow, and we bet 7,500 rubles on it. ($100 or 2,900 UAH). If tomorrow the dollar rises in price to 81 rubles, we will make a profit; if not, we will make a profit of 7,500 rubles. ($100 or 2,900 UAH) will be lost. Thus, a binary option is a kind of bet.
How to use Fibonacci levels for binary options depends on the type of option:
- put option – we enter into a contract at the moment when the price crosses the support level;
- call option – we purchase an asset when the resistance level is broken.
If we have built the first line upward on the chart, and the local maximum has collapsed, we should delete the levels that were originally built and add new ones. In this case, the local minimum will remain at the same level, and the maximum will be updated.
Here is an example for a downtrend. Here the resistance level is the line at 23.6. After breaking through this level, the price continued to move down.
Fibonacci levels on the Forex chart
You already understand the essence of constructing the Fibonacci grid. Now let’s formulate brief instructions for use on how to correctly stretch Fibonacci levels in trading:
- We determine the boundaries of the trend. We remember that time frames are designated by letters (H-hour, D-day, W-week, etc.). We identify extremes (minimums and maximums reached by the price before the reversal and correction). To find these points it is necessary to build support and resistance levels.
- We stretch the grid from the beginning to the end of the movement. In an upward trend - from minimum to maximum, in a downward trend - vice versa.
In the figure below (downward trend), the correction began at point B:
The next correction is observed at point D. Thus, we stretch the grid from A to D. Point E (just below the level of 61.8) is the resistance line; after reaching it, the correction ends. Then the downward movement resumed.
Fibonacci levels when trading cryptocurrencies
The strategy for trading cryptocurrency is broadly similar to the strategies for Forex and the stock market. The only distinguishing feature is that the accuracy will be slightly lower due to the fact that cryptocurrencies are characterized by increased volatility.
In practice, you should enter the market at the levels of 23.6%, 32.8%, 50%, 61.8% and 76.4%. It is recommended to place stop orders at the next level. For example, when opening a trade at a level near the 50% level (uptrend), the stop loss is set at 32.8%.
Strategy using Fibo
There are a great variety of trading strategies at Fibonacci levels. Consider an option called Magic Grid. This is a simple conservative strategy that shows a profit to loss ratio of 56%. The trader’s actions come down to correctly setting up indicators and placing stop orders that limit losses and fix profits.
For work, two Moving average indicators and a Fibonacci grid are used. The method for constructing moving averages is simple, and both are applied to the close of the candle. One will have a period of 100, the other will have a period of 200. The intersection of these moving averages will indicate a formed trend. The strategy is used on the hourly and 4-hour timeframes.
In the Metatrader terminal, the grid tool is called Fibonacci Lines. It will need to be adjusted by adding a level of 76.4. This is done in the following way. Double-click on the grid, after which it will go into the active state. Then right-click to open the tool menu. You need to select “Levels”. On this tab you should add a new level - 0.764. In the “Description” column write 76.4. Then you need to save the changes.
The strategy uses 2 grids. Therefore, it is better to mark each of them with its own color so as not to confuse the levels. This can be done there in the tool properties.
Let's look at how to trade Fibonacci levels using an uptrend as an example.
When the fast moving average with a period of 100 crosses the slow moving average, we establish the presence of a bullish trend.
The next step is to wait for the correction to begin. This can be determined by several factors:
- The trend is leaving its corridor.
- The tops of the candles (high) stop updating.
- The lower shadows of the candles tend to update the previous shadows.
- The RSI and Stochastic indicators may show an overbought zone.
It is necessary to plot Fibonacci levels as soon as the trend correction begins. To do this, grid No. 1 is stretched from the minimum trend value to the maximum. The minimum will be point “A”, and the maximum will be point “B”.
As soon as the rollback reaches the level of 38.2 and above, grid No. 2 stretches from point “B” in the opposite direction, that is, towards the correction until its end. This will be point “C”.
Entry into a trade in the direction of the trend is carried out at the level of 76.4 on grid No. 2. The first profit-taking target is also set on the second grid at the level of 161.8. Stop loss is set several points below point “C”.
In addition to this strategy, we can say that if the correction has not reached the 38.2 level, then the pullback is not traded. If the price breaks through the level of 76.4, then this correction is considered a bearish trend. Point “B” becomes point “A”, point “C” becomes point “B”. When the level of 76.4 is broken, sell transactions are considered.
How to trade Fibonacci levels
Now let's formulate the main stages of a trading strategy using Fibonacci levels.
- Determining the market state (trend or flat).
- Determination of range boundaries, extreme points and correction end points. Applying and stretching the mesh.
- Constructing support (resistance) levels for placing stop orders. The Fibonacci fan works well for this. While the price is within the rays of the fan, the further direction of movement is not determined. As soon as the outer rays go beyond, we can assume that the movement in this direction will continue.
Fibonacci Time Zones
This tool is used not to predict where the price will go, but to determine a possible time point from which the movement will begin. If zones are built based on key trend points, then important Fibonacci levels will show the end time of the correction. During this period, you need to look for possible points for opening a position.
Of course, the tool does not work 100%. Therefore, trade entries must be correlated with support and resistance levels. In addition, a reversal candlestick pattern can additionally indicate the end of a rollback.
The tool is used as follows:
- In the trading terminal, you need to click on the “Drawing Fibonacci Time Zones” tool.
- Draw a line starting from the extreme point at which the trend began (low for an upward trend, high for a downward trend) until the rollback begins.
- The lines indicating time zones will be the places to look for the end of the correction.
Who will this tool be useful for? First of all, for novice traders who have not yet learned to understand the dependence of price dynamics on time periods. Beginners, often afraid of missing an entry into a trade, open a position ahead of time. Thus, Fib time zones will be a good help for developing patience.
When Fibonacci levels don't work
Experienced traders know that no rule, no algorithm can be applied to all situations. And Fibonacci levels are no exception.
There are times when the price reaches a certain level and stays there for several cycles (candles). Many perceive this as a signal to sell, after which the price rapidly soars. What could be the reasons? Variety. For example, waiting for the election results or a maneuver by experienced players who thus force others to get rid of a position. Everyone remembers “moose hunters” (stop loss orders). In addition, do not forget about gaps and other non-standard situations.
However, Fibonacci levels provide a high probability of determining the correct entry point into the market.
Review of special tools for working with Fibonacci number series in MetaTrader
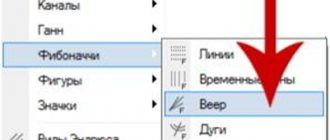
In order to observe special markings associated with F numbers on the chart, the user needs to open the “Insert” menu section (Fig. 4), select the “Fibonacci” subsection in the pop-up window and then select the desired instrument with the left mouse button. Five standard instruments are available in the built-in MetaTrader software (Figure 4):
- lines;
- time zones;
- fan;
- arcs;
- extension.
Figure 4. Illustration of methods for applying markings to a chart based on F-series in the MetaTrader program.
There are other ways of applying markings to graphs based on the proportions of F-series. Such methods are programmed in the form of indicators and require installation of a special terminal in the “Navigator” window. With such a terminal, the user has ample opportunities to use special modified algorithms (for example, ICWR.a, QuickFib, and so on).
Advantages and disadvantages
Let's list the advantages and disadvantages of trading using Fibonacci levels in a table:
| pros | Minuses |
| Simplicity. In Quick and other trading systems, Fibonacci levels are built into the toolbar | Sometimes it is difficult to determine the beginning of a trend direction |
| Suitable for the securities market, incl. derivatives, Forex, cryptocurrencies | The algorithm does not work very well on flats |
| A good way to determine entry and exit points, set stop orders, determine support and resistance levels | Low probability of forecasting on daily and hourly timeframes |
| The tool allows you to “get your teeth into” (master a skill) in a short period of time | |
| Fibonacci levels work on any time frame |
Arcs
Of all the listed tools that use Fibonacci levels in trading, arcs have a significant difference. When constructed, they not only show the places of correction, but also take into account the time factor. This makes the tool more versatile.
The construction of arcs is no different from the construction of a fan or mesh. They look like a semicircle or an ellipse (if configured appropriately). The zones formed by the lines will be places to search for correction.
It should be noted that although the ellipse is stretched over an area, it is still limited, unlike the lines built in a fan. Therefore, when the price goes beyond the arcs, there is no need to take into account the levels that were constructed. Most likely, a flat zone, or the beginning of a new trend, will appear outside the ellipse.
Recommendations
As we can see from the table, there were still more advantages. We summarize the main recommendations for using Fibonacci levels in Forex and other markets.
- Use the algorithm for medium and long term strategies. Although Fibonacci levels are also suitable for intraday charts, the probability will be slightly reduced. In addition, long-term operations are easier to predict.
- If the price corrects at levels of more than 50%, 61.8%, 76.4% or more, this is no longer a correction, but a change in trend.
- In conjunction with Fibonacci levels, use other methods of technical analysis to determine the end point of the correction.
- In search of the most significant support and resistance levels, it is recommended to study several charts of different durations.
- Fibonacci extension is a good tool for taking profits. Thus, the most common level for placing take profits is the level of 161.8%.
Recursion vs. Iterations
The most popular question asked about recursive functions is: “Why use a recursive function when the job can be done iteratively (using a for loop or a while loop )?” It turns out that you can always solve a recursive problem iteratively. However, for non-trivial cases, the recursive version is often much easier to both write and read. For example, the function for calculating the nth Fibonacci number can be written using iterations, but it will be more difficult! (Try it!)
Iterative functions (those that use for or while loops) are almost always more efficient than their recursive counterparts. This is due to the fact that each time a function is called, a certain amount of resources is spent on adding and pulling frames from the stack. Iterative functions consume much less of these resources.
This doesn't mean that iterative functions are always the best option. Sometimes a recursive implementation can be cleaner and simpler, and some of the extra expense can be more than worth it by minimizing the hassle of future code maintenance, especially if the algorithm doesn't take too long to find a solution.
In general, recursion is a good choice if most of the following are true:
recursive code is much easier to implement;
recursion depth can be limited;
the iterative version of the algorithm requires data stack management;
it is not a critical piece of code that directly affects the program's performance.
Tip: If a recursive algorithm is easier to implement, then it makes sense to start with recursion and then optimize the code into an iterative algorithm.
Rule: It is recommended to use iteration instead of recursion, but in cases where it is actually more practical.
Example of using Fibonacci levels
Let's look at an example with a downtrend.
At first the price moved down, then it slowed down and moved in the opposite direction. Our task is to determine when the price will again take the desired direction. We stretch the Fibonacci grid from the beginning of the trend until the start of the correction.
First, the price broke through the level of 38.2% and began to grow further, to 61.8%, after which it moved down and formed new lows. Thus, we drag the grid below:
Then the price, not reaching 38.2%, went down:
It should be noted that Fibonacci levels serve to determine approximate zones. They should not be confused with lines. It does not happen that the price, having reached, for example, 38.2%, should immediately reverse.
So, in the picture above, the maximum is circled in red just below 38.2%, and it is still considered that the 38.2% level is decisive. That is, we look to which Fibonacci value the trend is as close as possible, and set the minimum or maximum at a certain point. In our case, this point is the value 1.548.
Recursive Algorithms
Recursive functions typically solve a problem by first finding a solution to subsets of the problem (recursively), and then modifying those “subsolutions” to arrive at the correct solution. In the example above, the sumCount(value) algorithm first solves sumCount(value-1) and then adds value to solve for sumCount(value).
In many recursive algorithms, some input produces predictable output. For example, sumCount(1) has a predictable output of 1 (you can easily calculate this and check it yourself). The case where an algorithm, given certain input data, produces predictable output data is called the base case . Base cases work as conditions for the completion of the algorithm. They can often be identified by looking at the output results for the following input values: 0, 1, "" or NULL.