- home
- >
- Forex
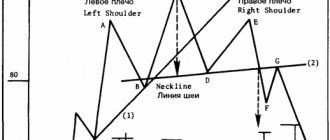
Japanese candlestick pattern bullish harami
) consists of a bearish candle with a long body followed by a bullish candle with a short body that completely overlaps the body of the previous candle. Its appearance on the chart during a downtrend is a signal of its potential reversal. The name of the model comes from the Japanese word “harami”, which means “pregnant”. Indeed, its outline resembles a pregnant woman, where the first candle is the “woman” and the second the “child”.
Strategies based on Japanese candlesticks
Japanese candlesticks represent a unique tool in all types of financial markets. They solve two problems:
- Allows you to compactly view your trading history;
- They make it possible to build trading strategies only on candlestick patterns;
Adherents of technical analysis, analyzing charts, came to the following conclusions: there are frequently occurring patterns that are harbingers of a change in a developing trend or, conversely, a signal for its further development. Such structures were called “candlestick patterns”.
However, building a strategy solely on candlestick patterns would be a naive mistake. According to statistics, only half of the time they point in the right direction. Agree that such a low efficiency rate is similar to flipping a coin. But they still provide some advantages over flipping a coin.
What are the advantages of Japanese candlestick patterns?
Due to the fact that the take profit significantly exceeds the protective stop loss order, we can say that candlestick patterns are more likely to work than not.
To get the maximum result from trading using graphical analysis of Japanese candlesticks, it is best to use these signals in conjunction with other indicators and features. For example:
- Ichimoku indicator - description
- Moving averages
- RSI (Relative Strength Index)
- Stochastic
- The MACD indicator and its signals
- Trading volumes
- Technical analysis figures
- Divergence and convergence in trading
Market entry and stop loss.
You can enter the market either by placing a buy stop order 2-5 pips above the high of the confirmation candle or, if you are confident enough that the price will move up, with a market buy order. In any case, your stop loss should be set 2-5 pips below the low of the setup candle. This is only a rough guide: in volatile markets you can move your stop loss further, just like for higher time frames. For example, for a daily timeframe, the stop loss is set 5-20 pips below the low of the setup candle.
The larger the body of the bullish candlestick that confirms the Bullish Harami candlestick pattern, the more likely it is that the price will move up. However, if the candle is too long, you may have trouble using a reasonable risk-to-reward ratio.
For example, you may have to set a stop loss of 50-100 points so that it is below the low of the setup candle. And if there is a strong area of resistance from above within this distance, then the probability of trading decreases sharply, since the take profit should be set larger than the stop loss. You will have to miss this signal.
Candles and candlestick patterns are the pulse of the market, determining price action ( Price Action ) and the sentiment of market participants, which is the driving force behind price action.
Characteristics of tactics and a little history
- Recommended brokers: help in choosing and my Top 5 companies / people's rating
- "MetaTrader"
- any (patterns with price gaps are much more likely to form on “minor” pairs)
- H1–W1 (optimally H1–D1)
- around the clock
Just a few words about the history of candlestick charts ... As far as we know, these charts were first used in the 18th century at 2 rice exchanges operating at that time: Dojima in Osaka and Kuromae in Tokyo.
The first person to begin marking price ranges for a certain period of time in the form of candles is Homma Munehisa, one of the then rice stock traders.
Since that time, due to its clarity and convenience, candlestick charts have become widespread and are currently the most popular, used by traders around the world, both in the stock market and on Forex.
Absorption
This is a powerful reversal signal that is formed by a combination of two contrasting candles. For a long time, this model could be used as an independent trading strategy.
Model features
- Several candles are always involved in the formation of a figure;
- The bodies of the candles of a given combination always have a different color;
- The first candle should completely dissolve in the body of the second.
Factors that enhance the formation
- The second body is 4 times larger than the first;
- The pattern was formed after a sharp impulse movement in the direction of growth or decline;
- Several bodies dissolved in the second candle.
My observations
Unfortunately, in 2021 the situation has changed and the formation is no longer considered reliable . Here's why this happened:
- In the history of the chart, “ Absorption ” is worked out in about 70% of cases;
- Due to its high accuracy, most beginners adopt this formation;
- Large players have tracked this activity and now, with every obvious “ Takeover ,” they try to work against the crowd.
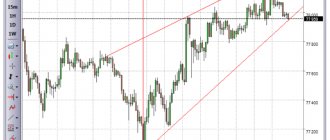
Daily chart of the dollar/canadian dollar . Absorption models that did not work : after their appearance, the market practically did not react or went against the expected forecast.
To avoid falling victim to market maker manipulation, I recommend using this combination only in conjunction with strong horizontal levels .
Popular candlestick patterns - 3 categories
All candlestick patterns discussed below were created by the creator. This is a theoretical part, which is presented without changes. Next, we will give a description of each pattern and then consider the main models using examples of real trading.
Candlestick patterns are divided into three categories:
- Continuation of the trend (9 models);
- Bullish reversal (19 patterns);
- Bearish reversal (26 patterns);
2.1. Candlestick trend continuation patterns
- Three white soldiers;
- Three reduction method;
- Three Ascents Method;
- Three Crows;
- Bearish gap “Tazuki”;
- Bullish gap “Tazuki”;
- Three wings of Bozu;
- Three simultaneous wings;
- Bullish gap edge to the edge of the white lines;
Here's what a trend continuation candlestick pattern looks like in theory:
2.2. Bullish Reversal Candlestick Patterns
- Falling star;
- Bear Quest;
- Bearish Harami;
- Bearish engulfing;
- Southern Evening Cross;
- The three-line star is thoughtful;
- Doji in star reversal position;
- Star Spread;
- Bull tongs;
- Bear Window;
- Three candle evening star;
- Bearish meeting line;
- Bearish three-line resistance line breakout;
- Hangman;
- Abandoned child;
- Dark covering cloud;
- Strong top, strength;
- 8-10 new peaks;
- A bearish play ending in a gap;
Here's what bullish reversal patterns look like in theory.
Bullish trend reversal patterns:
- How to determine a trend reversal;
- How to understand that it is worth selling assets;
2.3. Bearish Reversal Candlestick Patterns
- Inverted Hammer;
- Bullish Harami;
- Bullish engulfing;
- Hammer;
- Short candles in star position;
- Morning star in three-candle position;
- The candle is short in the Harami position;
- Doji in star position;
- Penetrating line;
- Dodge in harami position;
- Double push;
- Forceps;
- Three-star bottom;
- Absorption combined with a hammer;
- Penetrating line in forceps;
- Abandoned child;
- Strong bottom, fortress;
- Fast break and three new lows;
- Bullish Harami Cross;
- Bullish meeting line;
- Triple gap on black candles;
- 8-10 new bottoms;
- Bullish window;
- Bullish three-line support break;
- A bullish game ending with a gap;
- Inverted Hammer, Fortress, Dodge and Bullish Engulfing;
Here's what bearish reversal patterns look like in theory:
Bullish Harami, Bearish Harami and Extended Candlestick Patterns
Analysts looking for quick ways to analyze daily market performance data will rely on candlestick chart patterns to speed up understanding and decision-making.
While the bullish harami and its counterpart, the bearish harami, serve to predict upcoming reversals in the direction of the price trend, candlestick chart analysis offers a wide range of patterns for predicting future trends. Bullish and bearish harami patterns refer to a handful of basic candlestick patterns, including bullish and bearish crosses, evening stars, rising threes, and engulfing patterns. More in-depth analysis provides insight using more complex candlestick patterns, including island reversal, hook reversal, and san-ku or three gap patterns.
Types of charts
Line graph
A line chart is a curved line and usually displays the closing price at a certain moment (time frame).
Bar chart
Bar chart - price movement is shown as vertical lines with small horizontal shelves to the left and right of the line. The bar shows four prices:
- Bar opening price.
- Minimum value.
- Maximum value.
- Bar closing price.
Japanese candlestick chart
Japanese candlestick chart is displayed as a rectangle with two tails at the bottom and top. Just like bars, four prices are reflected:
- Candle opening price.
- Minimum value.
- Maximum value.
- Candle closing price.
Based on the above examples, we can conclude that the Japanese candlestick chart looks more informative compared to the line chart and bar chart. The color settings are quite extensive and the trader can always choose a color combination at his discretion. In this post we will use the following color scheme: rising candle (bullish) - green, falling candle (bearish) - red, doji - black.
Next, we will analyze Japanese candlesticks in detail: how they are formed, we will analyze the names, types of candles and candlestick combinations.
As mentioned above, the Japanese candlestick chart shows the opening price, minimum value, maximum value and closing price.
Bullish Harami Criteria
To correctly identify a bullish harami pattern, the following criteria must be met simultaneously.
- A clear downward trend should dominate the market.
- A downward price movement should end with a bearish candle with a long body and short shadows.
- The next day (trading session), the market should open with a significant price gap ( English Gap
) upward. - A bearish candle should be followed by a bullish one, the closing price of which should be slightly lower than the opening price of the previous day (trading session), and short shadows.
- The signal about a trend reversal should receive final confirmation in the form of further market weakness.
How to understand candlestick patterns?
All reversal patterns are essentially the same. Whenever any of them form in a trend, they signify a potential end to the current trend.
A bearish candle is formed when the bears have more power than the bulls. If the bears are stronger over a longer period of time, you will see a bearish trend.
Now imagine that in a downtrend a small candle with short shadows appears. This means that there is uncertainty in the market.
If you open a book or website that specializes in candlestick trading, you will likely find dozens of different candlestick patterns. In my opinion, you shouldn't try to remember them. It can even hurt your trading if you become fixated on finding individual candlestick patterns.
With the principles below, you will be able to interpret 90% of all price charts without having to memorize any artificial formations.
Harami model, description and main combinations of a reversal candlestick pattern
Translated from Japanese, "Harami" means "pregnant". The oblong candle is considered to be the “mother”, and the small one is the child. This combination is considered to be the exact opposite of the “Absorption” figure, where an extended candle absorbs another body.
When the Harami forms after a downtrend, this indicates its weakening. (Fig.1).
When making certain trading decisions, you need to pay attention to the position of the small candle in relation to the long one. This affects the significance of the entire figure.
If the Harami pattern has formed at the peak of an uptrend and a small candlestick is located near the upper border of the elongated candlestick, then this increases the likelihood of the uptrend continuing rather than the market turning. This pattern is often called “High Price Harami” (Fig. 2).
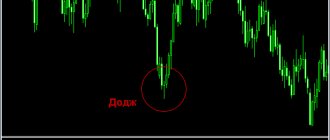
In a situation where the 2nd candle is a Doji, the chance of a reversal increases. This combination is usually called the “Harami Cross” (Fig. 3).
A distinctive feature of this figure is the maximum weight at the top than at the base.
If, during a downtrend, a small Harami body forms at the lower border of the oblong body of another candle, then this only indicates a temporary lull in the foreign exchange market. In this case, the continuation of the downward trend is considered the most likely, and a reversal is considered the least likely. Experts call this type of “Harami” “Low price Harami” (Fig. 4).
The smaller the second candle and the smaller the shadow, the more reliable the Harami signal is considered. However, there are no strict rules regarding what exactly should be considered a “small” body. In this situation, a certain amount of subjectivity is allowed.
Pattern (reversal pattern) Harami
Modern Japanese experts often argue that the Harami candlestick figure is a confirmation of the transitional state of the foreign exchange market. In other words, if during an uptrend prices rise above “Harami”, this is already a bullish signal. In a situation where the market completely closes below the minimum “Harami” during a downward trend, this means that “bears” dominate the market, accordingly, you need to count on the restoration of active sales.
If the full range of prices of a small candle (closing, opening, low and high) is located within the previous candle, then this increases the likelihood of a change in the trend in the foreign exchange market.
BEST FOREX BROKERS ACCORDING TO INTERFAX DATA
2007
BONUS $1500 TO YOUR ACCOUNT. | FXCOPY SERVICE | review/feedback 1998. ECN broker! CASHBASK FROM ALPARI | review / reviews 2007.
FinaCom. 15% BONUS + CASHBACK | review / reviews 1997. National Bank of the Republic of Belarus. Not for the Russian Federation! $50,000 FOR DEMO | review / reviews AND ALSO THE BEST BINARY OPTIONS BROKERS IN 2021:
Deposit from $10!
TRADE WITHOUT VERIFICATION | review/feedback Copy Deals! 10.000 FOR DEMO ACCOUNT |
review/feedback Conditions for the Harami candlestick pattern to appear at its peak:
- Formation of a fairly high bullish candle. The appearance of the model is preceded by an upward trend.
- The size of the next candle is small. The body is the first to “absorb” it completely. In this situation, you can ignore the shadows. Their number does not matter much (one or two).
- The color of the second candle is often black. However, under certain conditions it can also be white.
Conditions for the Harami candlestick pattern to appear at the bottom:
- Formation of a high bearish candle.
- The appearance of the model is preceded by a downward trend.
- The size of the next candle is small.
- The color of the second candle is often white. However, under certain conditions it can also be black.
How to read stock charts of Japanese candlesticks?
Some features when analyzing trends using candlestick and Harami reversal patterns
When using Harami models in daily work, it is necessary to pay attention to additional factors:
For example, it is important to know the size of another candle. If it is relatively small, then the model in this situation will resemble “Doji” in its own qualities.
This indicates the following: in the future we can count on changes in trends. In other words, there will initially be a slowdown in the Forex market, and then prices will begin to increase.
An important role is played by the closing cost of the candle that comes after the Harami figure. It must settle below or above the small candle, respectively, enter the market, mainly with a pending order. However, if a small candlestick takes the shape of a certain pin bar, then the reversal nature of the Harami figure will be obvious (if the pin bar is also a Doji, then we are talking about a Harami Cross).
The price range between the daughter and mother candles deserves special attention. Its presence increases the likelihood of variability in trend directions after the Harami pattern. The greater the price gap, the more likely it is that the Forex market will change direction.
Additionally, you need to pay attention to the length of the second candle. If it reaches the middle of the mother’s body and visually the “Harami” figure resembles an unsuccessful absorption pattern, then this indicates the emergence of such patterns of trend reversal:
- bearish Harami
- bullish Harami.
How to find candlestick patterns on a chart
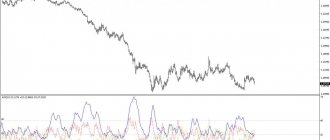
It is not necessary to look through dozens of charts every day in search of signals. There is a candlestick pattern indicator that looks for patterns on charts and marks them with an arrow. You can download the indicator for identifying candlestick patterns using the link. And this is what the result of his work looks like (MetaTrader platform, AMarkets ).
The disadvantage of the indicator is that it shows too many signals, the quality of which is too low. It is advisable to use it only if manual checking of readings and assessment of the market situation is expected before entering the market.
Candlestick patterns in Forex are recommended to be used in conjunction with support and resistance levels, since the latter enhance high-quality signals. Graphic shapes and oscillators are also suitable as false input filters.
Loading Likes…
Tips for using candlestick patterns
Finally, we will give parting words and practical advice when trading candlestick patterns:
1 Candlestick patterns have more weight when using large time frames (four-hour, daily, weekly). This way they give much more reliable signals.
2 Patterns are not the final signal to open or close a position. There are many false signals. For example, when there is a stable long-term trend in the market, it will not end instantly and opening positions against its main direction will be an expensive mistake.
3 On Forex, candlestick patterns work much worse than on stock markets.
This may be due to the fact that Forex is traded around the clock and there are no gaps. This is also due to the fact that all combinations were originally developed for trading securities.
4 At a time when the Japanese candlestick has not yet formed, many false signals may appear. Therefore, it is worth waiting until the end of the candle formation to draw any conclusions and actions.
Engulfing pattern or outside bar
The engulfing pattern signals a strong reversal and is formed with two candles. The second bullish candle completely engulfs the first bearish candle. This means that sellers have lost their initiative after the recent downtrend and the bulls are now in complete control.
On the other hand, bearish engulfing shows us the opposite picture. This pattern occurs when a bullish candle is immediately followed by a bearish candle and completely engulfs it. This means that sellers have overpowered buyers and there is now likely to be a big drop.
Absorption is a very powerful signal, especially if it occurs in the right place and context. This pattern is more significant if the first candle has small shadows and the second candle is much larger than the first.
During trends, you will often see engulfing patterns occur during pullbacks, so this pattern can be used to add to an existing trade or to find a new entry point.
Psychological rationale
Like any other Japanese candlestick pattern, the bullish harami has its own psychological background. A bearish candle with a long body in a downtrend, especially with large trading volumes, indicates the almost complete dominance of sellers in this trading session. However, the next day (trading session) trading is already carried out in a narrow price range, relative to the previous period, usually accompanied by a low trading volume. A bullish candle formed under such conditions gives a signal to the market about the weakening position of the bears and a potential reversal of the downward trend. Upon receiving additional confirmation in the form of another bullish candle with a closing price higher than the opening price of a bearish candle, market participants are already psychologically prepared for a trend reversal. It is usually accompanied by a sharp increase in trading volume, which is caused by both the closing of previously opened short positions and the opening of long ones.
Signal amplification
Several factors influence the accuracy and strength of the listed patterns.
- If there is a pronounced long-term tendency (trend), the signals will be more powerful.
- You should pay attention to reversal patterns only when they are located close to support/resistance levels.
- The older the time frame, the greater the likelihood of the signal being processed.
Japanese candlestick patterns are one of the most powerful techniques in technical analysis.
Combine them with trends and levels and you are unlikely to need any indicators.
Tweezers
The tweezer pattern usually occurs after a prolonged uptrend or downtrend and indicates an imminent reversal.
The most effective Tweezers pattern has the following characteristics:
- The first candle matches the current trend. If the price is moving up, then the first candle should be bullish. If the price is moving down, the first candle should be bearish.
- The second candle is opposite to the previous trend. If the price moves up, then the second candle should be bearish. If the price moves down, the second candle should be bullish.
- The shadows of the candles should be the same length.
Buy levels and Stop Loss
The final confirmation of the model, and, therefore, the moment of opening a long position, is the price breaking through the highest of two levels:
- the middle of the body of a bearish candle;
- closing prices of a bullish candle.
The lower of the last two price lows is selected as a reference level for Stop Loss. A loss should be recorded in the following cases:
- the market closed below the Stop Loss level;
- For two days in a row, the price minimum broke through the Stop Loss level.
Offensive
The appearance of the candlestick combination in question indicates that the new trend is gradually gaining strength .
Model features
- Three candles should follow each other and be painted the same color;
- Each subsequent candle must set a new price high/low;
- All three candles have approximately the same body size.
Be extremely careful
Advance pattern has a variation called the Three Methods . The appearance of this pattern indicates that there has been a temporary correction and the old trend continues.
- “ Bull offensive ” or “ Three soldiers ” - buy (for “Three methods” - sell);
- “ Bear offensive ” or “ Three Crows ” - sell (for “Three methods” - buy).