Hello, dear friends! When it comes to the Fibonacci sequence, it is almost called the basis of the universe. It is found almost everywhere, from the structure of a mollusk shell to the geometry of spiral galaxies. Today we will not focus on studying the history and scientific facts related to the Fib sequence, but will concentrate on how to use Fibonacci levels in trading. This tool is built on ratios derived from the basic Fib progression and can form the basis of a profitable trading strategy.
What are Fibonacci levels
Fibo levels are a tool that allows you to determine the end of the corrective movement and target levels when the trend continues (Fibonacci extensions). The position of each level is calculated based on the key ratios of the Fib sequence.
Progression or Fibonacci sequence is a series of numbers in which each next term is equal to the sum of the previous two. The progression looks like this - 1, 1, 2, 3, 5, 8, 13, 21 and so on ad infinitum. Already from the 5th-6th term of the progression, key relationships :
- The ratio of the progression term N to the (N-1) element approaches the number 1.618 as N tends to infinity. For example, 5/3 = 1.667, 8/5 = 1.600, 13/8 = 1.625, 21/13 = 1.615, and the further you move along the progression, the closer this ratio will be to 1.618 , this is a certain equilibrium point.
- The ratio of the progression term N to (N+1) approaches 0.618 as N tends to infinity. For example, 5/8 = 0.625, 8/13 = 0.615…. 610/987 = 0.6180346.
These numbers allow you to determine corrective Fibo levels , and a group of main and secondary lines is distinguished:
- The main ones include 38.2% , 50.0% and 61.8% (0.382, 0.5 and 0.618). The number 0.618 is the ratio of the current and subsequent elements of the progression, 0.5 is the result of dividing the first terms of the sequence. The number 0.382 is the result of squaring 0.618 .
- Secondary - 23.6% and 78.6% (0.236 and 0.786), 23.6% is the result of raising 0.618 to the cube, and 78.6% is the root of 0.618 . They are not considered basic because they are derived from the Fibo progression.
Recommendations
As we can see from the table, there were still more advantages. We summarize the main recommendations for using Fibonacci levels in Forex and other markets.
- Use the algorithm for medium and long term strategies. Although Fibonacci levels are also suitable for intraday charts, the probability will be slightly reduced. In addition, long-term operations are easier to predict.
- If the price corrects at levels of more than 50%, 61.8%, 76.4% or more, this is no longer a correction, but a change in trend.
- In conjunction with Fibonacci levels, use other methods of technical analysis to determine the end point of the correction.
- In search of the most significant support and resistance levels, it is recommended to study several charts of different durations.
- Fibonacci extension is a good tool for taking profits. Thus, the most common level for placing take profits is the level of 161.8%.
How it works in technical analysis
Technical analysis involves predicting the behavior of a trading instrument based on quote analysis. It is believed that the price already takes into account all fundamental factors.
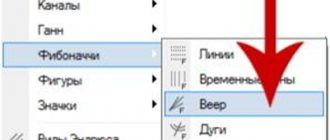
In addition to Fibo extensions and levels, channels , fans , spirals , time zones , and Fibonacci arcs . the lines that have become the most popular ; they are used both to determine the end points of the correction and to identify profit-taking zones.
The Fibonacci retracement grid works on any type of asset (stocks, currency pairs, cryptocurrencies, commodity market). As for the reasons for their development, a self-fulfilling forecast plays a role. If a large number of traders use the same technique, then it starts to work. Perhaps the principle of the “ golden ratio ” has an effect; it is found in nature and music. It is possible that this pattern also affects trade.
There are also skeptics . For example, Adam Grimes studied the effectiveness of levels in the stock market and Forex. His research shows that individual lines are not particularly important, but rather the 40%-80% zone plays a role. Its result can be explained by the fact that no additional rules were introduced to identify movements to which Fib lines were applied. Examples of real traders prove that this tool only works in capable hands.
Profitable trading in AMarkets
Channel, arcs, fan, extensions
The Fibonacci channel is constructed from lines, not horizontal, but located at a certain angle, depending on the direction of the trend. If the trend is upward, a minimum value is set to which the indicator is tied, and a key line is drawn to the maximum, taking into account the trend inclination angle. In a downward trend, on the contrary, the indicator is set at the maximum and the line is drawn towards the minimum.
Next, the remaining grid lines are configured, running parallel to each other. Usually the setup is done automatically. The distance between the lines is determined according to the Fibonacci proportions, for example 61.8%, 100%, 161.8%, 261.8%, etc.
Channel boundaries are support and resistance levels.
Sometimes lines are constructed in the form of arcs (circles). This can be useful if the market is in a flat state (when the price moves without a clearly defined direction, but within a certain range).
Arcs are stretched from the beginning to the end of the trend in order to find correction points. Usually three arcs are built (61.8, 50, 38.2).
A fan is several lines diverging from one point in different directions. The fan rays have a deviation from the trend direction, corresponding to the Fibonacci proportions. The intersection of the ray and the trend line is the correction point. In an uptrend, the fan is located below the price chart, and if the trend is downward, it is located above the chart.
Extensions are Fibonacci levels that go beyond the 100% value (for example, 161.8% 261.8%). They are used when the price passes the 100% level, which indicates a trend reversal. Unlike levels, extensions require the construction of an additional point in the correction end zone. Thus, the Fibonacci extension is built at three points:
- A – the beginning of the trend;
- B – end of trend;
- C – end of correction.
How to build a Fibonacci grid on a chart
This tool is integrated into all desktop and web terminals. As an example, let’s look at the rules of working on a live chart from TradingView and in MetaTrader4.
Working with a live schedule
In TradingView, Fibo levels are located in a separate menu “Gann and Fibonacci Tools” . They can also be called with the combination Alt+F .
A clearly expressed is selected on the chart . Fibo levels are extended to it. The construction is always performed so that the zero level is at the right extreme, and 100% is at the left . That is, on a bullish movement the lines are drawn from bottom to top, and on a bearish movement - vice versa.
During an upward movement, the 100% will be at the lower extremum, and 0 – at the upper one . The position of intermediate levels at which there is a high probability of the end of the correction is automatically calculated (the price is marked in brackets).
Double-clicking on Fibo levels opens the settings menu, in it:
- The style is responsible for the main parameters. You can set the color of each line, add arbitrary ones and, if necessary, extend them in both directions.
- Coordinates . Here the prices of 2 points on which the construction was carried out are set.
- Display. The timeframes on which Fibo lines will be visible are indicated. You can limit them so as not to clutter the chart with unnecessary constructions.
As the chart approaches the line, the price behavior is monitored. A reversal signal most likely indicates a continuation of the trend movement.
Fibo levels in MetaTrader 4
The principle is the same as in a live chart - clearly expressed movement is selected and lines are stretched from left to right.
To get to the settings menu, double-click the Fibo levels added to the chart, then right-click to select the context menu . In it, select the “ Fibo Properties ” item. The list of settings is approximately the same as on TradingView:
- General – select the type of lines and their color.
- Fibonacci levels – the lines are specified directly. On the left side - in fractions of a unit, on the right - in percentage (you will see this number on the graph).
- Parameters – settings for the prices of points along which Fibo levels are stretched.
- Display – select time intervals at which constructions will be visible.
The functionality of Fibo levels on a live chart and in MT4 is the same. TradingView stands out only for its large number of visual settings ; this does not affect the value of the tool.
Start trading with AMarkets
The 50% retracement phenomenon
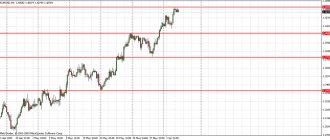
Why do I have such a strong love for the 50% level? Let's remove all Fibonacci levels and leave only the one that has the 50% mark:
Three lines, everything is clear and clear. In a trend, this is the strongest level from which you can squeeze maximum profit with the best entry points.
Why not other levels? For me, one reason is enough: all other levels are not so unreliable, they are often broken, and the stop loss has to be set larger than expected.
To begin with, let's plot this level on the chart, for example, on a 4-hour time frame, let's take one candle for analysis.
Next, let's switch to the hourly timeframe and see what happened there.
As we can see, the price rose exactly 50% and began its decline, while bringing us profit.
For stop loss, I recommend using the 61.8% level, since a breakout of this level is a strong signal that the trend has reversed.
How to choose movements to build Fibo levels
Waves of different lengths and heights are constantly formed on the chart of any asset. For beginners, it can be difficult to determine the movements by which Fibo levels can be stretched. There are several ways to determine such waves:
- Using indicators, for example, Zigzag (standard MT4 tool). It highlights significant movements and Fibo levels can be applied to them. The disadvantage of this indicator is that it does not evaluate market condition generally, highlighting all waves that meet the criteria of duration and distance traveled in points. As for how to use ZigZag, you don’t need to configure it; you just need to attach the indicator to the chart.
- Visually . You can reduce the scale of the graph and identify significant movements by eye The method is not bad, but there is a subjective factor: it depends on the trader which impulses will be chosen for construction.
- By trend. Using indicators, for example, moving averages, the direction of market movement is determined, and Fibo levels are plotted only according to trend waves. The reason for updating the markup is census trend high/low.
It is impossible to completely get rid of subjectivity when constructing Fibo levels . I recommend taking into account clearly expressed, confident, recoilless movements and applying this tool to them.
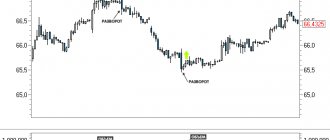
Also, when constructing, there may be several equivalent options . For example, after reaching a maximum around 1.3005, the GBPUSD pair begins to move in a horizontal corridor, gradually declining. After the formation of a local extremum, an impulsive downward movement develops.
In this situation, it is possible to construct constructions both only on the impulse and on the entire downward movement . Both options work.
Fibo levels work better on trending instruments. For those of you who plan to work in Forex, I recommend reading the post about the main currency pairs. It explains in more detail the features of the main financial instruments.
Where do Fibonacci patterns occur?
All the mysticism around Fibo numbers stems from the fact that they are often found in natural phenomena:
- arrangement of plant leaves;
- in sunflower seeds;
- flower petals;
- body length in the golden ratio in insects (dragonfly);
- the length of the phalanges of the human fingers and in many other things.
It cannot be said that Fibonacci numbers are a panacea and can be used to calculate absolutely everything, but many phenomena can be traced in one way or another in such a sequence of numbers, including human psychology and trading. With this I will finish the historical and theoretical part and move directly to the financial markets. For those who are interested in the topic, a short and very informative video about Fibonacci is presented below.
How to determine the end of a movement
Using this tool, you can determine both the end of the correction and the zones in which the main movement to end . Let's look at this in more detail.
Determining the end of a corrective movement
Fibo levels are used to find the end of the correction. The trader assumes that the main movement will not be interrupted and tries to find a point from which the chart will continue to rise or fall. The priority correction lines are 38.2%, 50.0% and 61.8%. The pullback to 23.6% is insignificant, but to 78.6% is too deep.
There is no point in forcing yourself into a framework by limiting the end point of the correction to a specific level. It is more logical to consider the range in which the rollback movement is highly likely to end. The levels of 38.2% and 61.8% are taken as its boundaries; taking into account Grimes’ research, this range can be expanded to 38.2% - 78.6%.
In simple words, it is not necessary to wait for a rebound from the Fibo level accurate to the point. A turn can be formed with a slight throw beyond the line or with little reaching it. There is no 100% guarantee that after touching, for example, the 38.2% correction level, the rollback will end and the trend will continue.
Open a Forex account in AMarkets
Determining target levels using Fibo lines
There are 2 ways to determine goals based on ongoing movement:
- According to standard Fibo levels.
- Using a separate Fibonacci extension tool.
When using Fibo levels, the rules for their construction change in a mirror way . When determining the end of the correction, the marking is done so that 0 on the right side . To identify target zones, Fibo levels are constructed in reverse - 0 is shifted to the left . If the main movement continues, the target lines are considered to be 161.8% and 261.8%, here you can take profits.
Fibo extensions are built based on 2 correctional and 1 trend extremum . In a growing market:
- The first point is the previous correction low .
- The second is the trend high .
- The third is the next corrective low .
3 lines are automatically drawn on the chart - 61.8% , 100.0% and 1 61.8% , their position is measured from point No. 3. To determine where the 61.8% line will be located, you need to set aside from point 3 the distance in points equal to 61.8% of the length of segment 1-2 towards the expected movement. The lines on which the numbers 100.0% and 161.8% are written are calculated using the same method.
Both can be used in trading . They give different positions of target levels, so close attention to the price action.
Advantages and disadvantages
Let's start with the cons:
- If your broker's minimum position size is 100 shares or 1 lot, then you need to have the purchasing power of at least 3 lots. Agree, not everyone can afford this;
- Not every rollback reaches the 50% level, much less 61.8. This means that you will often not use your full trading potential, which reduces your possible profits (and losses too!);
- Quite aggressive risk management – “hardcore” level. The risk in one position can reach 3-5% of the trading account;
- The biggest problem is that the securities you have selected will already be at the stage of an active rollback in the AZT (active trader zone). Very often, when you watch them, they will already pass the mark of 38.2, maybe 50, or maybe 61.8. You simply simply won’t have time to place limit orders to enter a deal.
Now let's go over the pros:
- A mathematically understandable system for any level of trader - a minimum of information: no reversal patterns, candlestick patterns, indicators, etc.;
- A completely automated strategy. We place orders to buy or sell, then immediately to close the position and, of course, stop loss. Then we go about our business – it’s nice;
- Opening a position from the most extreme turning points. We do not wait for any confirmation of a reversal, but simply place limit orders;
- The main advantage of such trading is the principle of pyramiding . This means that the position is opened and closed in parts. Moreover, the market itself decides which orders will work and which will not, and how much the trader will earn.
It turned out to be 4 points in each part. This strategy has no potential advantage. But don’t rush to draw conclusions, maybe I missed something - by accident or not. Try it and then draw your own conclusions.
Trading strategy on Fibonacci levels
Let's look at building a simple system using Fibo levels. You will have to solve several problems sequentially :
- Determine the state of the market. Indicators (ATR, Moving Average, Bollinger Bands and other tools) and graphical analysis can be used.
- Determine the range in which, with a high degree of probability, the rollback will end and the trend movement will resume. For this we use Fibo levels.
- Select filters that confirm the end of the rollback. Candlestick patterns and indicators can act as such filters . oscillators work well , you can use Stochastic or RSI. Their exit from the oversold/overbought zone confirms the signal from the Fibonacci levels. For beginners, I recommend reading the post “Japanese candlesticks for beginners”, from it you will learn more about the logic of the patterns and their application in trading.
- Develop a methodology for determining target levels . Take profits are placed here or profits are recorded manually.
Let's look at one of the possible deals:
- In the market area under consideration the chart stays above SMA 120, there is a consistent increase in High and Low. This corresponds to a bullish trend; work is limited to buy transactions.
- After the next trend wave, a rollback begins and a local maximum is formed. We stretch the Fibo line to this movement and get a zone in which a chart reversal and a resumption of the bullish trend are most likely.
- After the first testing of this zone we get signal to purchase, but he not confirmed oscillator. Later the chart is adjusted deeper, forming reversal pattern in the highlighted zone, after which the Stochastic line leaves the oversold zone. This entry point is taken into account, and the stop is placed under the correction level of 61.8%.
- Target zones are defined using Fib extensions. Since we get several options for take profit, you can use partial profit fixation with simultaneous position trawl.
This is a ready-made strategy; the general principle is suitable for all volatile assets, including stocks , gold , and commodity market instruments. If you have just started getting acquainted with the world of trading, I recommend taking an educational course on “what is volatility” and understanding the rest of the terminology.
Avoid false signals
The best way to avoid false signals is to always use Fibonacci retracement levels on higher timeframes.
I prefer to use weekly or monthly charts to identify possible market reversals. The greater the distance between the highs and lows, the better. Try to cover a distance of at least several years.
Finally, the best way to avoid false signals is to never rely on one trading strategy. There is no better way to use Fibonacci levels. Always ask yourself, does this trading method suit your trading style and personality?
How to improve your work efficiency
To increase the efficiency of Fibo levels, I recommend :
- Do not use them in isolation from other analytical tools. Remember: the very fact that the price touches the Fibo line does not mean anything; confirmation of the reversal and the end of the correction is needed.
- Do not use them on small timeframes . As the time interval decreases, the forecasting accuracy decreases. At M1-M5 the value of Fibo levels is lower than at H4-D1.
- Use this tool only on clearly defined movements .
- Complement work with Fibo with other techniques . For example, instruments with high forward/inverse correlation can be analyzed simultaneously. Sometimes movement starts earlier on one instrument than on another. The article about the correlation of currency pairs tells more about this phenomenon.
- Combine Fibonacci levels from different timeframes . If several lines are located at a short distance from each other, they can be combined into a zone of increased significance.
- Stretch Fibo levels over several movements , for example, over the entire trend and over the last wave. The coincidence of several lines increases the value of this zone .
These rules are a kind of safety precautions . You can ignore them, but this will lead to a deterioration in the efficiency of Fibo levels.
A Brief History of Fibonacci Numbers
According to the generally accepted version, numbers were invented by Leonardo of Pisa, the legendary mathematician of medieval Europe. The sequence itself was outlined in the Book of Abacus in 1202 in the form of a problem to calculate the population of rabbits.
Why Fibonacci? In fact, the mathematician himself never called himself that. This nickname was given later from the phrase “filius Bonacci”, which was written on the cover of the Book of Abacus, literally meaning “son of Bonaccio”.
Interesting fact: it is most likely that the sequence of numbers itself was invented much earlier, but was officially recorded in the book only by Fibonacci. As many sources indicate, the sequence of Fibo numbers was very famous in ancient India, and this was much earlier than Leonardo of Pisa lived.
Where to open an account for Forex trading
This is one of the most popular questions among beginners. Based on my own experience, I can recommend AMarkets .
| Criterion | AMarkets |
| Regulation | The Financial Commission |
| Minimum capital | From $100, €100, 5000 RUB for standard accounts |
| Number of assets | 100+ |
| Recommended capital | $1000 |
| Account currency | USD, EUR, RUB |
| Maximum leverage | 1 to 1000, on ECN – 1 to 200 |
| Spread in points | Floating, from 0 for ECN, fixed from 3 |
| Commission | $2.5, €2.5 or ₽175 for 1 lot one way for ECN |
| Execution speed, ms | 53,3 – 70,0 |
| Stop Out | 20-40% |
| Exiting client transactions to the interbank market | + |
| Number of positions | No limits |
| Pending orders inside the spread | + |
| Requotes | — |
| Limiting the number of transactions | Absent |
| Limit orders inside the spread | + |
| Availability quote | — |
| Own indicators | Cayman (market sentiment) and COT (provides information from the Commodity Futures Trading Commission) |
| Peculiarities | Welcome bonus up to $10,000. Cashback, there are tournaments and other incentives for traders |
I will give the main working conditions in this company in tabular form.
| Company | AMarkets | ||
| Rates | Standard | Fixed | ECN |
| Minimum deposit | 100$/100€ or 5000₽ | 200$/200€ or 14,000₽ | |
| Recommended capital | 1000$ | 50 000$ | |
| Leverage | 1 in 1000 | 1 to 200 | |
| Spread, points | Floating, from 1.3 | Fixed, from 3 | Floating, from 0 |
| Commission | No | 2.5$, 2.5€ or 175₽ for 1 lot one way | |
| Minimum Margin | 1$ | 5$ | |
| Stop Out | 20% | 40% | |
| Exiting client transactions to the interbank market | No | Yes | |
| Ability to place pending orders inside the spread | No | Yes | |
| Requotes | Eat | Their absence is guaranteed | |
| Open an account | |||
Examples of using Fibonacci numbers in trading
It is not known exactly who and how were the first to use Fibonacci numbers in trading. Many people attribute the use of Fib numbers to Ralph Nelson Elliott, who is best known for his wave theory. He is believed to have represented the sequence in proportions of 1.618 when analyzing graphs in his book Natural Law - The Secret of the Universe.
One way or another, for us, as practicing traders and investors, none of this matters much. What is more important is that in trading there is a whole range of very diverse technical tools based on Fibonacci numbers. In the current section I will consider those tools that will be available to most in popular terminals, in particular from the developers of TradingView. Some of the presented options are also available in MetaTrader.
Fibonacci correction in trading
The most common, simple and effective tool is correction. It is available in almost all reputable stock trading terminals. It looks like this:
What does the correction do:
- determination of levels, according to Fibonacci numbers, from which you can enter a transaction;
- clarification of the price position as a percentage of the last trend wave (correction percentage);
- the possibility of confirming a trend reversal when the price passes more than 70% of the last wave.
In my experience in Forex, very often a deep retracement ends at around 61.8%. Detailed instructions on using Fibonacci retracement levels can be found here.
Fibo trend extension in trading
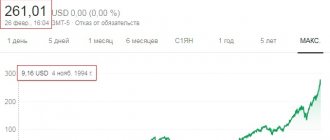
Similarly, if in trading you can determine the percentage of correction using the Fibonacci sequence of numbers, then the continuation of the trend will be no exception. The “Expansion” tool is provided specifically for this purpose. It is also simple to use; it is enough to first highlight the trend movement, and then the end of the correction (3 points), which will help us determine the final goal of the movement. Here is a clear example on the same section of the graph.
As you can see, in this case, Fibo levels act as a target for movement, as well as resistance levels from which the price can reverse. The rather high accuracy of forecasting is striking, literally point by point.
Fan Fibonacci lines in trading
The next interesting tool is the Fibo fan. The fan is constructed in the same way as the correction, i.e. the trend movement is simply highlighted (2 dots). Next, the fan lines are support and resistance levels for future price movements.
What does the fan give:
- combined analysis - here you can immediately predict the target of the movement, rebounds (corrections) and resistance, in contrast to Fibo correction or Fibo extension, which offer the same thing, but separately;
- a longer influence of the fan lines - this can be seen in the above section of the chart, simple Fibonacci levels are valid until a rebound occurs, then you need to build new levels, and the fan works almost throughout the entire trend section.
The only difference between the fan is that the percentage levels are located the other way around, i.e. instead of rollbacks at 61.8%, we will have bounces from 0.382.
Fibonacci time periods in trading
A fundamentally different tool from the previous ones is time periods. It operates not on the basis of price changes in points, but on the time of movement. In theory, it should determine market cycles, after what time the direction of price movement will change, etc. It is easy to construct; you only need to select one section of the trend movement (2 points). In Forex, it is common for the market to reverse on the 5th or 8th period, which can be used to gain little trading benefit.
In general, time periods are not a very useful tool because it is difficult to determine the purpose of the movement. Often, only pullbacks begin from time periods, and not full-fledged trend reversals, which can be misleading. In addition, it is not entirely clear why the periods in the Fibonacci sequence lengthen so far, then they cease to have any predictive value at all. There are more useful and adequate developments for studying cyclical changes in the market.
Fibonacci trend periods in trading
Another option for using Fibonacci time is trend periods. They differ in that they take into account the trend movement itself, plus correction (3 points). The further forecast is based on when the movement will end.
In my example, EURUSD reversed at the period border of 1.382. Unlike simple time periods, trend periods are quite useful and help you think differently about predicting reversals. If it is used in conjunction with other tools (extension, fan), it will act as a strong confirmation.
Fibonacci circles in trading
A rather exotic application of the Fibo sequence is circles. Again, the construction is carried out only along the section of the trend movement, i.e. at two points.
What are the advantages of circles:
- taking into account two planes simultaneously - time and price, i.e. correction, expansion, fan and even trend periods are immediately combined here;
- a rather long-term effect of forecasts, as in the case of a fan.
In my opinion, this is an interesting tool that allows you to look for profitable entry points with the highest degree of accuracy. However, it would be a good idea to use circles as a signal filter rather than as a full-fledged system.
Fibo spiral in trading
The use of spirals is based on the golden ratio model from Fibo numbers. The instrument is quite complex and ambiguous. The idea is that spirals help identify significant extremes.
In my opinion, using a spiral is extremely inconvenient and difficult due to the fact that the scale of the graph changes. In addition, there are absolutely no competent instructions and unambiguous ideas for its use in the Russian-language segment. Among the foreign analysts, Steven Maas uses it, and I will cite his colorful charts as an example.
From my experience, such tools overcomplicate trading and have mixed value. I don't see any advantages in using a spiral.
Fibonacci resistance arcs in trading
The next tool is arcs, much like circles. However, it is not worth comparing them, since the plotting results differ in the graphs. The key task of the arcs is to determine the target of the next movement after correction, i.e. resistance. An instrument is constructed based on two points of trend movement, an example is shown in the chart below.
The problem with arcs, like with spirals, lies in the fact that they are not really tied to scale. As a result, you can incorrectly adjust the graph to the values. For this reason, I don’t see much benefit in such a tool.
Fibonacci wedge in trading
In general, the wedge is a kind of analogue of the Fibo correction, but much less objective, which is again related to the price scale of the chart. The purpose of the wedge is to determine the end of the correction and support levels. It is built using trend movement (two points) and wedge boundaries for visual analysis of the chart.
The wedge becomes more convenient if its boundaries are drawn with a margin, so that the price is approximately in the middle of the wedge, and the upper arc touches the extremum. It is well suited as an analogue of Fibo correction.
Summary
Fibonacci correction is a good analytical tool , but its effectiveness directly depends on the trader. If you do not use filters that confirm the reversal of Fibo levels, their effectiveness will be low. Research by Adam Grimes proves that without filtering signals by Fibo levels, their value decreases .
I note that this tool is suitable for all systems without exception . It can act both as a filter when added to an existing vehicle, and as the basis of a strategy when building it from scratch. To strengthen your skills in working with Fibo levels, I recommend working with history and practicing trading using signals of this type on a demo account .
If anything remains unclear, ask questions in the comments. There you can also offer your ideas on Fibo levels and share your experience of working with them - this will be useful to other readers.
If you want to keep abreast of updates to my blog, subscribe to the telegram channel . With it you are guaranteed not to miss the release of new materials. With this I say goodbye to you. Good luck in conquering the financial markets, and see you soon!
If you find an error in the text, please select a piece of text and press Ctrl+Enter. Thanks for helping my blog get better!
Tips for effective use
Strategies with Fibonacci lines can be made more effective if you take into account the following 2 points:
- You should trade strictly in the direction of the trend
- Use technical analysis methods to more accurately determine the end of the correction.
No. 1 – Elliott waves and Fibonacci lines. It is difficult to speak in detail about Elliott waves, but one thing is certain: the market moves in waves and in a new trend, the wave, after the first rollback (correction), has the greatest potential.
We have discussed how to determine a change in trend more than once. But here's another way:
Every time a Fibonacci retracement is greater than 100% with a candle closing below the line, the trend is reset to zero.
Look for these opportunities - the first pullback after a trend change is the best trading opportunity the market provides.
No. 2 – add trend indicators. Fibo levels and lines should be used on a trend. Flat is not suitable. Two moving averages as a filter are your lifesaver.
#3 – Look for reversal patterns. Price action will always help determine the end of the correction and the beginning of a new wave. The simplest model is described here: “Swing Trader Entry Strategy.”
Use candlestick patterns. You don't need to use everything at once. Take a few patterns and work with them. Look for them near the main Fibonacci levels.
No. 4 – use oscillator signals. Another good way to “clarify” the end point of the rollback. Here: “Using the RSI indicator in swing trading”, you can find useful notes on this subject.
No. 5 – use multi-timeframe analysis. On higher time frames, all trading tools are more accurate. If your trading is intraday, then determine levels, trend, etc. not only on the hourly or minute chart, but also on the daily one.
The upward trend on the smaller timeframe should continue on the larger one. The correction level on the daily chart should not hit resistance on the weekly chart.
Read more in the article “Multiple Time Frames Strategy”.
This is all. Long - I know, tired - I understand. But get your act together – it’s your duty to the comrades to leave your review, comment, giveaway or something that will help us increase our experience. Use Fibonacci lines mega profitably, we are waiting for you to say a few words below in the comments, be successful!
Conclusion
To summarize, we can say unequivocally: “Fibonacci levels (lines) are very helpful in a trader’s work.” At the same time, you need to use the tool with your head, like everything else in life. As I wrote earlier in articles, it won’t work to just use levels and wait for a miracle. You need to learn to understand the market, and trading along Fibonacci lines (levels) should be a kind of filter so as not to open obviously unprofitable trades and to always be on top.
I hope I have fully covered the described topic, in any case, comments below, if anything is not clear, ask, we will think it through, add it, and we will figure it out in one word.
Happy trading to all of us.
Frustrated expectation
I hope you paid attention to the pictures. Examples in which there is no certainty are specifically given. I’m not writing a website for colorful pictures, like books do, I want to tell the truth, at least the one I know. The fact is that with fibo levels you will have to rack your brain and independently find the patterns of why and when there is a rebound from one or another level. There are many trading strategies using fibo (for example, Fibo + MACD), as the patterns are determined, I will post the strategies in the public domain, but you yourself should not sit and wait, but work and develop yourself.
When Fibo Retracement Levels Don't Work
Fibonacci levels are approximate guidelines and provide information regarding the likely movement, but are not absolute signals. It happens that support/resistance levels are broken through - the same thing happens with Fibonacci levels. The rules exist and work, but there are many exceptions, so it is advisable to check the signals with other instruments and insure yourself to the maximum when opening any position.
That is why all Fibo strategies involve the use of additional signals, an example is the Simple Breakout strategy:
Levels require careful development, constant refinement and filtering. It happens that the levels are broken through, that instead of a 50% rebound happens at 61.8, sometimes the price even goes past the levels and considers the significant ones to be weak, and the weak ones to be important. In view of all these features, it is important to be able to combine different instruments into strategies and constantly gain experience in trading with the selected funds.
Congestion zones
Fibonacci levels (lines) do not have to be laid out in a single copy. On the contrary, if a lot of levels seem to be combined into one, such a level only intensifies.
What is meant. There are plenty of peaks on the chart. According to our rules, we must apply a grid from peak to peak, but how can we understand whether we took the right peak, maybe we made a mistake. To do this, it was invented to overlay a grid of several peaks and look for where fibo levels will begin to accumulate. Let's draw.
There are two Fibo grids on the chart. Green ovals show places where fibo levels accumulate, but there are differences in them. Note the lower cluster and the upper one. Obviously, the upper cluster of levels seems to be drawn with one line, and do not forget that we installed two tools. As we can see, it was from the upper cluster that the reversal began.
It is important to note that when using a cluster of fibo levels, you should not overdo it and stretch too many grids, otherwise you may not even see the chart. I can’t answer how many grids are good and how many are bad, you have to come to this yourself during practice. So, the introduction is given, the rest is up to you.