Exchange rate for today: 73.3963 rub. -0.1303
- Recalculate:
- in rubles
- in hryvnia
- in tenge
- In Euro
According to the Central Bank of the Russian Federation as of May 26, 2021. Recalculation is carried out at the cross rate
Forecast Notifications: no
Install
Official dollar exchange rate for tomorrow
The exchange rate as of May 27 is 73.4737 rubles.
+0.0774 Data “for tomorrow” are published after 11:30 on weekdays. What does the exchange rate mean for tomorrow?
Show statistics
:
- for the last
- year
- month
- a week
- for 2021
- in 3 years
- during all this time
Dollar to ruble exchange rate table for 20 years
The table below shows the US dollar to ruble exchange rate over the past 20 years:
| Year | 2001 | 2002 | 2003 | 2004 | 2005 | 2006 | 2007 | 2008 | 2009 | 2010 |
| exchange rate, rub. | 29,17 | 31,35 | 30,69 | 28,81 | 28,30 | 27,17 | 25,58 | 24,86 | 31,83 | 30,36 |
| Year | 2011 | 2012 | 2013 | 2014 | 2015 | 2016 | 2017 | 2018 | 2019 | 2020 |
| exchange rate, rub. | 29,39 | 31,08 | 31,85 | 38,61 | 61,07 | 66,08 | 58,29 | 62,69 | 64,73 | 72,13 |
Current situation
The current state of the Russian economy is quite stable, despite the constantly worsening situation in the world. The state can still fulfill its debt obligations, so a repetition of the 1998 default in 2021 is unlikely. This opinion is expressed by analysts from the Higher School of Economics (HSE).
As experts note, in 1998 and in 2021, the country’s economy faced a crisis associated, first of all, with a decrease in energy prices. But today's situation is radically different from what it was in the late 90s. The key difference is the presence of sufficient reserves in the Central Bank and the low level of public debt. So far, HSE analysts are confident that a default in Russia is unlikely to be expected in 2021.
To support their words, experts cite the following facts:
- The total external debt at the beginning of 1998 was equal to 182.9 billion dollars. USA, of which 147.7 billion were government.
- As of July 1, 2020, the external debt of the Russian Federation was $65.5 billion. USA with a total debt of 477.3 billion. However, in 1998, the Central Bank’s gold and foreign exchange reserves were only 17 billion dollars. USA, whereas today – 600 billion.
Chart by year, dollar to ruble exchange rate
Often numbers in table form are difficult to analyze and do not allow you to see the big picture. We can only note that over 20 years the dollar exchange rate has increased almost 3 times, although during this time there were also years when it decreased, for example from 2004 to 2009.
In order to better understand how the value of currencies changes and make forecasts for the future, it is best to study graphs of currency fluctuations over different time periods: over 20 years, annual and monthly.
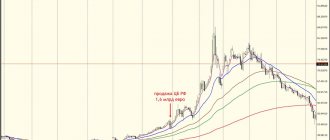
This graph shows the positive dynamics of the value of the US dollar against the ruble. We see that until 2014 the exchange rate was relatively stable, there were slight fluctuations, either down or up. But over the past 5 years, the value of the dollar against the ruble has almost doubled, with the largest price jump occurring in 2015.
In order to understand how events developed, it makes sense to consider exchange rate fluctuations over a shorter period of time, month by month.
Don’t panic: the ruble was promised a rebound
As the deputy chairman and chief economist of Vnesheconombank Andrei Klepach said on the sidelines of the Technoprom-2018 forum in Novosibirsk, the ruble exchange rate should be adjusted and by the end of the year it should be about 65-66 rubles per dollar. And although, according to him, “the risk of some weakening of the ruble remains, there is no reason for either panic or a collapse.”
“I think that now the ruble should win back the correction, because oil prices are high. Those who wanted to run away have already run away. I think that it will return to about 65-66 [before the end of the year] - this means that the outflow of capital is greater than we previously expected,” the TASS agency reports the economist’s words. At the same time, Klepach noted that by the end of this year or the beginning of next year, oil prices are expected to decline.
As the publication recalls, before the Central Bank’s decision to suspend foreign currency purchases, the dollar exchange rate on August 23 exceeded 69 rubles for the first time since April 5, 2021, and the euro reached 79.77 rubles for the first time since April 11 of this year. In August, the Russian currency lost about 10% amid tightening US sanctions. On Tuesday at 12:15 the dollar exchange rate is 67.44 rubles.
There really is no reason to panic at the moment, believes Mikhail Mashchenko, an analyst at the social network for investors eToro in Russia and the CIS. Firstly, he explains, the main negative is already included in the quotes, and secondly, Russians have already become accustomed over the past four years to a 10% drop in the exchange rate within a month. The value of the national currency depends on the dynamics of the dollar and the currencies of developing countries, which, in turn, will be influenced by the degree of tension in relations between China and the United States.
The divergence between the falling markets of EM countries and the growing US market has reached historical highs. And here, the analyst states, how the situation will develop further is absolutely unclear, which means that investors are unlikely to risk dealing with Russian assets, especially against the backdrop of the threat of new sanctions.
The trade confrontation between the United States and China remains the main risk factor for oil prices, since it could result in weakening demand from the main consumer of raw materials - China, and the renewed strengthening of the dollar should significantly adjust the cost of energy resources. Thus, Mikhail Mashchenko expects, the domestic currency may well end September at 68 rubles per dollar and celebrate the New Year near the level of 70 rubles per dollar.
Moderate optimism for the Russian currency is appropriate due to its undervaluation (expensive oil, budget revenues, dynamics of the trade balance), explains leading analyst Maria Salnikova. Thus, the devaluation is due to speculative factors (these are actual sanctions from the United States and fears of the growth of new sanctions by November 2021). However, given Trump’s aggressive foreign policy, it is difficult to guarantee calm in the foreign exchange market by the end of the year.
If two weeks ago there were no obvious concerns about the dynamics of the US Federal Reserve’s monetary policy, then statements began to be received about Trump’s dissatisfaction due to the expensive US dollar. Now the whole world doubts whether the Federal Reserve will be able to plan a rate increase not only for 2021, but also for December of this year.
The dynamics of the Russian currency, Salnikova believes, depends not only on internal factors, but also on external ones, therefore it is not yet possible to count on the stability of the foreign exchange market, given the outbreak of currency wars in the world. The maximum level of devaluation, according to our estimates, is 4.4% higher, near the mark of 70 rubles per dollar, the expert believes. The question of achieving the goal within the time frame remains open. Perhaps this goal will be achieved by the end of September, or perhaps by the end of the year.
Dollar exchange rate charts for 2014 and 2015
Monthly chart, dollar to ruble exchange rate for 2014
Monthly chart, dollar to ruble exchange rate for 2015
As you can see from these two images, a sharp jump in the value of the US currency occurred in November-December 2014. As we know, this period roughly coincides with the introduction of sanctions limiting Russia’s cooperation with other countries.
It must be said that not only the dollar-ruble pair reacts this way to economic events, but also all currencies of the world. But for us it is the most important one, since Russia sells oil and gas on the world market for dollars, which forms the basis of our economy.
Expert: The dollar has rolled back to the lows of the year and is ready to fall lower
The markets remain positive. At the same time, the dollar index is developing a pullback to the lows of the year, and Fed officials continue to mitigate fears of inflation. Leading analyst of the investment company FxPro Alexander Kuptsikevich told EADaily more about this
“Vice Chairman of the Federal Reserve Clarida convinced that the regulator would be able to overcome the surge in inflation and ensure its “soft landing” without breaking economic growth,” the expert recalls. — People with experience in the markets probably remember how these same words were uttered by the Fed about 15 years ago in hopes of cooling the housing boom and an overheated economy. Without going into an assessment of the correctness of such a policy in the long term, it is worth remembering that these years were accompanied by a confident recovery in stock markets and pressure on the dollar.
— What can you expect from the dollar now?
Now the world can roughly repeat this story, when the American currency index (DXY) lost 30% in two years with only minor pullbacks. Based on the past, we should expect pressure on the US currency to develop while the Federal Reserve is focused on economic growth rather than fighting inflation.
Of course, this is not a reason to expect a rollback of the dollar index from 100 points (2021 peak) to 70 next year. These would be levels below the all-time lows of 2008, when the DXY dropped to 71.
— How will this affect the currencies of other countries?
The need to continue the line of soft monetary policy by developed countries strengthens the demand for the currencies of developing countries. In particular, this morning the Chinese yuan rewrote 3-year highs against the dollar, sliding below 6.39. Earlier yesterday there were reports that the NBK is trying to resist the growth of the national currency. All these are also signs of the “zeros”.
Russia and China have already returned to filling their reserves: this restrains the recovery of national currencies and is good for exports.
An even more significant side effect of easing financial conditions in developed countries is rising commodity prices. Therefore, it is not surprising that oil prices are already at the highs of the last three years, threatening to break through significantly higher. Between 2002 and 2004, Brent doubled in price, reaching multi-year highs.
— What is the position of gold in such a situation?
The price of gold again exceeded $1,900 per ounce. This is close to the peak values of 2011, although it is still far from the highs of last August: then it was $ 2075. During the period from 2002 to 2004, the cost of a troy ounce increased by 80% - both then and now, pushing off from the bottom noticeably earlier than the dollar.
It is worth remembering that the beginning of the cycle of decline in the US currency in 2002 coincided with a turn to growth in national stock indices, and the S&P500 then grew by 50% with the assistance of a weakening dollar.
Is it worth buying dollars in 2021: TOP – 5 investor tips
Needless to say, if we are talking about large sums, it is always important to know in advance how such an acquisition will turn out. That is why below are 5 basic tips prepared by competent experts and financial analysts.
Tip #1: Moderation
You can invest in American currency, but only carefully. If we compare $ and €, preference is still given to the dollar, since its risks will be less than in the case of the euro. This is due, first of all, to the unstable political situation in the European Union, as well as the big difference between Eastern Europe and the traditional leaders: Germany and France.
Tip #2: To spend or not to spend?
An important criterion will be the answer to the question “what are you planning to do with the money?” If, for example, money is bought in order to store their savings in foreign currency, there are no questions. But what if a person wants to buy dollars and then spend them? Then, obviously, it is not worth purchasing funds.
The thing is that a negative exchange rate difference between the initial purchase and subsequent sale will reduce all efforts to nothing and everything will ultimately come to the point that a person will spend more than he wins.
Tip #3: Fifty-fifty
According to Komsomolskaya Pravda columnist Konstantin Smirnov, running to exchange offices is not at all necessary now. This is due to the fact that many Russians think that due to a new milestone in American history and, accordingly, in connection with the policies of Donald Trump, $ will soon rise in price, and if you buy them now, then you can sell them profitably later. But in reality, things are not quite like that.
Currently, the ruble also has a very good position, and therefore you can exchange only half of the funds for $ (and only if you really want to). If we talk about the exchange rate, then, according to the expert, during the year it will fluctuate between 60-65 rubles.
Tip #4: Wait until the end of the year
As you know, various championships and conferences will be held in Russia, which means that it is during this period that crowds of tourists from all over the world will pour into Russia. This state of affairs is characterized by an increase in interest in the domestic currency, that is, the ruble, and a corresponding weakening of the dollar’s position.
Therefore, you should have a little patience and just wait until the events take place and the flow of visitors to Russia subsides. Until then, unfortunately, there is no clear vision of the picture, and if during this period you purchase a large number of foreign banknotes, with a high degree of probability you will make a mistake.
Tip #5: One head is good, but two are better
Most experts and analysts unanimously advise turning to professionals and getting advice. If we are talking about large sums, then there is a high probability of making the wrong decision. And experienced experts already know how a monetary unit traditionally behaves in different periods of time, and perhaps will give advice on whether it is better to hurry up or, conversely, to wait. Therefore, for advice, only turn to specialists!
I really want to believe that this article was useful to readers, and people learned a fresh forecast for 2021 from it. Since in light of recent events, this topic is very relevant, it was impossible to simply pass by it without sharing useful information!
What factors may affect the USD in the near future?
Typically, the Central Bank of the Russian Federation publishes a table with data by day on its website. Among the factors that could significantly affect the dollar exchange rate in December 2021 are the following:
- The political situation in the world and the upcoming US presidential elections, scheduled for November 3.
- Cost of black gold. If oil prices rise in December, this will contribute to a significant decline in the dollar and strengthening of the ruble.
- The price of gold. A rise in the price of gold leads to a fall in the dollar. At the end of July 2021, the price of gold was a record amount of $1943.9 per troy ounce. Amid the pandemic and other economic problems, investors continue to invest in gold.
The economy of the Russian Federation after the collapse of the USSR and to this day is exclusively of a raw material nature. Russia mainly exports oil, gas, coal and other minerals, which it sells for dollars. The increase in its exchange rate is primarily due to the fact that by reducing the value of the ruble against the dollar, the government fills the country’s budget. The population does not gain anything from such a policy, but at the same time, such a political approach allows large raw materials companies, whose main income is foreign exchange, to get rich.
Change schedule:
Dollar exchange rate by year. Table:
| A period of time | Average value by month, in rubles | Average value for the year, in rubles |
| Mar. 2020 | 66.4437 | 63.37 |
| Feb. 2020 | 63.7413 | |
| Jan. 2020 | 61.8187 | |
| Dec. 2019 | 62.5831 | 64.55 |
| But I. 2019 | 63.8705 | |
| Oct. 2019 | 64.2548 | |
| Sep. 2019 | 64.4501 | |
| Aug. 2019 | 65.6046 | |
| Jul. 2019 | 63.1281 | |
| Jun. 2019 | 64.4326 | |
| May 2019 | 64.6314 | |
| Apr. 2019 | 64.6794 | |
| Mar. 2019 | 65.4111 | |
| Feb. 2019 | 65.6734 | |
| Jan. 2019 | 66.4036 | |
| Dec. 2018 | 66.7848 | 62.78 |
| But I. 2018 | 66.0499 | |
| Oct. 2018 | 65.7492 | |
| Sep. 2018 | 68.0447 | |
| Aug. 2018 | 66.8932 | |
| Jul. 2018 | 62.9471 | |
| Jun. 2018 | 62.7565 | |
| May 2018 | 62.3033 | |
| Apr. 2018 | 61.5539 | |
| Mar. 2018 | 57.0113 | |
| Feb. 2018 | 56.6278 | |
| Jan. 2018 | 56.5925 | |
| Dec. 2017 | 58.6932 | 58.25 |
| But I. 2017 | 59.0061 | |
| Oct. 2017 | 57.6869 | |
| Sep. 2017 | 57.7192 | |
| Aug. 2017 | 59.799 | |
| Jul. 2017 | 59.5787 | |
| Jun. 2017 | 57.4437 | |
| May 2017 | 56.756 | |
| Apr. 2017 | 56.3131 | |
| Mar. 2017 | 58.2437 | |
| Feb. 2017 | 58.0967 | |
| Jan. 2017 | 59.6526 | |
| Dec. 2016 | 61.6368 | 66.96 |
| But I. 2016 | 64.1833 | |
| Oct. 2016 | 62.4583 | |
| Sep. 2016 | 64.7579 | |
| Aug. 2016 | 64.8139 | |
| Jul. 2016 | 64.1127 | |
| Jun. 2016 | 65.1339 | |
| May 2016 | 65.9681 | |
| Apr. 2016 | 66.4756 | |
| Mar. 2016 | 70.2305 | |
| Feb. 2016 | 77.1326 | |
| Jan. 2016 | 76.5845 | |
| Dec. 2015 | 70.2244 | 61.15 |
| But I. 2015 | 64.912 | |
| Oct. 2015 | 62.7061 | |
| Sep. 2015 | 66.5954 | |
| Aug. 2015 | 65.0169 | |
| Jul. 2015 | 56.9774 | |
| Jun. 2015 | 54.3683 | |
| May 2015 | 50.3419 | |
| Apr. 2015 | 52.363 | |
| Mar. 2015 | 60.6649 | |
| Feb. 2015 | 64.2972 | |
| Jan. 2015 | 65.2869 | |
| Dec. 2014 | 54.4367 | 38.33 |
| But I. 2014 | 46.3379 | |
| Oct. 2014 | 40.7457 | |
| Sep. 2014 | 37.9861 | |
| Aug. 2014 | 36.1098 | |
| Jul. 2014 | 34.4258 | |
| Jun. 2014 | 34.3936 | |
| May 2014 | 34.7221 | |
| Apr. 2014 | 35.6656 | |
| Mar. 2014 | 36.2344 | |
| Feb. 2014 | 35.2366 | |
| Jan. 2014 | 33.6429 | |
| Dec. 2013 | 32.8658 | 31.82 |
| But I. 2013 | 32.6874 | |
| Oct. 2013 | 32.125 | |
| Sep. 2013 | 32.5091 | |
| Aug. 2013 | 33.0004 | |
| Jul. 2013 | 32.64 | |
| Jun. 2013 | 32.2822 | |
| May, 2013 | 31.3285 | |
| Apr. 2013 | 31.3169 | |
| Mar. 2013 | 30.7769 | |
| Feb. 2013 | 30.1245 | |
| Jan. 2013 | 30.2414 | |
| Dec. 2012 | 30.7599 | 31.09 |
| But I. 2012 | 31.4218 | |
| Oct. 2012 | 31.119 | |
| Sep. 2012 | 31.3992 | |
| Aug. 2012 | 31.8974 | |
| Jul. 2012 | 32.5287 | |
| Jun. 2012 | 32.8169 | |
| May 2012 | 30.9587 | |
| Apr. 2012 | 29.4711 | |
| Mar. 2012 | 29.2926 | |
| Feb. 2012 | 29.9181 | |
| Jan. 2012 | 31.4777 | |
| Dec. 2011 | 31.5633 | 29.39 |
| But I. 2011 | 30.8417 | |
| Oct. 2011 | 31.3361 | |
| Sep. 2011 | 30.4342 | |
| Aug. 2011 | 28.8647 | |
| Jul. 2011 | 27.8894 | |
| Jun. 2011 | 27.9805 | |
| May 2011 | 27.9608 | |
| Apr. 2011 | 28.1457 | |
| Mar. 2011 | 28.42 | |
| Feb. 2011 | 29.2859 | |
| Jan. 2011 | 29.9343 | |
| Dec. 2010 | 30.7528 | 30.34 |
| But I. 2010 | 30.9061 | |
| Oct. 2010 | 30.4256 | |
| Sep. 2010 | 30.8335 | |
| Aug. 2010 | 30.4493 | |
| Jul. 2010 | 30.5619 | |
| Jun. 2010 | 31.0761 | |
| May 2010 | 30.4956 | |
| Apr. 2010 | 29.2033 | |
| Mar. 2010 | 29.5195 | |
| Feb. 2010 | 30.1245 | |
| Jan. 2010 | 29.7199 | |
| Dec. 2009 | 30.0678 | 31.85 |
| But I. 2009 | 28.8345 | |
| Oct. 2009 | 29.3553 | |
| Sep. 2009 | 30.7931 | |
| Aug. 2009 | 31.6011 | |
| Jul. 2009 | 31.4143 | |
| Jun. 2009 | 31.1241 | |
| May 2009 | 32.0797 | |
| Apr. 2009 | 33.5098 | |
| Mar. 2009 | 34.8316 | |
| Feb. 2009 | 36.0195 | |
| Jan. 2009 | 32.6088 | |
| Dec. 2008 | 27.9802 | 24.85 |
| But I. 2008 | 27.3913 | |
| Oct. 2008 | 26.1791 | |
| Sep. 2008 | 25.269 | |
| Aug. 2008 | 24.3218 | |
| Jul. 2008 | 23.3727 | |
| Jun. 2008 | 23.6345 | |
| May 2008 | 23.7384 | |
| Apr. 2008 | 23.5083 | |
| Mar. 2008 | 23.7773 | |
| Feb. 2008 | 24.5392 | |
| Jan. 2008 | 24.4796 | |
| Dec. 2007 | 24.543 | 25.58 |
| But I. 2007 | 24.4874 | |
| Oct. 2007 | 24.9146 | |
| Sep. 2007 | 25.3613 | |
| Aug. 2007 | 25.6367 | |
| Jul. 2007 | 25.4989 | |
| Jun. 2007 | 25.9145 | |
| May 2007 | 25.8067 | |
| Apr. 2007 | 25.7994 | |
| Mar. 2007 | 26.13 | |
| Feb. 2007 | 26.306 | |
| Jan. 2007 | 26.528 | |
| Dec. 2006 | 26.2941 | 27.19 |
| But I. 2006 | 26.6548 | |
| Oct. 2006 | 26.8847 | |
| Sep. 2006 | 26.7625 | |
| Aug. 2006 | 26.7643 | |
| Jul. 2006 | 26.9123 | |
| Jun. 2006 | 27.0249 | |
| May 2006 | 27.0381 | |
| Apr. 2006 | 27.5876 | |
| Mar. 2006 | 27.847 | |
| Feb. 2006 | 28.1905 | |
| Jan. 2006 | 28.2958 | |
| Dec. 2005 | 28.7862 | 28.30 |
| But I. 2005 | 28.7896 | |
| Oct. 2005 | 28.5861 | |
| Sep. 2005 | 28.3755 | |
| Aug. 2005 | 28.4651 | |
| Jul. 2005 | 28.6805 | |
| Jun. 2005 | 28.5131 | |
| May 2005 | 27.9664 | |
| Apr. 2005 | 27.7997 | |
| Mar. 2005 | 27.6698 | |
| Feb. 2005 | 28.0007 | |
| Jan. 2005 | 27.9914 | |
| Dec. 2004 | 27.8887 | 28.81 |
| But I. 2004 | 28.668 | |
| Oct. 2004 | 29.1164 | |
| Sep. 2004 | 29.2171 | |
| Aug. 2004 | 29.2225 | |
| Jul. 2004 | 29.0871 | |
| Jun. 2004 | 29.0257 | |
| May 2004 | 28.9856 | |
| Apr. 2004 | 28.6162 | |
| Mar. 2004 | 28.5121 | |
| Feb. 2004 | 28.5011 | |
| Jan. 2004 | 28.8753 | |
| Dec. 2003 | 29.4394 | 30.67 |
| But I. 2003 | 29.8084 | |
| Oct. 2003 | 30.1235 | |
| Sep. 2003 | 30.6119 | |
| Aug. 2003 | 30.3304 | |
| Jul. 2003 | 30.3557 | |
| Jun. 2003 | 30.4209 | |
| May 2003 | 30.9351 | |
| Apr. 2003 | 31.2125 | |
| Mar. 2003 | 31.3976 | |
| Feb. 2003 | 31.648 | |
| Jan. 2003 | 31.8083 | |
| Dec. 2002 | 31.8574 | 31.36 |
| But I. 2002 | 31.8223 | |
| Oct. 2002 | 31.6809 | |
| Sep. 2002 | 31.6313 | |
| Aug. 2002 | 31.5608 | |
| Jul. 2002 | 31.5128 | |
| Jun. 2002 | 31.397 | |
| May 2002 | 31.2553 | |
| Apr. 2002 | 31.1733 | |
| Mar. 2002 | 31.071 | |
| Feb. 2002 | 30.8244 | |
| Jan. 2002 | 30.4999 | |
| Dec. 2001 | 30.105 | 29.17 |
| But I. 2001 | 29.75 | |
| Oct. 2001 | 29.525 | |
| Sep. 2001 | 29.43 | |
| Aug. 2001 | 29.35 | |
| Jul. 2001 | 29.23 | |
| Jun. 2001 | 29.12 | |
| May 2001 | 29.02 | |
| Apr. 2001 | 28.86 | |
| Mar. 2001 | 28.66 | |
| Feb. 2001 | 28.655 | |
| Jan. 2001 | 28.37 | |
| Dec. 2000 | 27.95 | 28.16 |
| But I. 2000 | 27.815 | |
| Oct. 2000 | 27.88 | |
| Sep. 2000 | 27.815 | |
| Aug. 2000 | 27.73 | |
| Jul. 2000 | 27.85 | |
| Jun. 2000 | 28.25 | |
| May 2000 | 28.3 | |
| Apr. 2000 | 28.59 | |
| Mar. 2000 | 28.46 | |
| Feb. 2000 | 28.74 | |
| Jan. 2000 | 28.515 | |
| Dec. 1999 | 26.77 | 24.62 |
| But I. 1999 | 26.315 | |
| Oct. 1999 | 25.76 | |
| Sep. 1999 | 25.405 | |
| Aug. 1999 | 24.75 | |
| Jul. 1999 | 24.29 | |
| Jun. 1999 | 24.25 | |
| May 1999 | 24.525 | |
| Apr. 1999 | 24.775 | |
| Mar. 1999 | 23.305 | |
| Feb. 1999 | 22.86 | |
| Jan. 1999 | 22.49 | |
| Dec. 1998 | 20.33 | 9.81 |
| But I. 1998 | 16.605 | |
| Oct. 1998 | 15.9706 | |
| Sep. 1998 | 15.6911 | |
| Aug. 1998 | 6.29 | |
| Jul. 1998 | 6.214 | |
| Jun. 1998 | 6.18 | |
| May 1998 | 6.1465 | |
| Apr. 1998 | 6.1265 | |
| Mar. 1998 | 6.09 | |
| Feb. 1998 | 6.051 | |
| Jan. 1998 | 5.999 | |
| Dec. 1997 | 5940.0 | 5785.29 |
| But I. 1997 | 5902.25 | |
| Oct. 1997 | 5877.0 | |
| Sep. 1997 | 5847.0 | |
| Aug. 1997 | 5810.0 | |
| Jul. 1997 | 5784.0 | |
| Jun. 1997 | 5782.0 | |
| May 1997 | 5771.0 | |
| Apr. 1997 | 5749.0 | |
| Mar. 1997 | 5704.25 | |
| Feb. 1997 | 5653.5 | |
| Jan. 1997 | 5603.5 | |
| Dec. 1996 | 5537.0 | 5122.46 |
| But I. 1996 | 5484.0 | |
| Oct. 1996 | 5434.0 | |
| Sep. 1996 | 5371.5 | |
| Aug. 1996 | 5285.0 | |
| Jul. 1996 | 5136.0 | |
| Jun. 1996 | 5055.0 | |
| May 1996 | 4992.5 | |
| Apr. 1996 | 4905.0 | |
| Mar. 1996 | 4834.0 | |
| Feb. 1996 | 4755.5 | |
| Jan. 1996 | 4680.0 | |
| Dec. 1995 | 4633.5 | 4558.13 |
| But I. 1995 | 4534.5 | |
| Oct. 1995 | 4504.0 | |
| Sep. 1995 | 4468.0 | |
| Aug. 1995 | 4408.0 | |
| Jul. 1995 | 4538.0 | |
| Jun. 1995 | 4726.0 | |
| May 1995 | 5039.0 | |
| Apr. 1995 | 5040.0 | |
| Mar. 1995 | 4745.0 | |
| Feb. 1995 | 4200.5 | |
| Jan. 1995 | 3861.0 | |
| Dec. 1994 | 3383.0 | 2200.42 |
| But I. 1994 | 3131.0 | |
| Oct. 1994 | 3005.5 | |
| Sep. 1994 | 2301.0 | |
| Aug. 1994 | 2117.0 | |
| Jul. 1994 | 2022.0 | |
| Jun. 1994 | 1952.0 | |
| May 1994 | 1877.0 | |
| Apr. 1994 | 1787.0 | |
| Mar. 1994 | 1720.0 | |
| Feb. 1994 | 1567.5 | |
| Jan. 1994 | 1542.0 | |
| Dec. 1993 | 1237.0 | 926.71 |
| But I. 1993 | 1186.5 | |
| Oct. 1993 | 1189.0 | |
| Sep. 1993 | 1006.0 | |
| Aug. 1993 | 985.5 | |
| Jul. 1993 | 1025.0 | |
| Jun. 1993 | 1075.5 | |
| May 1993 | 934.0 | |
| Apr. 1993 | 779.0 | |
| Mar. 1993 | 662.0 | |
| Feb. 1993 | 566.5 | |
| Jan. 1993 | 474.5 | |
| Dec. 1992 | 416.0 | 283.18 |
| But I. 1992 | 433.0 | |
| Oct. 1992 | 342.0 | |
| Sep. 1992 | 210.5 | |
| Aug. 1992 | 162.5 | |
| Jul. 1992 | 135.1 |
The presented table is based on data published on the official website of the Central Bank of the Russian Federation. Note that from 1992 to 1997, the value of the dollar in relation to the ruble was calculated in thousandths. After denomination (cutting off three zeros) in 1998, it began to be calculated in several units.
We recommend that you familiarize yourself with changes in US government debt in real time -.
Mentions of the 2014 crisis in films and books
A number of books are devoted to the political crisis of 2014 in Ukraine, including:
- “Ukraine is an eternal Ruin” L.R. Vershinina (2014);
- “Independent Ukraine. The Collapse of Protest” by M. Kalashnikov, S. Buntovsky (2014);
- "Ukraine. Economics of turmoil or blood money” by V. Katasonova (2015);
The events of the spring of 2014 in Crimea, which became the main harbinger of the economic crisis in Russia, are the subject of the film “Crimea” by A. Pimanov. It was released in September 2021.
The Ukrainian documentary series “Maidan” by S. Loznitsa is dedicated to the events of Euromaidan. It was released in 2014.
Ukrainian crisis 2014: its causes and consequences
The main reason for the political crisis in Ukraine in 2013-2014. was the government's refusal to sign the country's association agreement with the EU. One of the reasons why the 2014 crisis occurred in Ukraine is the contradictions between the western and eastern regions of the country. The former are distinguished by their pro-Western position, the latter are committed to maintaining relations with the Russian Federation.
Kyiv. Maidan 2014
The causes of the crisis also lay in the instability of the Ukrainian economy. The country's gold and foreign exchange reserves had decreased, and there were large debts to Gazprom and the IMF for loans received earlier.
The political crisis of 2013-2014 escalated into armed clashes in Kyiv. Its consequence was a change of power in the country. Subsequently, protests spread to the southeast of Ukraine due to dissatisfaction with the new government. The main consequence of the crisis in Ukraine in 2014 was the armed conflict in the Lugansk and Donetsk regions. The outbreak of the Crimean crisis in 2014 led to the annexation of the peninsula to the Russian Federation on the basis of a referendum held for its residents.
The Ukrainian crisis of 2013-2014 provoked a worsening of relations between the Russian Federation and Ukraine, which led to the introduction of EU and US sanctions against Russian companies and political figures.