The IRR of a project is understood as the value of the discount rate, at which the total amount of investments in the project (cash flows or net present value, which is denoted as NPV) is equal to zero.
That is, if the IRR value turns out to be 0, then the investor simply returns his funds, if less, the project brings a loss, and more, a profit.
Calculating IRR is usually used not so much to calculate the profitability of a specific project (there are other, more effective and visual methods for this), but to compare the performance of several projects. So, when we are talking about different types of investments with completely different amounts and frequency of cash injections, it is sometimes difficult to understand which option brings more net income. It is the internal rate of return of the project that allows you to immediately see what is more profitable and efficient.
Before calculating IRR, NPV is first calculated (reducing the total investment amount to the price “for today”), and then the rate of return is calculated. Other names for IRR are internal rate of return, internal discount rate, efficiency (payback) ratio, sometimes simply called “internal rate”.
Both indicators - IRR and NPV - are considered as complementary criteria that are important for assessing the effectiveness of the implementation of an investment project.
What is IRR of an investment project in simple words and why is it needed?
From English, the term Internal Rate of Return (the abbreviation of which is IRR) is translated as “internal return rate”.
This name characterizes the indicator in the simplest and most accessible way. The internal rate of return of an investment project represents the rate of profitability at which discounted self-sufficiency is achieved. All project cash flows are divided into two groups: these are incoming flows with a plus sign (profit from commercial activities) and outgoing flows with a minus sign (all costs of implementing the project, investments). It turns out that in order for the project to be launched at all, these two types of financial flows must ultimately yield 0. That is, expenses must be compensated by income; if the indicator is less, the project is considered unprofitable and will not pay for itself; if it is more, it is profitable.
As mentioned above, usually the level of profitability of a particular project is calculated by other methods and all the data is in the business plan. But when we are talking about two different types of projects, it makes sense to find and calculate the IRR for all, and then simply compare the numbers.
It is important to remember here that self-sufficiency must be “discounted” - one that takes into account various interest rates operating during the investment period (this could be interest rates in a bank, the level of devaluation, the inflation index, etc.).
The calculation of IRR allows you to take into account a special adjustment factor - a discount rate, which demonstrates the level of efficiency in the use of capital in comparison with other business investment options for a similar time period.
The main goals of calculating the internal rate of return:
- Assessing the profitability of an investment - the higher the indicator in numerical terms, the more profitable and successful the project is considered.
- Determination of maximum annual rates subject to borrowing capital (especially if we are talking about loans from a bank: for example, if the interest rate is higher than profitability, the project will be unprofitable).
- Comparison of several projects involving different cash injections, phased investments, differing deadlines, profit levels, etc.
Calculation of IRR for monthly cash flows
With Excel, it is possible to calculate the profit level of projects with identical time periods between flows . Let's take an example where rent is paid monthly. In this case, the table would contain 36 positions about the board. For this situation, the result would be 0.05% monthly.
To get an independent result, set the “assumption” field to 0.03. Without specifying this information, an error will appear.
How to calculate IRR correctly
Having understood what the IRR of an investment project is, it is worth considering how it can be calculated. There are several calculation methods - using a formula or Excel table, as well as a graphical method. You can also find special calculators on the Internet, in which you simply need to enter values and get the desired indicator.
Formula and example of calculation in economics
To calculate IRR, the original formula is presented as an equation:
Here:
- NPV is the net present value of the project under consideration.
- N – number of billing periods (most often years).
- T – number of a specific billing period.
- IS – initial and subsequent project costs (start-up investments).
- IRR – internal rate of return.
The extremely low IRR is equal to the NPV value corresponding to zero. That is, the current value, calculated using the IRR profitability rate, must be equal to self-sufficiency. Thanks to formula transformations, you can find the minimum IRR:
Here:
- IRRmin – minimum value
- N – number of billing periods.
- IST is the amount of investment in each period.
- IS – total number of investments.
Calculation in Excel table
When calculating the internal rate of return, the formula is not always used. You can also calculate the internal rate of return in Excel, which has a built-in IRR function.
How to calculate the average rate of return in Excel:
Login to the program.- Creation of a book indicating a cash flow table, dates. One value must have a negative exponent (this is the amount of investment). The table can include information about multiple projects if they need to be compared.
- Next, you select the IRR function (the Russian interface designates it as VSD or VND), then you need to press fx.
- Marking the section of the desired column with all the data that you plan to analyze. Something like IRR(B4:B:15.2, 7.1%) should appear in the line. Click on “OK”.
Graphical method for determining IRR
To search for an indicator, not only a calculation formula is used, but also a graphical method. It is more visual, but also less accurate. To construct a diagram, you need to perform certain calculations, but here the accuracy requirements are much lower. Yes, and the source data may be inaccurate.
The essence of the method is to determine the value of the limiting value of IRR in the form of the point of intersection of the graph line and the coordinate axis (the zero mark of profitability). Typically, graphs of present value versus discount rate are drawn manually or using the chart function in Excel.
There may be several graphs, and deciphering them involves searching for a more preferable investment project - the one whose value of the marginal profitability of an investment will be located further from the zero point.
Analysis of the received data
Before calculating the internal rate, it is necessary to understand what the economic meaning of this indicator is and how to correctly interpret it. When the IRR rate is found, you need to decipher it. Obviously, the higher the indicator, the faster the project pays off. But a negative IRR shows that the project is clearly unprofitable and will not pay off.
But the values can be completely different and there is little knowing whether the project will pay off or not. It is advisable to obtain as much information as possible from the indicator. Experts argue that there is no optimal IRR value - it is different for each project and it makes sense to analyze only the numbers in comparison.
Basic rules and regulations of IRR:
- The indicator must be higher than the discount rate.
- If the indicator is less than RT, the project is unprofitable and is not worth investing.
- If IRR is equal to RT, the investment will simply pay off, but will not provide a profit.
- When IRR is greater than RT, there will be income, and the higher the indicator, the more.
It is also possible to compare the indicator with the minimum value of the expected profitability of the investing company.
Advantages and disadvantages of IRR
IRR alone is of little use. Therefore, before you calculate IRR in Excel or on a graph, you need to know why to do it.
The main disadvantages of the IRR indicator:
- The internal rate of return does not take into account the effect of refinancing the profits received at the expense of income.
- The coefficient is a relative value and does not show amounts in monetary terms (interests do not in all cases demonstrate the required data).
- Subject to additional investments, all calculations must be performed anew each time, obtaining several values.
One of the advantages of the indicator is that it is indispensable in comparing the effectiveness of investing in diverse projects for different time periods and with a strong gap in the amount of amounts. And in situations where you simply need to determine whether the project will pay off and what amounts are needed to achieve zero, IRR is quite indicative.
Calculation of IRR for unequal time intervals between cash flows
Excel will make it possible to perform the necessary mathematical operations even when the money arrives at different times. Then it is better to use another function - PURE INDOW. Here you will need to enter indications not only of receipts, but also indicate the date when they were credited.
Let's take a real estate project: we want to get rid of our living space at the end of 4 years, then there were enrollments. But at the end of 3 years, no fee was paid. In this case, the yield level will decrease by 4.53% per year.
It is worth noting that the standard can only be determined when using the second function, since the VSD does not take into account changes in time intervals .
The difference between the modified internal rate of return MIRR and IRR
Certain shortcomings of the internal rate of return can be offset by a more complex version of the formula. The modified version eliminates all the uncertainties that arise from multiple injections of investment in non-standard conditions.
How should MIRR be measured:
- Income (cash flows with a plus sign) are given as of the estimated completion date of the project. Here they take the WACC rate, which is formed by the weighted average cost of capital.
- Primary and subsequent investments (cash flows with a minus sign) are given at the starting date of the project in accordance with the discount rate.
- The MIRR indicator is equal to the rate of return, which corresponds to the self-sufficiency of the investment project by the date of its completion.
Formula for modified internal rate of return:
Here:
- N – investment period in years.
- DC – investment amounts.
- DF – income from investments.
- WACC – weighted average cost of capital.
- R – discount rate value.
- i – period number.
The formula allows you to accurately calculate everything due to the fact that it takes into account the probability of reinvesting the income received from the project at the discount rate. If you use Excel, the complexity of calculations is significantly reduced - for this you need to use the MIRR (or MVSD) function.
If mutually exclusive projects are compared, then the MVSD methodology is used where the amounts of initial investments are approximately equal and the investment horizons imply approximately identical terms.
The disadvantage of the formula is the low probability of stability of the reinvestment rate throughout the entire period under review.
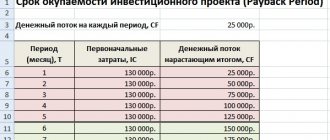
Payback period of investment
It is equally important to calculate the payback period or, as they also say, the internal rate of return. To do this, you need to take two monetary indicators:
- the amount of initial investment;
- annual income minus expenses.
The calculation formula is as follows:
Initial investment: annual income minus expenses = payback period
This is a simplified calculation, but it roughly and quickly shows how interesting the investment project is. For example, in the case of buying an apartment for 5 million and renting it out for 25 thousand, the internal rate of return, or payback period, will be:
5,000,000 rubles: 300,000 rubles = 16.6 years.
How to use the IRR indicator to assess the effectiveness of a project's investment capital
Any investment project has several important conditions: initial investments, a certain period of operation of the project and the profit received during this period. IRR shows the lending rate at which an investment will not result in a loss. That is, the level of profit in percentage at which the investment will be returned and the project will pay off, but will not bring anything additional.
The basic rule for evaluating projects for investment is as follows: if the IRR value of the project under consideration is greater than the amount of capital, then the project can be opened. Taking into account the fact that the indicator can be calculated or converted into a percentage, IRR shows the percentage at which borrowed funds will pay off. And if the resulting value is greater than the loan rate (the percentage at which funds were taken for investment in the project), then the business will be profitable.
So, for example, if you take a loan from a bank at 12% per annum and invest in a project that will give 17% per annum, you will make a profit. If the internal rate of return of the project is less than 12%, the project will only produce losses. The banks themselves work according to the same scheme: for example, they attract funds from the population at 10% per year and issue loans at 20% per year.
Having calculated the IRR, the investor receives an upper limit for the acceptable cost of borrowed capital that is invested. If the cost of capital is higher than the IRR, the project is unprofitable. If the cost of capital for a company is lower than the found IRR of the project, the company will be able to exist for the difference between the interest on the bank loan and the profitability of the investment.
Example 1: time deposit in Sberbank
This example of calculating IRR is the simplest and most understandable. The initial data is as follows: you have 6,000,000 rubles available, which can be deposited in Sberbank by making a deposit for 3 years at 9% per year without capitalization or 10.29% per year with capitalization every month.
In our example, interest is planned to be withdrawn at the end of the year, so there will be no capitalization and the result will be 9% per year - the amount is 6,000,000 x 0.09 = 540,000 income per year. At the end of the third year, it will be possible to withdraw interest on it and the principal amount by closing the deposit.
A bank deposit is considered an investment project, and IRR can be calculated for it. The IRR for an investment in a deposit is equal to the deposit interest rate – 9%. And if 6,000,000 rubles have been accumulated or inherited, they can be invested (after all, the cost of capital is 0). If you plan to borrow money from a bank and invest it in another, then the interest rate of borrowed funds should be below 9%; if higher, the project will not pay off.
Example 2: buying an apartment to make money by renting it out
Here the initial data is as follows: the object of investment is an apartment that is planned to be rented out. Its purchase will cost the same 6,000,000 rubles. The rent will be 30,000 per month, for a year 360,000 rubles, for 3 - 1,080,000. It turns out that if we take 3 years into account, then it is more profitable to deposit funds in the bank.
The IRR of the project, provided that an apartment is purchased and rented out for 3 years, and then sold, is 6%. That is, if you take out borrowed funds to implement a project, the interest rate must be less than 6% in order to make a profit. And over the course of 10, 15 years, the IRR will not change, the only exception being the situation with the rise in price of the apartment.
The internal rate of return is an important and interesting indicator that, if used correctly, can be used quite effectively to calculate the profitability of different investment projects, especially when it comes to comparing them and choosing the most profitable one.
Buying a bond
Let's calculate the profitability of investing in bonds. Take, for example, the bonds of Tinkoff Bank, which, by the way, are traded on the New York Stock Exchange in dollars. Let's determine the necessary indicators:
- coupon income for the year - 140 USD;
- par value of the bond - 1000 USD;
- market current value of the bond – 1166 USD;
- time to maturity – 2 years.
Let's perform several steps to calculate using the formula:
(A + B)/C
- A = coupon income for the year;
- B = (face value - current value) / time to maturity;
- C = (nominal value + current value) = 2.
(140 + ((1000 – 1166)/2)) / (1000 + 1166) : 2
(140 + (-83) / 1583 = 0,036 * 100 % = 3,6 %
As we can see, there is profitability, the indicator is above zero, but so small that we need to think about return on investment.
We will buy 5 million shares, converting this money into dollars at the rate of 58 rubles. for a dollar.
Total = 86,206 USD. We buy 74 bonds with them.
In 2 years we will receive a certain profitability:
- For the first year - 140 USD * 74 bonds = 10,360 USD.
- For the second year - 140 USD * 74 bonds = 10,360 USD
Total - 20,720 USD. If the exchange rate has not changed, then 20,720 * 58 rubles = 1,201,760 rubles.
But we will receive the initial investment at nominal value:
74 bonds * 1000 USD = 74,000 USD
Total in dollars: 74,000 + 20,720 – 86,206 = 8,514 USD for 2 years or 4,257 USD for each year. Let's convert into rubles at the rate of 58 rubles = 246,906 rubles per year.