Of all the reversal patterns and patterns we use in the Forex market, the rising wedge and falling wedge are my (Justin Bennett) favorites. This pattern really gives huge profits with precise entry and exit from the market. And suitable for traders who consider patience to be their advantage.
One of the great advantages of the wedge shape is that it is formed from levels that are easy to identify. This, in turn, makes things much easier for traders, not to mention profitable.
Let's start by defining the characteristics.
Description of the technical analysis pattern Wedge
Technical analysis figure Wedge refers to graphic figures that are designed to help the trader determine what stage the market is at the moment. The pattern refers to reversal and continuation patterns at the same time. Accordingly, it can occur both at the end of a trend and within a trend.
To identify a pattern, it is important to know one thing, the most important rule:
The Wedge pattern appears after a trend movement.
What is meant here is not that after each trend movement, a Wedge figure will definitely appear, it means that the first condition after which a wedge can appear is a trend movement.
It doesn’t matter at all whether it is a monthly trend or a daily one, the main thing is that there is a unidirectional movement in the market.
Growing wedge
Wedges are a very popular type of technical analysis pattern. They are often used to determine the trend reversal zone.
A rising wedge is formed by a decrease in price volatility between two sloping support and resistance lines. At the same time, the angle of inclination of the support line is steeper than the resistance line. This is an indication of faster formation of upper lows than upper highs. This creates a wedge that the price inevitably breaks through.
Since a rising wedge forms in a rising trend, it is usually used as a reversal signal.
And here we measure the reversal effect of the wedge using a technique similar to what we used in the head and shoulders. We “apply” the distance from the base of the wedge formation to the breakout in order to roughly estimate the effect of the price movement.
And, as we see, the effect is quite satisfactory. Now let's look at a rising wedge after a strong downtrend.
Obviously, in this case, the wedge was a harbinger of further strong price movement along a downward trend. In such a situation, it is a typical signal not of a reversal, but of a continuation of the trend.
Again we measure the distance in our good old way. This is how rising wedges are used:
- in a growing trend as a reversal signal;
- in a downtrend as a signal of trend continuation.
Falling wedge
Like a rising wedge, this option can be both a signal of a reversal and its continuation.
In a downtrend, a falling wedge often acts as a reversal signal. Absolutely the same rules apply here as for his growing brother.
The trend is down, the price updates lower lows, but even faster - lower highs. All signs of an upcoming trend reversal.
Voila, a great wedge breakout move. We measure the distance as expected. Everything is great. Now, on the contrary, the falling wedge is in an uptrend. This is usually a signal for its continuation.
A strong upward trend, the price doubts for a long time, but only to continue this trend. Everything is in the logic of market movement.
What does the Wedge technical analysis pattern look like?
Like any other figure, movement inside the Wedge is limited by support and resistance levels.
The Wedge is somewhat reminiscent of the Triangle figure. Both here and there, traders are squeezed into a “vice”, after which a shot occurs and the price cannot be caught up. The difference between Triangle and Wedge is not big. The Triangle clearly points its cone to the right side of the chart, thereby confirming that there are two strong sides in the market, then the Wedge has two types:
- descending Wedge;
- rising wedge.
Let's draw up rules by which we will determine this or that type of Wedge.
Descending Wedge pattern
The Descending Wedge has downward lines directed at different angles, which sooner or later must connect. It can occur both in an uptrend, in which case it should be classified as a descending Wedge on an uptrend, and on a downtrend, a descending Wedge on a downtrend.
When a descending Wedge pattern appears, we should expect an upward price breakout.
Rising Wedge figure
The Rising Wedge has upward lines directed at different angles, which sooner or later must connect. It can occur both in an uptrend, we are dealing with a rising Wedge in an uptrend, and in a downtrend or a rising Wedge in a downtrend.
When a rising Wedge pattern appears, we should expect a downward price breakout.
Double top and double bottom
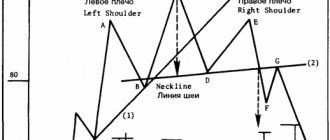
The double top is a reversal pattern that is very easy to understand. It is formed near the resistance line and represents a situation when the price fails to break through the resistance twice. The structure is clear from the picture:
By the way, pay attention in the screenshot above that the second top is slightly lower than the first - this is a good signal that the resistance will not be broken and the price will reverse. The entry is made either at the second peak or at the level of the neck line.
Let's see how the situation developed further:
In this case, the amplitude of the price fall is usually equal to the height of the two-peak figure itself. In addition, I would strongly recommend looking for such patterns only after strong trends. In a sluggish, sideways market, such figures do not play a special role. In addition, traditionally such figures look from the 1-hour TF and above.
Double bottom
A similar situation, only on the contrary, a double bottom is two attempts by the price to break through the support line.
If the second bottom fails to break through support, the entry, as in the first case, is either at the second top or at the neck line (and a rollback from it).
And remember - after strong trends. There is no need to look for such figures in a sluggish, low-volatility market.
How to trade the Wedge pattern
The Wedge pattern is very easy to trade. I’ll write out the action plan point by point, all you have to do is tick off the fulfilled conditions and trade.
How to trade a falling wedge
- A previous trend (no matter upward or downward) is required.
- The price should be sandwiched between resistance and support levels, and those, at one time, should be directed downward in a cone.
- According to statistics, a descending Wedge is broken upward. Therefore, we are waiting for it to consolidate above the resistance level.
- Opening a trade:
- Aggressive entry. As soon as the price goes beyond the descending Wedge and consolidates (it is enough to see the candle closing above the resistance), you should open a purchase.
- Conservative entry. After the price leaves Klin, we wait for a retest of the broken level and open a purchase.
- StopLoss should be set below the support level or local Low.
- TakeProfit is calculated based on the height of the Wedge base and is plotted from the breakout point. Two takes are provided, the first is equal to the height of the base, the second, the height of the base is multiplied by 2.
How to trade the rising wedge
- A previous trend (no matter upward or downward) is required.
- The price should be sandwiched between resistance and support levels, and those, at one time, should be directed upward in a cone.
- According to statistics, the rising Wedge is broken down. Therefore, we are waiting for it to consolidate below the support level.
- Opening a trade:
- Aggressive entry. As soon as the price goes beyond the rising Wedge and consolidates (it is enough to see the candle closing below the support), you should open a sale.
- Conservative entry. After the price leaves the Wedge, we wait for a retest of the broken level and open a sale.
- StopLoss should be set above the resistance level or local Hi.
- TakeProfit is calculated based on the height of the Wedge base and is plotted from the breakout point. Two takes are provided, the first is equal to the height of the base, the second, the height of the base is multiplied by 2.
The rules are very simple, if everything is clear, I would like to move on to working examples, otherwise, write your questions in the comments, I will try to answer.
Classic version of the wedge model trading
Wherever the price moves after breaking out of the price pattern, entry is always made at a retest to the nearest trend line or extreme.
Trading scheme of the wedge graphic model
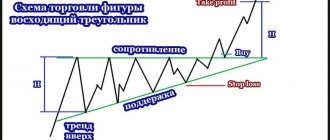
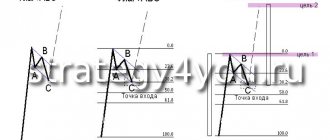
When forming an ascending pattern, it is desirable to identify at least three touches of the trend lines from above (points 1, 3 and 5), as well as from below (points 2, 4 and 6). In this wedge, we see that rollbacks are reduced and the price does not make sharp movements within its boundaries. After the maximum narrowing of the structure (6-7), an impulse exits the boundaries of the figure (7-8).
It is important not to enter the market at section 7-8, but still wait for confirmation and a return to the level from the extremum 6 or the lower slope. The signal for a deal in this case will be point 9.
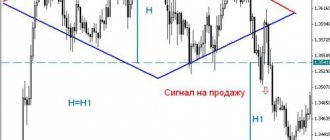
If we consider the falling trading model, then everything is exactly the opposite. Here our lines approach at an angle downwards, but the main thing is that the entry point is always 9. The breaking of the upper line occurs after the formation of a narrow zone of the structure. And then everything is standard - a return to the level of point 6, which indicates the end of the downward trend and a buy deal is concluded.
Continuation figures
If you look at a figure with a continuation of movement, then the price exit goes in the direction of the main trend. The rules for returning the price to the extreme level (point 5) or the slope for a retest remain the same, after which a long position is opened.
Mirror trading scheme for sale:
I do not recommend trading the model for continued movement due to the low potential of the transaction and the frequency of false entries. In any case, trading statistics will not be on your side.
Setting a stop loss
The rules for setting a stop loss are always the same, namely, it is necessary to set a safety order SL for the last extremum.
It is very important that this peak is within the wedge structure.
This considered maximum or minimum can be either intermediate or a top (bottom of the market)
Setting a stop loss for a wedge pattern
Placement of take profit
Let's look at the main methods for placing take profit:
- On a strong level. It is important to understand that there may be several such levels on the price path.
- The target level is equal to the distance of the first wave. The distance from the top (bottom) point of the market in the opposite direction is plotted.
Setting take profit of the wedge pattern on the first wave - Determining the target of the transaction using Fibonacci levels. More details can be found in the article Fibonacci levels in trading, application, strategies and indicators
- Output on the opposite signal. Such a signal can be any entry point according to your strategy, a Price Action pattern or a signal according to computer analysis.
Trading strategy based on the Wedge pattern in the Forex market
Below, I presented four screenshots for each case separately. I won’t go into too much detail, just specifics, let’s clearly go through the points and summarize.
Example of trading a descending wedge on a downward movement
The EURUSD currency pair is traded on the Forex market.
- We have a clearly expressed downward trend.
- In a downtrend, a downward wedge is formed. Already at this stage, we should expect a further upward price movement and consider only purchases.
- After the Wedge breaks upward and the price consolidates, we open a buy position.
- StopLoss is set below the local Low.
- TakeProfit is equal to the height of the base of the Wedge, laid down from the breakout point. We place an additional take at a distance of h*2.
Example of trading a descending wedge on an upward movement
The EURUSD currency pair is traded on the Forex market.
- Before the Wedge appears, there is a short upward trend.
- In an uptrend, a descending wedge is formed. It is already known from theory that this type of Wedge foreshadows further upward movement.
- After the Wedge breaks upward and the price consolidates, we open a buy position.
- StopLoss is set below the local Low.
- TakeProfit is equal to the height of the base of the Wedge, laid down from the breakout point. We place an additional take at a distance of h*2.
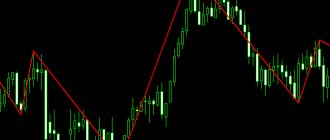
An example of trading a rising Wedge on a downward movement
The AUDCHF currency pair is traded on the Forex market.
- There is a two-day downward movement, we classify it as a downward trend.
- In a downward trend, an ascending wedge is formed, a harbinger of sales.
- After the Wedge breaks through and the price consolidates, we open a sale.
- StopLoss is set above the local High.
- TakeProfit is equal to the height of the base of the Wedge, laid down from the breakout point. We place an additional take at a distance of h*2.
Triangles
No less popular topic than head and shoulders and rectangles. The triangle is formed based on simple market logic: market volatility decreases before a further breakthrough. And this process is very easy to formalize in the form of a simple triangular figure.
From the same figure, such pennants are formed - a kind of triangle with a “handle” in the form of long candles.
Let's say this is a flag for a downward trend.
The figure, in this case, is working out further movement along the trend.
The opposite situation occurs with an uptrend.
The trend continues. Don't forget to measure the range of motion.
And here is an example of a symmetrical triangle, beautiful and pleasant. Two inclined lines converge towards each other. In this case, it is difficult to say the direction of the breakdown, but we know that it will definitely happen. After all, in the market, one side always prevails, sellers or buyers.
Here is a breakdown according to the general trend.
Ascending Triangle
In this figure, one side of the triangle acts as resistance. However, the question is what will happen when the price approaches the very top of the triangle. Will she be able to break through the resistance or, on the contrary, will she roll back?
The forum has detailed statistics on practicing such figures, links to which are at the end of this article. In the meantime, you should be prepared for a breakout in either direction. This is how the triangle worked in this case.
Descending triangle
The opposite situation. The bottom side of the triangle acts as support. As a rule, the price breaks through such a line and moves on, however... not always. If the support is too strong, the reversal will be in the other direction.
In Forex, it is easier to exploit such figures, since you can place a breakout order in the desired direction and go about your business. In binary trading, you need to wait for a breakout, then a small rollback, and only then open a trade in the direction of the breakout.
We place take profit
For the wedge model, it is relatively easy to determine significant key levels, since the figure itself is formed in steps.
Rising wedge:
We pay attention to the lows of each swing. These levels are a great starting point for potential profit levels if you trade short.
Falling wedge:
Some key levels may align perfectly with these lows and highs, while others will deviate somewhat.
Setting a stop loss
Each wedge pattern is unique and will therefore have different highs and lows. The main rule of setting a stop loss is to set the stop loss at a level where your trading setup will be considered invalid.
Stop loss is set above the high. If the price reaches the latest high, it will no longer make sense for us to remain short.
And what is the result?
The Wedge figure must consist of at least 3 “waves” and contain at least 4-5 points to form the boundaries. It is very difficult to predict the moment of breakdown. If you only catch the moment of the breakdown, it often turns out to be “false”, and if you wait for a retest, then you can lose the main impulse. Additional signals from trend instruments are needed, and information about the arrangement of volumes (at least tick volumes!) will be especially useful.
May also be useful:
- oscillators with a large period (at least 10) - they are required to search for divergence situations.
- Fibo levels – will help you determine intermediate key levels
- Elliott indicators, because such patterns often occur in sections 2 and 4 of the classical wave pattern.
Technical analysis considers the Wedge to be a pattern of medium complexity - it is quite difficult to recognize, and all such trading patterns are quite unstable. Binary options are not traded this way. The disadvantage of the model can be considered a large number of “false” breakouts. The main thing is to identify the correct key points and assess what phase the current trend is in. The design of the pattern must be constantly monitored and adjusted as the price moves.
Reasons for pattern formation
The Converging Wedge Forex is considered a reversal figure of technical analysis, but for successful transactions it must be recognized in time. To do this, it is necessary to monitor trading volumes during the formation of a pattern in which the dynamics of volumes resemble the Pennant pattern. The reversal “character” is reflected in any version of the Forex Wedge pattern, it’s just that sometimes it doesn’t have enough “strength” to break the global trend and then a continuation pattern is developed. The main thing when forming a Wedge is the presence of active market manipulations - knocking down stops of small participants and gaining positions by large players.
After small Stop Loss/Take Profit orders accumulate on both sides of the range, they are regularly knocked down by speculators (max/min is updated), but shallowly, so as not to affect large interest, and the price immediately returns to the range of the Wedge Forex model. As orders from large players accumulate, the “depth” of the price drop (amplitude) decreases—the market is preparing for a reversal. Depending on the volume of positions accumulated against the trend, there will be either a change in trend (reversal wedge) or a technical correction (continuation wedge).