olegas Nov 24, 2021 / 159 Views
The name of this figure is probably known to every trader. The “Triangle” is one of the basic figures of classical technical market analysis. Let's once again take a closer look at this pattern in terms of the reasons for its occurrence, analysis of its strength (true or false), and also talk about a trading strategy based on the “Triangle” pattern.
First, let's look at the internal classification of triangles. Yes, yes, this figure is not as simple as it seems, and has three subtypes:
- Symmetrical triangle
- Ascending Triangle
- Descending triangle
What is a triangle shape?
The triangle figure is a pattern formed on the price chart. It is usually identified when the tops and bottoms of the price move towards each other, like the sides of a triangle. When the upper and lower levels of the triangle interact with price, traders anticipate a possible breakout. Thus, many breakout traders use triangle formations to find entry points.
You can see different types of triangles in the graphs. We can highlight:
- Ascending and descending triangle.
- Rising and falling wedge.
- Symmetrical triangle.
- Bullish and bearish wedge.
- Expanding triangle.
Before you move on to triangle trading, you must understand the differences between the existing formations. Next, we will take a closer look at the different types of triangles and their corresponding trading settings. Once you have this knowledge, you can add the triangle pattern trading strategy to your trading arsenal.
Indicator for finding the triangle pattern on charts
There is no specialized tool for identifying triangles in the MetaTrader 4 trading terminal.
However, you can download a universal indicator - PricePatterns (archived), which finds several classic technical analysis patterns.
Visual markings are applied directly to the chart of a financial instrument.
The PricePatterns indicator finds the following patterns:
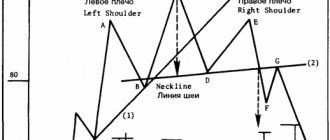
- "head and shoulders";
- inverted head and shoulders;
- double top (bottom);
- triple top (bottom);
- Forex triangle;
- flag;
- wedge.
The indicator does not identify the type of triangle. Marking a model using PricePatterns is only the first part of the job. The indicator does not give clear signals for entering a position. It is the trader's job to interpret and use the pattern for trading.
Ascending and descending triangle
These types of triangles have a flat horizontal side and one slanted side that moves towards the flat horizontal side. The ascending and descending triangle patterns are mirror images of each other. They are defined as ascending or descending depending on which side is flat and which is sloped.
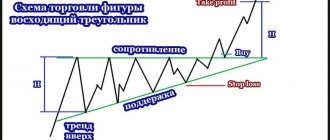
An ascending triangle has a flat top side and a slanted bottom side. Thus, the vertices of this triangle are at the same level, and the bases are pulled towards the vertex. This type of triangle is bullish in nature. When you see this triangle on the chart, you should be ready to catch a bullish price move. Thus, breakouts through the upper level are used for long positions.
As you can see, this ascending triangle has a series of higher lows that are being pulled towards the resistance line. This indicates the power of buyers for three reasons:
- Buyers are willing to buy at higher prices.
- There is no selling pressure.
- Buy stop orders are collected above the resistance level.
If buyers don't buy at higher prices, you won't see higher lows pulling up to the resistance line. The fact that the market can make a series of higher lows suggests that demand exists even as the price rises.
If sellers had taken control of the situation, the price would not have remained near the resistance level for such a long time. Instead, there would be a strong price rebound from the level. If the price continues to remain near resistance, it means there are no sellers in the market.
As the price approaches the resistance level, new traders appear and begin to open short positions from the level. But what happens if the market breaks the level? Their stop orders will be triggered and this will further push the price to move higher after the breakout.
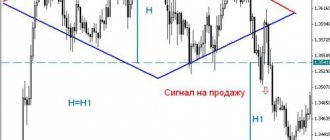
Consider a descending triangle, which is a mirror image of an ascending one. The flat side of a descending triangle is below the price action. The top side of the triangle is slanted down. In a bear market, a descending triangle has bearish potential.
This is a bearish pattern that shows that sellers are in control.
Typically, when the price falls lower, demand increases, which pushes the price higher. But this does not apply to a descending triangle. Because when the price goes lower, there is no buying pressure. Instead, sellers are willing to sell at even lower prices (which is why we get a series of lower highs).
Also below the support level are grouped stop orders of many traders who buy from the support level. The more traders do this, the more stops are formed. And as the market moves from one area of liquidity to another, price will likely break through support, and when those stops are triggered, it will further increase selling pressure.
In classical technical analysis, we often hear a recommendation to open short positions at a resistance level. However, having studied the triangle pattern, we now understand that it is very important to pay attention to how the price approaches the level.
Looking at the chart, we see that it would be better to refrain from opening short positions here. Higher price lows that are pulled up to the level signify the strength of buyers. In this situation, the market will most likely break out the level and move on.
Also, the more often the price tests the level, the higher the probability of a breakout. Each test attracts a new number of sellers and increases the number of stop orders above the resistance level. If the breakout does happen, all those stop losses will be triggered, giving the price even more momentum.
A factor that enhances the breakdown of the level is also low price volatility:
How to enter the market when trading the triangle pattern?
There are three techniques for opening a position:
- Stop order at the level.
- Assignment to level.
- Triangle trend line retest.
We can place a stop order at the level and immediately open a long trade if the resistance level is broken.
The advantage of this method is that we get a better entry price. However, a false breakout can always happen.
In the next technique, we open a deal only after the level is broken out and the price is fixed behind it.
Here we reduce the chances of getting a false breakout. On the other hand, if the price breaks the level with a large candle, we may not get the best entry point.
We can enter on a retest of the triangle trend line.
Here we get the best risk to reward ratio. However, you need to remember that any figure in technical analysis does not always work out 100%, so a breakout may not take place.
How to enter the market if you missed the breakout?
If this happens, the last thing you should do is chase the market, because at that point the market could bounce back sharply.
Instead, it is better to wait for retesting. Wait for the price to retest the breakout point. You can also wait for a confirmatory price action pattern to appear in the direction of the breakout.
If the market does not retest the boundaries of the triangle, you can wait for the first pullback and open a position on its breakout.
The pullback should be shallow with small range candles. On a small pullback, your stop loss will be tighter, giving you a more favorable risk-to-reward ratio.
You can place a sell order below the retracement low and go short when the price breaks it. Stop loss can be placed 1 ATR above the swing high.
How to set a stop loss so that it doesn't get kicked out?
Your stop loss should be in such a place that if the price reaches it, your trading setup will lose all meaning. This means that if your stop loss is hit, then you have chosen the wrong direction of the market.
Stop loss can be set at a distance of 1 ATR from the trend line of the triangle.
Point A is not a good place for a stop loss as the price is in an ascending triangle
Point B is the ideal place to set a stop loss because if the market reaches this point, you will know that the ascending triangle pattern has been broken.
How to take profit?
There are two methods of taking profits:
- Trailing stop.
- Graphic projection of price.
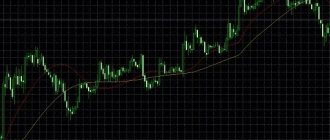
By using the trailing stop technique, you do not limit your profits and allow the price to rise as far as possible in your favor. To set a trailing stop, you can use a moving average indicator, such as a 20 or 50 period moving average. The position is held until the price falls below the moving average.
The MA period depends on the strength of the trend. For a long-term trend, you can also use a 200 period moving average.
In the graphical price projection technique, we measure the size of the base of the triangle and plot this value from the resistance level.
The disadvantage of this method is that the market may not reach the set take profit. Therefore, the best option would be to combine two techniques: trailing stop and graphic projection.
How to trade?
The trading strategy for the triangle pattern is simple - you need to wait for the price to break through the support or resistance level formed by the figure, and then open a trade as the price moves. With a descending type of pattern, you need to open a short position - for a decrease, and with an ascending one - a long position, for an increase. With a symmetrical pattern, you need to open a trade in the direction of the general movement of the trend, and if it is absent or weak in strength, it is better to ignore the pattern.
Read more: How to correctly perform a technical analysis of the Head and Shoulders pattern?
Figure 5 – Triangle trading strategy
Regardless of the type of triangle, it is not recommended to open trades inside it. Moving in waves, the price has approximately equal chances of going both up and down.
Many traders, having noticed the formed figure, place a pending order near the support or resistance level, but outside the triangle, which is activated when the price touches it. This strategy allows you to calmly analyze the situation and determine the minimum distance from the support or resistance level, which more or less guarantees that the breakout will not be false, and also decide on setting stop loss and take profit.
Rising and falling wedge
Ascending and descending wedges are similar to ascending and descending triangles. However, they do not have a flat side. Both sides of the wedges are inclined in the same direction.
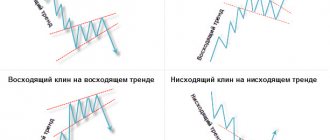
A rising wedge is a triangle pattern where both sides slope upward. Price creates higher tops and even higher bottoms. The rising wedge has a strong bearish character.
When you notice a break through the lower level of the rising wedge, you should expect a sharp price drop equal to the size of the pattern. Therefore, breakouts through the lower level of the wedge are used to open short positions.
Both sides of the falling wedge are sloping downwards. Price creates lower bottoms and lower tops. Thus, the two sides of the triangle are compressed into one point. In contrast to a rising wedge, a falling wedge is bullish. Therefore, the trigger for entering a trade is the top line. When the price breaks the upper level of the falling wedge, we can enter bullish positions.
Wedges can continue the current trend or have a reversal character. When a wedge appears after an extended price movement, we expect a trend reversal; when a wedge appears earlier in the trend, we expect it to be a temporary correction that will continue the main trend.
Typically, a more powerful wedge formation is a potential trend reversal formation that occurs after a prolonged move in the market.
Masterforex-V triangles: how are they formed and what is the strongest triangle penetration?
Any triangle is the intersection of the Sloping Channel (NC) MF and a strong horizontal level of resistance and support . When does the market give a strong signal?
I give only ONE triangle combination out of MANY from the closed forum of the Masterforex-V Academy.
Fig.20. Masterforex-V triangles: how they are formed and what they mean
Is the answer clear? The higher the wave level of the impulse (trend), the stronger this wave will be , breaking through the descending triangle in a bearish trend.
Triangles Masterforex-V: what is the weakest signal when a triangle is broken?
The weakest signal when the triangle is broken is the wave of the lower time frame (TF) - m30 - n1. From the point of view of wave analysis, this could be the 5th subwave of the current trend, followed by a powerful upward reversal
Fig.21. Triangles Masterforex-V: what is the weakest signal when a triangle is broken?
Thus, when the triangle is broken, a “weak signal” turns into a strong signal in the opposite direction. This is the absolute opposite position of Masterforex-V to what Alexander Elder, Eric Nayman, D. Murphy wrote about breaking through the descending and ascending triangles.
Symmetrical triangle
A symmetrical triangle is a situation on the chart when the tops of the price are lower and the bottoms are higher. In addition, the two sides of the triangle are inclined at the same angle.
Typically with a symmetrical triangular pattern, the expected direction of breakdown is unknown. The reason for this is that bullish and bearish price movements have equal strength.
When a breakout eventually occurs, it can trigger a price move equal to the size of the pattern. Therefore, you must carefully identify a potential breakout at the upper and lower levels of the symmetrical triangle in order to take the right position in the market.
Have you ever traded a symmetrical triangle? If yes, then you know that it is not as easy as it seems.
For example, you might have thoughts like this:
- Should I trade a symmetrical triangle for a breakout or wait for a pullback?
- Where is the best place to place a stop loss so that it is not accidentally hit by the price?
- In what direction will the price move after the formation of a symmetrical triangle pattern?
How to trade a symmetrical triangle?
The appearance of a symmetrical triangle on the chart means that volatility in the market has been decreasing for a certain period of time, so a surge in volatility is bound to happen soon.
How to find a symmetrical triangle?
- The two sides of the triangle are symmetrical.
- A triangle has falling highs and rising lows.
- It looks like a funnel when the price is compressed on both sides.
The price cannot shrink indefinitely. Sooner or later it will break out of the triangle. When this happens, we will have a point to enter the market.
Here is an example of a symmetrical triangle:
A symmetrical triangle forms on the chart over a long period of time. When you trade daily charts, a symmetrical triangle can take several months to form. If you notice the appearance of a triangle after a few weeks or days, then it is most likely not a symmetrical triangle, but perhaps another trend continuation figure, for example, a flag.
Don't Make a Big Mistake When Trading the Symmetrical Triangle Pattern
The main mistake traders make when trading a symmetrical triangle is trying to catch up with the price after a breakout.
When the buying pressure ends, the price cannot move further. The smart money has already made its profits and is starting to close out its trades. And bearish traders open short positions. As a result, the direction of the market is changing.
Traders who entered their trades at the highs suffer losses and soon close their trades with stop losses, causing the price to fall even further.
Is there a better way to enter the market when trading a symmetrical triangle?
How to correctly enter the market when trading a symmetrical triangle pattern?
You've probably heard these words many times before:
The trend is your friend, trade with the trend.
To trade with the trend, we can use moving averages. If the price is above the 200 MA, the long-term trend is upward. If the price is below the 200 MA, the long-term trend is downward.
By using this simple rule, you will be on the right side of the market more often than the wrong side and improve the number of your winning trades.
When trading a symmetrical triangle, we can use two methods of entering the market:
- On the first pullback.
- On retest.
First rollback
Often, after breaking through the borders of the triangle, the price rapidly jumps ahead.
If we enter a trade now, our stop loss will be too high and the risk to reward ratio will not be in our favor.
Therefore, we can wait until there is a pullback. And, for example, a bullish flag is formed. Then we will have the best entry point and the most optimal risk-to-reward ratio.
Retest
Often, after breaking through a symmetrical triangle, the price may return back to test its boundaries. In this case, we can see a pin bar or engulfing pattern. The appearance of these patterns gives us a suitable point to enter the market.
How to take maximum profit by trading the symmetrical triangle pattern?
We can use two techniques to increase our profit potential:
- Trailing stop.
- Graphic projection of price.
Trailing stop
No one knows for sure how high or low the market may move. Using the trailing stop technique, we can move our stop loss, taking maximum profit.
For example, we can use the 50 MA to reset the stop loss. If the price closes below 50 MA, exit the trade.
You can also use the 20 MA for short-term trends and the 200 MA for long-term ones.
Graphic price projection
This technique is based on a visual assessment of price movement on the chart. We need:
- Measure the distance between the maximum and minimum of the widest part of the symmetrical triangle.
- Then set aside this distance from the breakdown level.
- Exit the trade when the price reaches the visual projection line.
Symmetrical triangle: trading strategy
Now let's use all the information to create a trading strategy algorithm.
- If the price forms a symmetrical triangle, we expect a breakdown of the borders of the triangle.
- If the price breaks out, we wait for its rollback. Or we wait for a retest at the cost of the borders of the triangle.
- If the price makes a rollback, we enter the breakout of the highs (or lows). In the event of a rollback to the borders of the triangle, we expect the appearance of a graphical pattern in the form of a pin bar or an engulfing pattern.
- Set a stop loss at a distance of 1 ATR.
- If the price moves in our favor, we use the trailing stop technique at 50 MA.
Here are some trading examples.
Alexander Elder on “triangles”
In Alexander Elder we find six important additions to John J. Murphy's postulates about these figures of technical analysis. In particular, A. Elder:
- Classified models by size.
In his opinion, a small “triangle” with a height of 10 to 15% of the previous trend usually becomes a continuation figure of the existing trend. In many cases, trends are broken down into pieces by such models. Large “triangles” with a height of a third of the movement along the trend, as a rule, lead to a reversal in the opposite direction. Finally, some patterns of this kind lead trading to a flat state. - I divided the “triangles” according to their angle of inclination. There are three large groups here:
- Symmetrical, in which the top and bottom lines are inclined to the horizontal at the same angle (if measured from different sides). Such patterns reflect the equality of “bulls” and “bears”. They can become both continuation figures, which is more likely, and trend reversals.
- Ascending - with a relatively flat upper border and an upward-directed lower technical line. In this case, the bulls remain strong while the bears weaken, demonstrating an inability to push the price lower with each wave within the pattern. Most likely, this figure will lead to an upward price breakout.
- Descenders are the exact opposite of ascenders.
- Identified the breakthrough area.
A. Elder states that true breakthroughs usually occur in the first 2/3 of the triangle's length. Sometimes prices return back to the pattern, but these pullbacks only serve as excellent entry points for trading towards a breakout that has already occurred.In addition, A. Elder advises monitoring the volume, which drops as the “triangle” ages. A true breakout is confirmed by a volume increase of at least 50% from the average over the last 5 days.
- Identified the area of a possible false breakout.
A. Elder does not advise “playing” on breakthroughs in the last third of the “triangle”. He's writing:“If prices stagnate all the way to the crossover point, they will probably remain constant. The triangle resembles a fight between two tired boxers starting to lean on each other. An early breakthrough shows that one of the fighters is stronger. If prices remain within the triangle until the end, both fighters are exhausted and a new trend is unlikely to form.”
- I established the relationship between the “triangles” of your working currency pairs and the “tips” of your allies.
“Charts of adjacent markets often show triangles at the same time. If gold, platinum and silver showed a triangle at the same time and gold broke out, then it is likely that platinum and silver will follow. This approach works well with currencies, especially closely related ones such as the German mark and the Swiss franc. It also works with stocks of the same group, compare General Motors with Ford, but not with IBM."
- says A. Elder.
- He proposed a method for calculating goals for exiting the “triangle”.
Rice. 6. Tilt of “triangles” according to A. Elder
We are talking about the minimum distance that the price must travel after a breakout. It is necessary to measure the height of the “triangle” from the base and set it vertically at the breakout point. If you have a small "triangle" in the middle of a strong trend, most likely this indicator will be significantly exceeded.
Bullish and bearish pennant
Pennants on the chart have a shape similar to that of symmetrical triangles. They usually appear during trends and have the nature of trend continuation.
A bullish pennant is similar to a symmetrical triangle in appearance, but it occurs after an increase in price. Since pennants have a trend continuation nature, a bullish pennant will most likely continue the current bullish trend on the chart. When the top side of the pennant breaks upward, we are likely to see a price move equal to at least the size of the pennant.
When trading pennants, you can use a second profit-taking objective to make larger profits. When calculating the second goal, you must analyze the price movement. You can set the target to 1:1 of the previous stage or 0.618. When the trend appears strong and has a steep slope, a 1:1 move would be an appropriate second target, and in all other cases 0.618 can be used.
A bearish pennant is the mirror image of a bullish pennant. Bearish pennants begin with a decline in price and end with the symmetrical appearance of a triangle. Since pennants tend to continue a trend, bearish pennants will continue the bearish trend.
When price moves through the lower level of a bearish pennant, you should first try to capture the first target, which is equal to the size of the pennant itself. When the price reaches this target, you can try to catch a further decline that is equal to the size of the previous stage or 0.618.
Case Study
Pay attention to the chart of the price movement of the Australian dollar-US dollar pair. It can be seen that the bearish pattern lasted for 3 months. The support level has been formed at least 2 times, and the downtrend and its band have also been formed at least 2 times, and a gradual decline is observed. To determine the target, you need to measure the most prominent part of the pattern, then move the height down from the point of breakdown of the support below.
Expanding Triangle
The expanding triangle is much less common than its brother, the symmetrical triangle. While it can be extremely profitable, it can also easily make losses if you are not careful enough.
The expanding triangle is similar to the flag pattern in that it also shows the weakness of buyers or sellers.
Unlike a symmetrical triangle, an expanding triangle is formed from left to right. Although this pattern is a consolidation, it is not a “healthy” consolidation. Instead, it signals that buyers or sellers are losing control and the market will soon see a reversal.
Please note that we have support and resistance levels, as well as price movement that forms a consolidation. At the end of the figure, the two levels are further apart than at the very beginning.
These characteristics will be the same whether the expanding triangle is forming in a downtrend or an uptrend. I have noticed that the expanding triangle appears much more often at the top of the market than at the bottom. Therefore, in this lesson we will refer to this pattern as a bearish reversal pattern. However, remember that sometimes it can also signify a bullish reversal if it occurs in a downtrend.
In the chart above we see an expanding triangle that has formed at the top of the range. Soon after the support level is broken, the price drops by 100 points.
Expanding and symmetrical triangles
Whenever we talk about the triangle shape, it is important to distinguish between a symmetrical and an expanding triangle.
An expanding triangle is a reversal pattern that occurs after a prolonged market movement up or down, when the price gradually expands from the starting point:
A symmetrical triangle is a trend continuation pattern that forms after a prolonged market movement up or down, when the price gradually contracts before breaking out:
What these patterns have in common is that they both represent consolidation after an extended bullish or bearish trend.
Trading strategy and stop loss
The expanding triangle trading strategy requires patience because this pattern is quite rare. On average, you will only find one expanding triangle each month, provided you trade daily charts.
You will also need even more patience to make sure that this figure is finally formed and there is a good entry point. You need to wait for a confirmed breakout. There is a big difference between a price that temporarily falls above or below a level and a price that breaks the level. We need to see the candle close above or below the key level.
If you want to get an even more reliable entry point, you should wait for a retest of the broken level. But in this case, the price can continue to move towards the breakout without a retest.
Notice how the last low is repeated. Thanks to it, we can get a more optimal risk-to-reward ratio.
The second entry method is more aggressive and offers a lower risk-to-reward ratio.
Here we enter a short position after a confirmed breakout.
What is the best market entry method to use? It depends on you and your trading style. Each of these methods has its own advantages and disadvantages. As I always say, the best approach is the approach that works for you.
Setting take profit
There are two methods for determining profit taking targets when trading an expanding triangle.
- Use horizontal support and resistance levels.
- Use a graphical price projection.
Please note that I took the height of the entire pattern and measured an equal distance from the breakout point.
Which take profit setting method is better? You can combine both methods. Measure the distance of the expanding triangle and if it matches the horizontal levels, this is where you can set your order for profit. If it does not match, select the nearest support or resistance level.
The key horizontal level was just a few pips above the chart target.
We must also remember about the favorable risk-to-reward ratio and not enter the market if this ratio is not in our favor.
The take profit is too close to the entry point to justify this position. And although the price continued to decline, we could not rely on this when deciding to enter the market.
Classic expansion patterns
An example of a classic expanding top is shown in Fig. 10-1.
Rice. 10-1. Classic flared top
It consists of three trends, where each maximum is higher than the previous one. The maximums are separated by two minimums, where the second is lower than the first. Such patterns often indicate the end of a market rally rather than a breakout higher. Although in some books you can find the opinion that such joy is formed at the end of bearish trends.
The classic flaring top is sometimes called a reverse triangle because... that's exactly what they are. In those rare cases when such a pattern comes across at the bottom of the market, they are sometimes called mouthpieces (or in our opinion, swearers, Binguru's note), since they are very similar to them.
In general, some patterns are simply ideal for trading, since by default they mark places where to place stops with low risks. A right triangle punched closer to the top is a good example.
But classical expanding vertices, alas, do not have this property. Such patterns are extremely difficult to detect before the final top is formed. In addition, there is no obvious support line, the breakdown of which would serve as a convenient tool for us. The violent, emotional reactions of price and volume reflect the chaos in traders' heads and make such patterns difficult to work with.
Of course, in such conditions it is not easy to determine a breakout, but if the pattern is more or less symmetrical, there are options. This is a decisive move below the downtrend line that connects both lows, or even a move below the second low, which will serve as a warning of a future decline.
Targets are also difficult to determine, however, the volatile price reaction during the expansion indicates that the distribution phase is almost complete. Successful completion of such a pattern is usually accompanied by a proportional drop in price.
The problem here is that the breakout point in such a pattern often forms too late, when the previous movement has long been completed. Therefore, if you have an open position for market growth (long), you say to yourself: “Hey, well, I can’t sell here, damn it, it’s fallen too much; I’ll wait for the rebound.” This is a bad strategy because the completion of such a pattern is usually just the icing on the cake.
In reality, classic expanding tops usually occur after a very long, strong uptrend, when prices have moved very far from the previous low in a bearish trend. Accordingly, the market will be full of sellers who will want to go to cash and lock in their profits. Additionally, the divergent nature of the pattern is highly volatile and adds further confusion.
And when prices are unstable, stock owners forget about their worries and begin to panic. All this is similar to the situation when you live in a crime-ridden area and constantly want to give someone soup (and the neighbors want you), in contrast to living in a respectable and calm area.
If we turn to two classic texts where such patterns are mentioned, namely, the books by Ewdards/Magee and HMHartley, we can learn something interesting. In their opinion, apart from the game that was happening in 1929, such a pattern, one might say, does not exist. Indeed, after studying almost 20 years of quotations in the Nasdaq 100 and S&P 500, I could not find any sane examples of its use or cases where there were normal risk/reward ratios.
Therefore, this particular pattern - the classic expanding top - can be said to have died out, and the lack of normal examples with it makes it completely impractical (Over the 15 years that have passed since the book was published, the markets have changed a lot. They went through the quantum algorithm revolution, through two crises in 2008/ 2020, cryptocurrency markets appeared, which strongly resemble the wild stock market of the late 19th century. All this revived the old patterns described in the classic books on TA. Therefore, they are now more relevant than ever before, Binguru’s note).
But a completely different matter is rectangular expanding patterns, which we will talk about later.
Triangle figure in trading
Now that we have discussed most of the important triangle patterns, let's see how you can use them in your trading.
The graph shows five examples of triangles and their potential results.
The chart starts with a large symmetrical triangle. The price creates three decreasing tops and three increasing bottoms on the chart. The arrow at the beginning of the triangle measures its size. As you can see, the same arrow is applied when the price breaks the upper level of the triangle and indicates a potential target of the pattern, which is fixed in a week.
Meanwhile, on the way to higher prices, a rising wedge chart is created. As we have already said, the rising wedge has bearish potential. When the lower level of the wedge is broken, we notice a slight correction.
At the end of a bullish trend, price creates another symmetrical triangle. Later, the price breaks the lower level and completes the size of the pattern.
When the price declines, a bearish pennant appears. This is consolidation after the first impulse of a bearish trend. Next, the price breaks through the lower level of the pennant. On the way down we see that the price completes the first target, which is equal to the size of the pennant.
Price then creates a double bottom reversal pattern and switches to a bullish direction. On the way up, price action creates an expanding triangle. Notice that the top and bottom levels of the pattern are increasing. In this case, the expected price movement is bearish and should be equal to the size of the pattern.
Subscribe now:
Telegram
So, having a license as a qualified psychologist, I can say with certainty that there is a cognitive distortion here. Influencing us with false perception, passing off “desired” as “real” - apophenia. It is because of this that the true nature of market movements is an illusion for us. My practice shows that we only see previously worked out situations. Whereas unprocessed, our brain filters, ignores and does not take into account. This is the insidiousness of triangles, which are often influenced by subjective perception.
How can you improve your results in triangle trading?
The first and most important thing is the time frames you will use. Stay away from low time frames and intraday noise that can result from minor news events and random price fluctuations. Also, on higher timeframes, false breakouts are much more rare.
You will have much more time to make trading decisions. You will worry less and will be able to calmly find the optimal entry point and decide on your profit goals.
Make fewer deals. If you trade on daily time frames and make more than ten trades per month, there is a 90% chance that you are trading too often. In other words, you choose quantity over quality. When it comes to the best entry points, there will never be many of them. In my experience, this number ranges from three to four to perhaps ten during an active month.
Before adding the triangle to your trading arsenal, you will have to be patient. Don't expect this figure to appear every week or even every month. However, with the right risk-to-reward ratio, the potential return can meet all your expectations.
Constantly track your results, both good and bad. Tracking your mistakes is much more important than your successes. Although it can be tedious and even boring at times, keeping a trading journal is a crucial step in becoming a profitable trader.
Read more:
Chapter 17. Expanding triangle - unresolved problems of the classics of Forex technical analysis>>
Chapter 18. A trader’s work on the news: mistakes and unsolved mysteries of classical analysis>>
Book 1. Secrets of mastery from a professional trader (or what Bill Williams, Alexander Elder, Erik Naiman and others did not tell traders about Forex) >>
Book 2. Points of opening and closing transactions on the Forex market / Forex (basic rate)
>>
Get professional training in Forex and stock trading >>
Useful tips for trading
To successfully trade using a triangle, a trader should follow a number of rules common to all its varieties:
- there is no need to trade on a timeframe below H1 - the profit when trading on lower timeframes will be small, and the number of false signals will increase noticeably;
- there is no need to rush to open a deal immediately after breaking through the line; it is better to wait until the candle closes outside it, fixing the price, and only then open an order;
- When the line is broken through and immediately before it, the market trading volume must increase, otherwise the breakout will be false.
- It is better to refrain from opening a position immediately after the breakout, but wait for the price to roll back into the boundaries of the figure and restart it - the likelihood of concluding a profitable transaction increases several times;
- do not open positions if the pattern formed immediately before the release of important economic or political news - the price movement after their release cannot be predicted by means of technical analysis;
- trading should be carried out only in compliance with all risk management rules.
The triangle is one of the easiest graphic shapes to visualize. Trading with it does not require the use of complex technical indicators or trading strategies, so even beginners can easily master it. Like any trading strategy, triangle trading cannot be 100% successful. There will also be unprofitable trades, but with strict adherence to the listed rules, most open orders are closed “in profit”, providing the trader with a good profit.
Authenticity criteria
1. Triangles are graphic patterns that indicate a continuation or reversal of the current market trend. That is, the first criterion is a trend. If there is no upward or downward price trend in the market, then interpreting the situation as a triangle is incorrect. It makes no sense to look for the patterns in question in sideways or flats.
2. Within the boundaries of the triangle, the movement of quotes is limited by two lines. Depending on the type of pattern, support and resistance can be horizontal or inclined.
3. The construction of a triangle implies the presence of at least three extrema. Further points of price highs and lows confirm or correct the boundaries of the figure.
4. The presence of characteristic fading volumes of trading in an investment instrument for tapering triangles. In such situations, a pattern is observed: a decrease in the number of transactions concluded leads to a decrease in volatility. However, when the upper or lower line is broken and the pattern is exited, a sharp increase in passing volumes is observed.