Good afternoon, dear Forex traders!
In this review, I want to introduce you to the VWAP indicator, which is used by large market participants in their trading. Yes, you read that right. It is indeed used by large market participants instead of the obsolete Moving Average and its derivatives: VWAP underlies many corporate intraday and intraweek trading strategies. Read on to learn the secrets of using the VWAP indicator in Forex.
VWAP - advanced VSA analysis indicator
Indicator characteristics
Platform : MetaTrader 4/5 Currency pairs : EURUSD, GBPUSD, AUDUSD, USDCHF, USDJPY, USDCAD, NZDUSD, USDMXN, USDRUB. Indices, commodities, metals are also available. Timeframe : M1-H4 Trading time : GMT+2 01:00:00-23:59:59:59. Also, the indicator does not work during the weekend at the Chicago Mercantile Exchange Recommended brokers : Alpari, RoboForex, Amarkets
What is VWAP
The VWAP (Volume Weighted Average Price) indicator is the weighted average volume price.
The formula for calculating it is quite simple:
The formula shows that VWAP is the sum of the products of volume and price for the time period under consideration, divided by the total quantity of volume for the time period under consideration.
At first glance, VWAP looks like a regular Moving Average. But it has several extremely important differences.
The first difference is the calculation base. In the case of VWAP calculation, the base is not only and not so much the price, but the volume traded on the GLOBEX exchange in price and time. This means the indicator is more responsive to changes in the market. Especially if they are not visible on a regular price chart. This is why professional VWAP is paid, because you need to configure the paid GLOBEX exchange gateway in the MT4/5 terminal; free versions of this indicator use tick volumes of a specific broker, which not only differ between different DCs, but also have little to do with what is happening on the futures exchange. And this reduces the predictive value of the indicator, although even in this case, if interpreted correctly, it will work better than moving averages.
The second difference is the calculation feature of the VWAP indicator. It has a beginning and an end, whereas the Moving Average, by and large, has no beginning or end. The VWAP indicator is calculated from the beginning of a specified period (for example, hour, day, week) to the end point in cumulative mode. The data is not averaged. Those. An important feature of the indicator is the choice of calculation period (timeframe). The weekly VWAP is built from Monday to Friday. Daytime VWAP – from 01:00 to 23:59 daily terminal time. Why not from 00:00, you ask? Because the indicator takes data from the exchange, and there is a break on the exchange from 16:00 to 16:59 Chicago time (00:00-00:59 UTC+2).
Let me clarify that most brokers have UTC+2 time; if your broker offers a different time, then in the indicator settings you can set the correct time. Thus, despite the timeframe, in the working window (even M1) - your VWAP will remain the same as you set it: weekly, daily or hourly. The figure below shows M15 and M1 CL oil chart. The VWAP indicator is selected based on the CME (Chicago Mercantile Exchange) session. It is at this time that the main volumes on the exchange for this mark occur, which means that the session VWAP is working on this instrument.
Personally, I use monthly, weekly and daily VWAP on EURUSD. On GBPUSD I add hourly, and on oil I add sessional (CME) and hourly, because These instruments are characterized by high volatility.
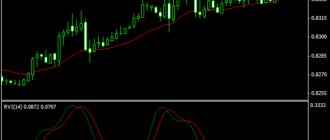
The third difference is the ability to build VWAP series. In fact, the ability to build series is a consequence of the fact that the indicator is built according to the time frame: hourly, sessional, daily, weekly. The example below shows a EURUSD chart of 2 series of daily VWAP. The VWAP series allows you to find the best opportunities to enter the market, because... There are already guidelines not only for current, but also past activity.
It is clearly visible that the previous average VWAP acted as support at the very beginning of the day. At this time, the current daily VWAP had not yet been revealed, and the price was at -6 deviation. It was the support of the average of the previous day that made it possible to buy more confidently in this place, although the quote was in the sell zone within this day.
The fourth difference is the ability to use end-to-end analysis to find the best entry point. End-to-end analysis is the analysis of quotes from the upper timeframe to the lower one and vice versa. Naturally, indicators need to be analyzed in the same way. The VWAP indicator provides the best opportunity for this. For example, on CL oil I use a series of 2-3 week VWAP, 3-5 day VWAP, and 3-5 session VWAP. In some cases, I switch to a series of 3-5 hour VWAPs. This allows you to navigate the market not only here and now, but also to understand its general mood.
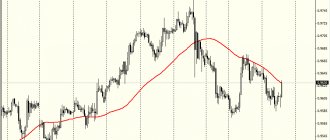
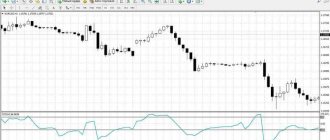
The chart below shows the AUDUSD pair and three VWAP charts: the New York session series, the daily series and the weekly series. It is clearly visible that the quote has broken through the average weekly VWAP, i.e. moved into the sell zone. It struck with an impulse, although before that it was leaning on it. The daily VWAP shows that price has been moving between +2 and -2 VWAP deviations all day. The NYSE VWAP shows that it was the Americans who knocked down the currency. The sum of these facts suggests that we should expect a continuation of the downward trend.
Why is VWAP so popular among traders?
VWAP or weighted average price is one of the most popular indicators and probably the most important one used by traders abroad. The indicator is as old as the world, its main advantage over conventional moving averages is that it is calculated based on real volume in the stock markets. Therefore, unless you trade stocks, such as Forex or other decentralized markets, VWAP will be useless.
VWAP = (∑Shares purchased * share price) / (total number of shares purchased on a particular day)
VWAP is recalculated with each subsequent transaction and only counts transactions during the session.
Simply put, VWAP is an indicator that shows whether buyers or sellers are dominant in the market. If the price is trading above the VWAP value, it means that buyers are currently in control of the price. And vice versa - when the price falls lower, it means that supply is gaining control, and it is advisable to open shorts.
Beginner traders can easily learn VWAP trading as this indicator is used by many traders. When price tries to break the VWAP, you can safely assume that other traders who are watching this chart will be playing the same game as you.
What strategies are there using the VWAP indicator?
Trading Breakouts
When the price rises above the VWAP indicator, it means that the bulls dominate the market. They are so strong that the price managed to break through its average value on the chart. Therefore, we receive a buy signal. The same applies to a bearish breakout, but in the opposite direction.
Determining support and resistance levels
The volume weighted average price line can be used as support or resistance. Since the indicator averages the total number of periods per day, it has psychological significance on the chart. If the price approaches the VWAP line from below and begins to fluctuate in the area, then the VWAP can be considered as resistance. If this happens in the opposite direction, then the indicator may support the price, creating a bullish rebound. Below you will see an example of VWAP as an effective support:
VWAP - to determine the place for stop loss
The VWAP indicator also works well as a stop loss zone - often when the price approaches the indicator value, a larger order pool and stronger capital will appear, which eliminates the threat. An example from Netflix (NFLX) from July 18, where the moment of breaking through the VWAP level and the stop loss zone, which was defended several times, was noted.
VWAP is a great technical indicator because it takes into account both price and volume. Unlike moving averages, VWAP gives more weight to price points with high volume. This allows you to understand price points of interest, measure relative strength and identify key entries/exits.
How to determine a trend change using VWAP
When the trend changes, it is quite easy to make a mistake with the direction. The explanation for this is simple. All previous distributions of VWAP series (and any other indicator) show a certain direction. At the initial stage of a trend change, there is always a desire to open a position along the previous trend. How to determine potential breakdown? One fairly reliable way is as follows. If there is a breakdown of the current average daily VWAP, and then the weekly average, then work on the trend should be canceled, even if the market begins its usual movement. In the near future, the market will either reverse or enter a balance phase, i.e. outset. And these are completely different risks and strategies.
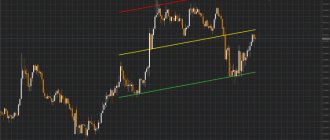
A very important point for a potential trend change: a constant breakout of several average daily VWAPs against the main movement during the week. Here is the EURUSD chart. For two days there is a deep breakdown of the average daily VWAP, although the price, in general, is rising. On the third day, the growth attempt ends in a price collapse. Moreover, the collapse was from +6 VWAP deviation and -6 VWAP deviation below the levels of the previous day. This puts a big question mark on the future of the upward trend.
Trade
The first value specified when calculating the VWAP indicator on the daily timeframe is the price at the beginning of the trading day. At first, the indicator will closely monitor the situation on the market, but towards the end of the day its accuracy decreases.
How to spot a trend change
Plotting the previous series of the indicator and the line of the higher timeframe allows you to see the tendency to change the trend. For example, if you work in a daily series database, then it is convenient to select a weekly series as an additional one.
If the daily VWAP is above the weekly VWAP and the price chart is above the daily line, this may indicate an uptrend. A sharp drop through the daily average and then the weekly average indicates a change in trend and is the basis for closing long positions and opening short ones.
Another signal about the end of a trade is multiple breakdowns of the middle line in series close to the current one. These intersections indicate a decrease in traders' interest in the current trend.
How professional traders use VWAP
Professional traders view the indicator line as a reflection of the balance on the trading platform. Each deviation of the price chart from this line tells them that it is time to make transactions at more favorable prices.
The lower the price chart moves away from the volume-weighted average line, the more active the purchase. If the price goes above the VWAP indicator, then this is a signal to sell the asset.
How Retail Traders Use VWAP
Retail traders study the indicator for support/resistance dynamics.
When following a trend strategy, it is necessary to construct a series of the current, previous and higher timeframes, and then analyze their relative position: the current one below the previous and older one indicates a downward trend, the reverse - an uptrend.
Traders using a reversal strategy trade against the current trend or when it crosses in the opposite direction of the dominant movement. Entry points are considered to be places on the chart where the price deviates as much as possible from the current average.
Additional examples of working with VWAP
The figure below shows the EURUSD chart with the weekly VWAP loaded.
- Entering sales (return strategy). The price came to the +6 deviation zone on Tuesday. As you can see, this same location was +6 VWAP deviation in the previous week, i.e. the upper limit of the flat. It would be possible to exit at the average VWAP if the price stayed there. And so almost immediately it went towards the -4 and -6 deviations of VWAP, where it was necessary to exit the market. Stop for the previous week's high;
- Entering purchases (return strategy). The pair stands at -4 VWAP deviation until Thursday. This is also a -2 deviation of the previous week's VWAP. Stop below the local minimum. Profit in the area of the average or +4/+6 deviation of VWAP;
- Entering purchases (trend strategy). The currency pair has been at the average weekly VWAP for half of Friday after a rollback from the +6 deviation of VWAP. The reluctance to go lower indicates the continuation of upward dynamics. Output at +6 deviation;
- Entering sales (trend strategy). The market opened on a buy on Monday, but sharply reverses sentiment and moves below the new VWAP, indicating selling potential. In this case, a return to the average occurs during the American session, which allows you to enter an ideal trade;
- Entering purchases (return strategy). The market closes Monday around last week's average VWAP. The purchase is dangerous, but we should expect a return to the average VWAP of the current period, because very little volume was collected. This is what happens;
- Entering sales (trend strategy). Selling from average weekly VWAP on Tuesday. Output at -6 deviation, because in the future there is a high probability of another return towards the average.
The following image shows a chart of EURUSD with daily VWAP loaded. The situations are the same as above, but taking into account intraday dynamics.
- Entering purchases (trend strategy, No. 3 in the previous example). On Thursday the market went into buy impulse. After this, consolidation occurs on Friday around Thursday's average VWAP. At the same time, the pair moves within the VWAP boundaries until significant market news is released. The price action and positioning was a clear indication of how the market would behave;
- Entering sales (trend strategy; No. 5 in the previous example). The upward dynamics on Monday are breaking down. At the retest of the average daily VWAP, which coincides with the +6 deviation of Friday, you can enter into sales. I think everyone has noticed that on a daily basis VWAP is a trend strategy, while on a weekly basis it is a return strategy. This is due to different timeframes, and therefore different positioning;
- Entering sales (trend strategy; No. 6 in the previous example). Actually similar explanation. Monday's average VWAP test is just happening. The previous upward trend is weak: it goes between the average VWAP and the +2 deviation of VWAP.
Before installing the indicator, I recommend going back to the beginning of the article and analyzing the last 6.5 weeks on the GBPUSD pair in the light of the knowledge gained.
POV
POV ( Percentage of Volume) algorithm As a result, it turns out that the POV algorithm breaks the overall position into small ones and implements them during the working session, making regular transactions. Thus, according to the POV algorithm, there is a constant percentage of the total position volume at each point in time. That is, at each moment of time, a part of the total volume is executed on the market.
The POV algorithm is calculated using complex formulas:
And in the end it turns out:
Where:
- V(t) – total trading volume at time t;
- t – time interval;
- Q(t) – the amount of an asset that still needs to be sold in a specific period of time;
- Q(t) – initial quantity of sold asset (first transaction).
- U – coefficient of participation in tenders;
- q min – the volume of an asset that is sold by an order in a specific time interval.
Disadvantages of the indicator
Most authors consider the disadvantages of the VWAP indicator to be a certain lag, which increases over time due to the accumulation of a large amount of data. Those. The indicator, closer to the end of the calculation period, becomes insensitive to new data. On the one hand, this is true.
But let's figure it out. The accumulated data allows you to see the real fair price for a given period. And finding a quote relative to this price shows the mood of market participants.
The most reliable transactions relative to the average are carried out in the first half of the period. But in the second half of the indicator period, return strategies work well.
Indicator settings
The indicator settings look like this:
The following description is taken from the developer's website with my comments (bold italics).
- Instrument (default value “AUTO”) – since many dealing centers (DCs) on the same instruments can use different futures names, this parameter allows you to specify the name of the futures from which data will be imported. If the value is “AUTO”, the server tries to recognize the required futures by analyzing the name of the instrument from the DC.
For example, some forex brokers offer trading in WTI , while most others offer trading in CL , i.e. the same ticker as on the stock exchange. If your broker has WTI , then in the indicator settings you need to set the ticker CL .
- Update_in_sec – indicator update time in seconds. Two modes are available: Every_1min (update once per minute) and Every_5min (update once every 5 minutes).
Minute update is preferable.
- MetaTrader_GMT – (default value “AUTO”) – since each DC personally configures the data server to correctly display data in the indicator, you must specify the time zone of the DC server. Unfortunately, there are no built-in methods for determining this parameter, so in AUTO mode the server compares the time of the last quote on the client.
You can read more about time settings here.
- VWAP_Period (default value “Daily”) – chart type described in the comment. Depending on the choice of type, various variables are or are not involved in the construction. Before describing the possible options for this parameter, it is worth noting that the indicator can build not one chart, but a series under the specified time parameters. The number of profiles is determined by the Amount_of_VWAP . Possible values for VWAP_Period : Custom_Period – custom mode, the VWAP chart will be built for the period specified in the parameters Custom_Start_time , Custom_End_time (does not really work);
- per_Hour – VWAP charts will be built for every hour;
- Daily – VWAP charts will be built per day. The beginning of the day (conditionally) is considered to be the beginning of trading after a technological break on the exchange;
- Weekly – VWAP charts will be built for a week from Monday from the beginning of the day until the end of trading on Friday;
- per_Asia – VWAP charts will be built for the Asian session (00:00 – 09:00 GMT+2);
- per_Europe – VWAP charts will be built for the European session (09:00 – 15:00 GMT+2);
- per_NYSE – VWAP charts will be built for the American session (15:00 – 24:00 GMT+2);
- per_CME – VWAP charts will be built for the American session of the Chicago Stock Exchange (16:30 – 23:30 GMT+2);
- per_Contract – VWAP charts will be built for the entire available contract (does not really work).
Between Forex quotes and stock exchange quotes there is a so-called forward, i.e. price difference. On the euro, it changes from 80-90 points (4 digits) at the time of the official start of trading in the new quarterly futures, to 2-3 points at the time of expiration. The indicator is configured in such a way as to take this feature into account, but sometimes you can observe its shift on the chart by exactly the Forex_Shift . To solve this problem, you need to update the chart or change the timeframe (instead of M5, put M15). The problem most often occurs when building VWAP .
- Forex_Shift – the number of points by which the chart will shift up or down if the Forex_auto_shift parameter is set to “false”. A variable can be either greater or less than zero. Designed to take into account forward points (the difference between the futures and spot prices);
- Custom_Period_Settings (default value “—Settings for Custom Period”) – this is a text comment and does not affect the operation of the indicator in any way;
- Get_Custom_Period_from_Chart (default value “true”) – with the VWAP_Period = Custom_Period parameter, the indicator will receive data for the Custom_Start_Time and Custom_End_Time fields directly from the vertical lines located on the chart (and available for free movement by the user);
- Custom_Start_time (default value “2017.01.01 00:00”) – if Custom_Start_Time and Custom_End_Time differ from the value “2017.01.01 00:00″ and Get_Custom_Period_from_Chart=”false” – the server will load the history of the period indicated by these parameters;
- Custom_End_time (default value “2017.01.01 00:00”) – see Custom_Start_Time;
- Deviation_Settings (default value “— Deviation_Channels”) is a text comment and does not affect the operation of the indicator in any way;
- numDev1 (default value “1”) – coefficient for constructing the first channel;
- numDev2 (default value “-1”) – coefficient for constructing the first channel;
- numDev3 (default value “2”) – coefficient for constructing the second channel;
- numDev4 (default value “-2”) – coefficient for constructing the second channel;
- numDev5 (default value “3”) – coefficient for constructing the third channel;
- numDev6 (default value “-3”) – coefficient for constructing the third channel.
Let me remind you that I prefer +-2, +-4, +-6 and +-8 deviations. Due to the fact that this indicator allows you to configure only 6 deviation values (three above the average and three below the average), I proceed as follows. The standard settings are +-2, +-4, +-6. If the price comes to +-6 VWAP , and there are no signs of a rebound, then I change any value to +-8 and get the next potential target. Also, for directional movement, I set +-1 deviation, because They may not approach the average, but this does not happen so often.
- Reverse Settings (default value “——— Reverse for USD/XXX symbols ———”) – this is a text comment and does not affect the operation of the indicator in any way;
- ReverseChart (default value “false”) – for reverse pairs the package (except USDJPY, USDCAD, USDCHF) must be set to “true” so that these indicators “reverse” and correspond to the chart of the pairs.
On futures exchanges, the dollar is always in the second position, i.e. 6 S (franc) futures are CHFUSD , not USDCHF. Therefore, to build correctly, you need to expand the indicator, which is what happens when you enable this setting.
- DO_NOT_SET_ReverseChart (default value “...for USDJPY, USDCAD, USDCHF -“) – this is a text comment, it does not affect the operation of the indicator in any way, the comment itself gives a hint that there is no need to set the ReverseChart parameter for pairs such as USDJPY, USDCAD, USDCHF, since the indicator itself recognizes them and will flip the data if necessary.
Usage
The VWAP indicator has found application in the development of strategies for medium- and long-term trading systems, high-frequency trading, and market situation research. It has proven to be an effective tool for constructing dynamic support/resistance lines and assessing trends.
How is it calculated
In order to calculate the volume-weighted average price indicator, you need to:
- determine the Typical Price at each point of the interval starting from the starting position and up to the current bar;
- multiply these price values with their corresponding volumes;
- sum the products - this is the numerator of the fraction;
- calculate the total trading volume in a given interval - this is the denominator of the fraction;
- find the ratio of the numerator to the denominator.
Major players determine the indicator based on tick data for the daily timeframe, but this is not necessary - it can be done for intervals from a minute to a month.
How to interpret
The deviation of the current price from the VWAP average line indicates the predominance of buying/selling trends. If the price chart is above this line, then buyers dominate; if below, sellers dominate.
There are 2 types of strategies for using the volume-weighted average price indicator - trend and counter-trend (or return). The first sets up the trader to make purchase operations when the price chart crosses the average line from bottom to top, and sell operations when it crosses the average line from top to bottom.
The return strategy involves the reverse logic of actions - buy if the price chart goes below the indicator line, and sell if it goes above. The trader himself decides which strategy to choose in each case, based on the market situation.
Settings
Instrument - contains the name of the future for which data is entered into the terminal. Unless otherwise specified, the value is set to AUTO.
VWAP period — time interval for which the indicator will be calculated.
Amount of VWAP - sets the number of lines in the series (by default, 1 line is built).
Forex Shift and Forex auto shift - determine the difference (in points) between the futures price and the spot market.
Update in sec—data update frequency (every minute or every 5 minutes).
Only On TimeFrame - sets the time intervals on which the VWAP line is built.
Deviation Settings - square deviations used to construct additional lines.
Where to download/find the VWAP indicator for MetaTrader 4/5?
The VWAP indicator is built-in in all exchange terminals that focus on working with volumes (NinjaTrader, VolFix, etc.).
As for MetaTrader, in order to use VWAP, you need to find and install it. Free and some paid versions of the VWAP indicator can be found at this link. The choice is huge, all you need to do is install and start using it.
Personally, I use the paid ClusterDelta indicator package, which includes the VWAP indicator.
The subscription price for all indicators ranges from 4.40 (Standard version, 9 indicators) to 7.50 (Premium version, 14 indicators) $ per month. The difference between the regular and premium versions is the speed of importing data from the exchange. Despite numerous shortcomings, this is the best package of stock indicators for MT4/5: they have a gateway configured to the CME servers. Hence some lags and so on, but it's worth it.
For VWAP and other indicators to work, you must be logged in to their server. There are three authorization methods:
- go to one of the sites https://clusterdelta.com, https://my.clusterdelta.com or https://forum.clusterdelta.com as a registered user;
- go to a special program: ClusterDelta Authorizer;
- go to the terminal of the ClusterDelta Online platform.
The indicator installation is normal. First you need to download the archive. After that, unpack the Indicators and Library folders into the MQL4 folder of your Metatrader 4 or copy the Indicators and Library folders into the MQL5 folder of your Metatrader 5.
To find the MQL4 folder, launch Metatrader 4 and select “File”->”Open Data Directory” and then enter the MQL4 folder. To find the MQL5 folder, launch Metatrader 5 and select “File”->”Open data directory”.
Once the indicator appears, be sure to allow DLL imports, otherwise nothing will work.
Detailed basic instructions:
- How to install an indicator in Metatrader 4;
- How to install an indicator in Metatrader 5.