olegas May 31, 2021 / 115 Views
The channel was named in honor of its creator Richard Donchian (this is how the surname of this outstanding American financier of Armenian origin is correctly read, with the ending “-yan”. Pronounced in the Italian manner, his surname most likely owes its English transcription – Donchian.
Donchian channel indicator on the price chart
Richard Donchian was born in 1905 in Hartford (Connecticut, USA). At the beginning of his career, he was involved in the family business of selling oriental carpets, but then, after reading Edwin Lefebvre’s book “Memoirs of a Stock Speculator,” he became seriously interested in stock trading.
While working as a stock analyst, Donchyan developed a whole set of rules for trading based on trend following (for which he was later called the father of trading “by trend following”). Based on these rules, a huge number of exchange trading systems were created, some of which are still relevant today. By the way, the well-known “Turtles” traded according to these same rules, but more on that below.
Donchian Formula Channel
The indicator simply takes the user-selected number of periods and calculates the upper and lower bands. It plots two lines on the chart in accordance with the Donchian channel formula. From this simple formula it follows that:
- The top line is the highest price for the last period n
- The bottom line is the lowest price for the last period n
MetaTrader 4 (MT4) has a default value of 20, but you can set it to whatever value you prefer. It also happens that some versions of the Donchian Channel indicator also build a third line.
This centerline is simply the average of the upper and lower values and is calculated using the following formula: (n-period high + n-period low) / 2.
Profitability
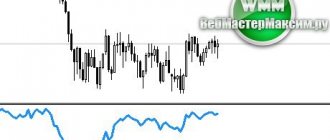
To calculate the approximate profitability of the indicator, a simple function for calculating trends was built into the program code. The function can be enabled in the indicator settings ( ! Show profitability statistics). This function works once and calculates the number of periods specified in the settings (Number of displayed periods). To calculate the efficiency, a level breakout strategy is used for calculations. If the price rises and breaks the upper level, the indicator calculates the trend until a reverse signal appears. For downward trends, the price decreases below the level, and the end of the trend is considered to be a reverse signal. The screenshot shows the profitability of the EURUSD currency pair. The indicator was launched on an hourly timeframe with a period of 28.
In the figure, the profitability on the growing trend was almost 6500 points, and on the downward trend it was 7500 points.
How the Donchian indicator works
The Donchian Channel indicator was invented by professional trader Richard Donchian, one of the pioneers of technical analysis. The Donchian channel plots two lines on the chart:
- One line - the highest maximum for a specified period
- The other line is the lowest minimum for the specified period
You as a trader should decide on a time frame, although the default period used in the classical Donchian system is 20 days.
Source: Admiral Donchian indicator - Admiral Markets plugin for MetaTrader Supreme Edition (MTSE)
Updates
Version 20.060 - 06/14/2020
Code optimization for the new terminal build
Update history - last 5 versions
Version 20.058 - 05/30/2020
Fixed color display
Version 20.057 - 05/27/2020
- Code optimization
- Error correction
Version 20.030 - 03.23.2020
Optimized:
- Program code.
Added:
- Ability to set the number of periods displayed - the fewer periods displayed, the faster the indicator works.
- Ability to receive signals for other programs through global variables.
- Ability to choose one of three methods of notifying traders: Push, Alert, E-mail.
Corrected:
- Duplicate price tags.
- Triggering notifications.
Version 19.010 - 01/18/2019
Corrected:
- Clearing the chart when removing the indicator
Hide update history
Installing the Donchian Channel Indicator on MT4
Although the Donchian indicator is a well-known indicator, it is not one of the standard indicators that comes with MetaTrader 4. If you want to use it on MT4, you will need to install the Supreme Edition extension for MT4.
The reason for this is that many of the Donchian channel indicators on the MT4 platform may not be as accurate, and some may slow down the platform. One of the key advantages of MetaTrader 4 is its accessible programming language.
MT4 includes a huge number of custom indicators. But this can also be a disadvantage, since it means that there may be more than one version of the Donchian channel indicator available, and they may not be encoded correctly.
If you want to improve your trading for free, why not download the dedicated MetaTrader Supreme Edition plugin? It includes a complete professionally encoded Donchian channel indicator.
Click on the banner below to download MetaTrader Supreme Edition for FREE!
What's in the archive
For MetaTrader 4
- VR-Donchian-RU.ex4 - Program file in Russian
- VR-Donchian-EN.ex4 - Program file in English
For MetaTrader 5
- VR-Donchian-RU.ex5 - Program file in Russian
- VR-Donchian-EN.ex5 - Program file in English
Documentation
- VR Donchian RU.pdf - Help file in Russian
- VR Donchian EN.pdf - Help file in English
Donchian Channel Indicator - Download and Install on MT4
Loading the Donchian Channel indicator is very simple. In order to do this, you just need to install the MetaTrader Supreme Edition plugin. Since the indicator is one of the indicators built into the plugin, you can use it right away.
Source: Admiral Markets MT4 - Navigator Window
Using the Donchian Channel indicator for MT4
Trading Strategy Turtle Strategy
Who are the Turtles and how did the Turtles' Forex strategy bring them millions of dollars?
Two Wall Street gurus once turned a group of beginners into professional traders. They achieved this in a few weeks. This group of traders were known as the "Turtles".
In the mid-eighties, famous speculator Richard Dennis had a bet with his friend Bill Eckhardt. The essence of the debate was: “nature versus nurture - do you have to be born a great trader or can you become one through training?”
The stakes were serious then.
The seriousness of his intentions is also indicated by the fact that Dennis advertised in the Wall Street Journal and the New York Times in order to recruit participants for this grand experiment.
After an initial training period of just two weeks, participants were released with actual profits. After a month-long trial period, the best “turtles” received over $1 million under management.
The most successful of them was only 19 years old, and he was given 2 million dollars, using which he made a profit of more than 30 million dollars. As it turned out, the trading rules that guided him were quite simple.
Essentially, he used what is called the Donchian trend system. And yes, as you may have guessed, this system is based on the Donchian Channel indicator.
The Turtles used two breakout options, or "systems." The first system (System One) used the 20-day price breakout for entry. The entry was filtered by a rule that was designed to increase the chances of catching a big trend, which states that a trading signal should be ignored if the last signal was profitable.
But there was a problem with this filtering rule. What if the Turtles missed the breakthrough? And what if the missed breakout was actually an entry? What if this was the start of a new and profitable trend?
If the Turtles missed the 20-day System One breakout and the trend continued to form, they needed to use something to get back into the market. This is where System Two comes into play. The System Two breakthrough acted as a defense. This is how the Turtles stopped missing big trends that had previously been filtered out. Thus:
- System 1 is a shorter-term system based on a 20-day breakout
- And System 2 is a simpler long-term system based on a 55-day breakout
The Turtles calculated stop losses for all trades using the average true range (ATR) over the last 30 days, a value they called "N". The initial stop loss was always ATR(30)*2, or in their words, two volatility units.
Additionally, the Turtles were able to funnel their profits back into winning trades to maximize their winnings, a principle known as pyramiding. They can create a pyramid of a maximum of four trades, separated from each other by a volatility unit of 1/2.
Exit strategy
Turtles typically exited their trades using breakouts in the opposite direction, allowing them to take the majority of the trend move. The exit strategy used in their System Two is as follows:
- Close long positions if/when price reaches 20-day low
- Close short positions if/when price reaches 20-day high
The exit strategy using System One took a slightly different approach:
- Close long positions if/when price hits 10-day low
- Cover short positions if/when price hits 10-day high
Money management strategy Turtle Strategy
The Turtles used 2% initial risk on all trades. However, the slightly aggressive pyramiding of more and more orders had its drawbacks.
If no major trend had emerged, small losses from false breakouts would have further reduced the Turtles' already limited capital. How did Eckhardt teach the Turtles to cope with losing streaks and protect their capital? They sharply reduced the number of their units.
As the markets turned around, this proactive tactic of reducing the number of units increased the likelihood of a quick recovery, again leading to the opportunity to make big money.
The rules were simple then. For every 10 percent account drawdown, Turtles reduce their trading risk by 20 percent. This, of course, applies to large numbers. A single risk will be reduced by 80%, with a drawdown of 40%.
Turtle Trading Strategy - Example
Source: GBP/USD Daily chart - Admiral Markets MT4-SE Platform. Please note that past performance is not indicative of future results and is not a reliable indicator of future performance.
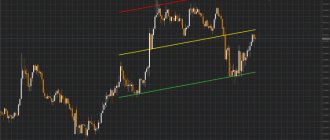
In the chart above, you can see the daily chart of the GBP/USD currency pairs on MT4, where the Donchian Channel strategy is applied several times. To set up a Turtle chart, apply the Admiral Markets Donchian channel indicator three times.
We used the Turtle strategy rules with these settings for this particular example. You can change the color and width of the line as you wish.
Source: Admiral Donchian Indicator - Admiral Markets MT4SE Platform, July 27, 2019
Source: Admiral Donchian Indicator - Admiral Markets MT4SE Platform, July 27, 2019
Source: Admiral Donchian indicator, Admiral Markets MT4SE platform, July 27, 2019
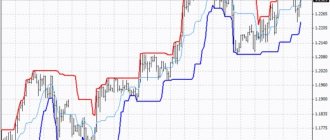
Notice how price breaks above and below Donchian channels in different places? As noted earlier, Donchian channels show the highest high and lowest low for the time you specify. When price breaks through channels, we may see new highs or new lows. This indicates the possible start of a new trend.
For Turtle Trading on MT4 we use the following rules: set up a daily chart, wait for the price to exceed the high or low price of the last 20 periods (Donchian Price Channel 20). Enter long or short depending on the breakout. Arrows indicate possible entries.
Source: GBP/USD Daily chart - Admiral Markets MT4-SE Platform. Please note that past performance is not indicative of future results and is not a reliable indicator of future performance.
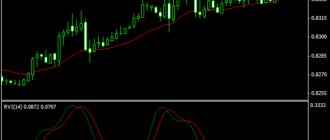
If the previous 20 bar breakout resulted in a profitable trade, the new breakout will be ignored. If you ignore the 20-bar breakout, you risk missing out on a big trend if price continues to move in the direction of the breakout.
This is when the aforementioned System Two can come in handy. If the price exceeds the 55 bar high/low, you enter a long/short position depending on the direction of the breakout respectively. In case you did not enter a trade on the 20 bar breakout, each new 55 bar breakout occurs regardless of whether the previous trade was profitable.
Source: GBP/JPY daily chart - Admiral Markets MT4-SE Platform. Please note that past performance is not indicative of future results and is not a reliable indicator of future performance.
— Principles of working with a long position
The principles of working with a long position are formulated as follows:
• The market is able to make a new low and close beyond the boundaries of the Donchian channel. The previous low can be made at least three candles earlier.
• As a rule, a pending buy order is placed on the next bar at the level of the previous low. If the order does not fire during a given bar, the transaction is cancelled.
• When a position is opened, place a protective stop order 1 point below the low of the previous or low of the 2nd bar.
• You need to take partial profit after 2-6 bars and pull the trailing stop behind the other part of the position.
These rules are formulated for a long position; for a short position, the opposite is true.
Figure 8 shows examples of working out this strategy.
Using MT4SE to Improve the Turtle Channel Indicator
To use proper money management (described at the beginning of the article), traders may need to download several additional indicators in addition to the Donchian Channel:
- ATR (Average True Range)
- Admiral Pivot indicator
ATR (per 20 bars) is used for exit strategy. Keep in mind that exits may be far from the entry price, so the initial stop loss for both systems is set at 2 x ATR 20.
For example, if the ATR is 101 pips, the initial stop loss will be placed 202 pips from the entry price and then manually updated once the low/high of 10 or 20 bars is lower/higher than the initial stop.
The Admiral Pivot indicator can be set monthly if you are trading on daily time frames and it can also help with exits.
Admiral Pivot takes standard price information such as high, low and close and uses this information to predict possible support and resistance levels and more, allowing traders to customize the different types of time frames used for the calculation.
Source: GBP/JPY daily chart - Admiral Markets MT4-SE Platform. Please note that past performance is not indicative of future results and is not a reliable indicator of future performance.
Keep in mind that Admiral Donchian is also available on the MetaTrader 5 trading platform.
About us: Admiral Markets
As a regulated broker, we provide access to the most popular trading platforms in the world. You can trade CFDs, shares and ETFs with us.
This material does not contain, and should not be interpreted as containing, investment advice, investment advice, or an offer or solicitation of any transactions in financial instruments. Please note that such trading analysis is not a reliable indicator for any current or future trading as circumstances may change over time. Before making any investment decisions, you should seek advice from independent financial advisors to ensure you understand the risks.