- Creator of MACD
- A Brief History of MACD
- Formula
- Description of MACD
- MACD line
- Signal line
- bar chart
- Strategy
- Signal line crossing
- Crossing the zero line
- Divergence
- Positive divergence (price up)
- Negative divergence (price down)
- Trading MACD in binary options
- Are there any disadvantages?
- How to set up MACD
One of the most popular technical analysis indicators in the world is MACD, which stands for moving average convergence/divergence.
This wonderful tool, created by Gerald Appel, is known to every trader of any asset, from gold to stocks, futures or, of course, binaries.
Most of the super successful and easy to use indicators were created by cool traders who earned their millions with their help. In this regard, Appel's story is very revealing.
History of origin
The MACD indicator shows us exactly what its name says - to what extent the moving averages on the chart have converged or diverged. This indicator was developed by the famous New York trader Gerald Appel in 1979 to analyze the stock market, and then, as often happens, it migrated to other financial markets, including Forex. The main reason the MACD indicator is so popular is that it does provide a lot of useful information about the market, while combining the properties of both a trend indicator and an oscillator. The author of the indicator, Gerald Appel, is also the author of several books, such as “Winning Marker System: 83 ways to beat the market”, “Stock market trading systems” “New directions in technical analysis” and others, and also published his own newsletter “Systems and Forecasts".
How to spot explosive price movements using MACD?
Explosive price movements usually occur after a period of low volatility, when the range of candles becomes denser and the candles themselves are small in size.
The MACD histogram will help us identify such periods in the market.
- The price reaches a structural area on the chart (horizontal level, trend line, moving average).
- The MACD histogram appears almost flat with no visible peaks or troughs.
- We open a position for a breakout when it occurs.
Here are some examples:
MACD indicator calculation
The MACD indicator uses as many as three moving averages in its calculations, although we see only two on the chart - the value of the long moving average is subtracted from the value of the shorter one, and then the difference is smoothed out again. Why so much smoothing? Why do you need to smooth anything at all? The answer is obvious - just look at the price charts. Sometimes “you can’t see the forest for the trees,” and, especially when prices are jittery from a lot of news, it’s difficult to trace the true trend and understand where the price is moving. Smoothing removes all these jerks and deceptive maneuvers, leaving only the general direction of prices. Well, the payment for smoothing is lagging signals. With trend trading, this is even good - all false movements and noise are eliminated, but with scalping, of course, it is unacceptable - before you are ready to enter, the time to exit will come. So, when constructing the MACD indicator, double smoothing is used, which guarantees that since the MACD has gone down, the trend is really changing.
The MACD indicator is drawn “in the basement” of the terminal, like all oscillators. The original indicator proposed by the author looked like two moving averages, the intersection of which gave signals for action:
Subsequently, one of the lines began to be depicted as a histogram (stripes or bars oscillating around the zero line). This is the modern look of the MACD indicator that you see in the terminal:
So, MACD simply calculates the difference between the fast and slow moving averages. When the MACD is above zero, it indicates that the fast moving average is higher than the slow moving average. When below zero, fast is lower than slow. Accordingly, a rise in MACD indicates a growing bullish trend, while a fall indicates a bearish trend.
Well, now let's take a look at the formula for calculating MACD. First of all, we need to prepare two exponential moving averages - long and short, and then find their difference:
MACD=EMA(CLOSE,PL)-EMA(CLOSE,PS), where
EMA – exponential moving average;
PL and PS – long and short periods of exponential moving average;
This is the line that you see as a histogram in the modern version of the MACD indicator. It's called the fast MACD line, back when it was still a line.
The next step is to calculate the signal line as a simple moving average from the difference of two exponential moving averages calculated above:
Signal=SMA(MACD,Pa), where
SMA – simple moving average;
Pa – period of the indicator signal line.
This is how we got that red line on the graph. It is called the slow MACD line or signal line.
Also often mentioned is the so-called MACD histogram. This is not the same as the MACD indicator itself described above. The histogram is the difference between the MACD value and the signal line, that is:
MACDHistogram = MACD – Signal:
I haven’t seen the use of the MACD histogram for a long time, and you won’t find it in the terminal either. But if you suddenly come across a MACD histogram somewhere in the literature on technical analysis, you will no longer confuse it with the MACD indicator.
How the indicator works
The operating principle of this algorithm can be briefly described as follows:
First, the difference between two exponential moving averages is calculated (their periods are 12 and 26 , default settings). the value of the main line is calculated , it is presented in the form of a histogram:
MACD = EMA12 – EMA26
Then the obtained values are smoothed one more time, and a simple moving average is used. Its period is also set through the settings; by default it is 9 . Since the price is smoothing for the second time , the signal line always lags behind the MACD line:
SignalLine = SMA9 ( EMA12 - EMA26 )
For clarity, I will show the voiced full description of the operation of the oscillator using a specific example .
MACD Histogram values is the same, but one more operation is added - the difference between the value of the main line and SignalLine :
MACDHistogram = MACD - SignalLine
Trading with the indicator will become easier if you understand how it works. This is true for all algorithms , not just MACD. Moving averages are shown in the screenshots for a better understanding of the calculation algorithm.
Settings
The indicator has four parameters - the period of the slow moving average, the period of the fast moving average, the period of the signal moving average and the price for calculation.
As a rule, periods are taken as 12, 26 and 9, and the price for calculations is the closing of the candle. It was precisely these periods (12 and 26) that Appel himself recommended for those wishing to sell. For buyers, the author recommended using 8 and 17. But this applied to the stock market, and for other markets you can safely use standard periods or choose your own.
Divergence
Divergence with MACD is no different from that for Stochastic. The principle is absolutely the same. If the MACD goes up and the price goes down, then you need to listen to the MACD: the price will change and also go up.
Positive divergence (price up)
For example, in the figure below, we see that the price for the period highlighted by the arrow is falling, but the MACD, on the contrary, is tending upward. The indicator is right and sees the situation in advance - the price will go up. This is what happens.
Negative divergence (price down)
The same eggs, only in profile. The MACD is trending downwards and the price will soon follow.
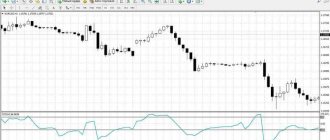
Intersections
The moving average, as I already said, smoothes out the influence of random price fluctuations. The difference between the two moving averages smooths the price even more. As a result, this leads to the fact that MACD generates fewer false signals, but at the same time lags considerably. However, the MACD in a narrow range behaves much better than a simple crossover of two moving averages.
When applying this type of signal, purchases are taken when the MACD histogram crosses the signal line from the bottom up. For sales the opposite is true. This type of signal is taken when there is a good trend. For example, in a bearish trend, they enter into sales when the MACD indicator crosses the signal line from top to bottom, and exit the transaction when it crosses back. That is, entry into a trade often occurs just at the end of a rollback against the trend, and exit when there are signs of its beginning. The picture above shows an example of trading at the intersection of MACD and the signal line. The trend is determined according to the classical rules - we have a local maximum and a local minimum. When a new local maximum appeared below the previous one, there was an opportunity for a trend change. When the level of the previous low was broken, one could assume the emergence of a new bearish trend and begin to wait for sell signals using the MACD indicator. Before the high-low order broke (the new high ended up being higher than the previous one, signaling a possible change or end to the trend), we made 4 trades, three of which resulted in a decent profit and one a small loss.
How to properly use the MACD histogram to identify a reversal?
When I first started trading, I mostly traded breakouts. The larger the candles were, the more often I entered the market. However, the result of this strategy was constant losses. That's when I realized that my entry into the market was too late. I usually opened my trades, and after that the price immediately turned in the opposite direction.
Then I thought, “What if I do the opposite and take a position in the opposite direction of the current momentum?” As a result, my trading results became much better.
The MACD histogram can help us determine a strong impulse. Here's how it works:
- We wait until the price reaches a structural area on the chart (for example, a horizontal level, trend line, moving average).
- The MACD histogram should show strong momentum.
- On a price rebound, we open a position in the opposite direction.
Here's an example:
Oscillator
What is the logic of this indicator? MACD is the difference between two moving averages, fast and slow. A fast moving average characterizes a short-term trend, while a slow moving average characterizes a longer-term trend. The greater the divergence between these moving averages (the higher or lower the MACD histogram is above zero), the more bullish or bearish the market. There is such a thing as reversion to the mean. So, price fluctuations always return to their average price. In the case of the MACD indicator, price fluctuations (slightly smoothed) are represented by a fast moving average, and the actual price average is a slow one. Accordingly, the fast average always returns to the slow one, and the difference between these moving averages always returns to zero. Moreover, the further the averages diverge, the higher the histogram rises or falls, the greater the likelihood that convergence is about to begin, that is, the movement of the histogram will turn towards zero.
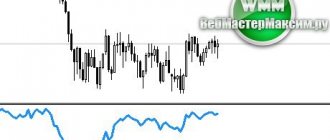
Therefore, the next type of signal from this indicator is the appearance of highs and lows, which are used in the same way as in the case of other oscillators. The only point is that MACD does not have predetermined overbought and oversold levels. The analysis is performed by eye. In the picture above, I visually determined the level of 0.0085 and plotted it on the chart. As you can see, crossing the overbought/oversold level in the opposite direction often serves as a turning point for the price, or at least the beginning of a correction. This does not always work with great accuracy, as, for example, when working with the upper level in the picture, but, nevertheless, this signal is much more reliable than that of many other oscillators. And in combination with levels, the accuracy or when working with a trend, the accuracy increases many times over.
By the way, if there is a trend, you can use the following trick, based on the lag of slow oscillators. I already talked about it in the article about the Stochastic Oscillator. The point is that after breaking through the overbought/oversold level in the event of a trend movement, the price may continue to move in the same direction for a long time, and the oscillator may dangle behind the levels. The picture above clearly shows a good uptrend. Entry into a purchase is carried out when the MACD indicator breaks a certain level, and exit from the transaction is carried out when the indicator simply crosses its signal line. Using pending orders will make entries even more accurate. The point here is that by raising the level above the zero line, we simply filter out minor price spikes. Our level is broken only by really strong movements, which we take.
Reverse Bullish Divergence
In the screenshot below you can see an example of an inverted bullish divergence.
- Two lows have been formed, with the last one being higher than the previous one.
- The MACD divergence is connected by a dotted green line with an upward arrow.
Example of an inverted bullish divergence
If an inverted bullish divergence has formed on the chart, the price will rise.
Figure 3. Bullish divergence on the chart.
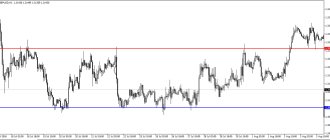
Position relative to the zero line
If there is a directional trend, it is very good to enter in its direction right at the peaks and troughs. But what if the direction of the trend is unclear, but the movements are very volatile, in a wide range? You just need to take into account the position of the indicator relative to the zero line. In the picture above, sell signals are taken when the MACD and the signal line cross above the zero level, and buy signals are taken below. That is, in essence, we combined the two approaches listed above - using MACD as an indicator and using crossovers. If you take all the signals in a row according to these rules, as in the figure above, then you can earn a decent number of points on such wide ranges. In the first transaction there were sales, in the second the closing of sales and, since we were below the zero line, the opening of purchases. At the third point, purchases are closed and sales are opened again. Moreover, such a simple trade would have brought us 16 transactions, two of which would have closed at approximately zero, and the rest would have brought a profit of around 4,500 old points.
You can go even further and plot a couple of levels above and below zero on the MACD chart to filter out minor fluctuations. In this case, you can take only those transactions for which the MACD previously broke through these levels when a signal appeared. That is, crossovers occurred above or below these levels or near them. In this case, we will use the oscillatory properties of MACD even more fully.
In general, the MACD can be used most effectively in such conditions – when the market is not in a specific trend and the range of fluctuations is quite large.
Strengths and weaknesses of MACD
Among the advantages of the indicator, I would like to note:
- good filtering of price noise ;
- the ability to work both during a trend and during a flat ;
- can be used both as the basis of a vehicle and simply as a filter . For example, it can be added to a strategy solely to search for divergences that can act as a reason to close a trade.
disadvantages :
- Due to the fact that the price value is smoothed several times using moving averages, the signals are delayed . If the movement starts abruptly, then by the time the MACD gives an entry signal, it will be too late. The ratio between potential profit and loss will become too unfavorable;
- although it belongs to the oscillators in MT4, it does not have oversold/overbought levels , as in Stochastic. So using it as an oscillator is not entirely convenient.
But the disadvantages cannot be considered critical ; the advantages are much more significant. Do not forget that the trading result is influenced not only by the quality of the signals, but also by a number of secondary issues, for example, the choice of broker. I have already considered the question of where is the best place to open a brokerage account; beginners should familiarize themselves with this material. Here I will additionally provide a table with the conditions of major brokers.
| Company | Just2trade | United Traders | BKS | Tinkoff investments |
| Minimum deposit | From $100 | $300 | from 50,000 rub. | Unlimited, you can even buy 1 share, they recommend starting from RUB 30,000. |
| Commission per cycle (buy + sell trade) | 0.006 USD per share (min. 1.5 USD), 0.25 USD for each application. that is, per lap – $3.50 | “Beginner” tariff – $0.02 per share Average $4 per round | At the “Investor” tariff – 0.1% of the transaction amount, at the “Trader” tariff it is reduced to 0.015% | 0.3% for the “Investor” tariff |
| Additional charges | The ROX platform will cost at least $39/month. (for the American market), for an additional $34.50 they connect Canada/TSE, Level II On the over-the-counter market, the additional fee is 0.75% of the transaction volume (minimum $30), in the case of dividends - 3% from the issuer (minimum $3) | On the Day Trader tariff, they charge $60/month for the Aurora platform, free on other plans | If the account has less than 30,000 rubles - 300 rubles/month. for access to QUIK and 200 rub./month. for access to the mobile version of QUIK, | — |
| Account maintenance cost | $5/€5/350 rub. reduced by the amount of the commission paid | — | 0 RUR/ month on the “Investor” tariff. On other tariffs, funds are debited only if there was activity on the account this month | Free for the "Investor" tariff |
| Leverage | for Forex Up to 1 to 500 for stocks up to 1 to 20 (day) to 1 to 5 (night) | 1 to 20 on the Day Trader tariff, this is the maximum leverage (daily) | Calculated for each share, within the range of 1 to 2 – 1 to 5 | Calculated for different instruments, the calculation is linked to the risk rate |
| Margin call | -90% | Standard -30% of the deposit, in technical terms. support can be set -80% | Calculated based on the risk for each security | Depends on the asset |
| Trading terminals | MetaTrader5, ROX | Aurora, Sterling Trader, Fusion, Laser Trader, Volfix.Net, Pair Trader | My broker, QUIK, WebQUIK, mobile QUIK, MetaTrader5 | The purchase of shares is implemented like an online store, professional software is not used |
| Available markets for trading | Forex, American, European and other stock markets, cryptocurrency | American and other stock markets, more than 10,000 assets in total, cryptocurrency | Foreign exchange, stock, commodity markets, there is access to foreign exchanges | American and Russian stock markets |
| License | CySEC | Lightweight license from the Central Bank of the Russian Federation | TSB RF | TSB RF |
| Open an account | Open an account | Open an account | Open an account |
Determining the further short-term trend using the histogram bars
So, using the histogram bars, you can determine the continuation of the current short-term trend and even build a simple trading system based on this property of the indicator.
Very often, when a new peak appears, immediately after the MACD indicator crosses the zero mark, another higher peak appears. As a rule, after breaking through the first peak, the price continues to move or immediately reverses. If you place pending orders above the first candle where the MACD indicator broke through its previous high, you can get a quite profitable trading system.
conclusions
- MACD is an absolute price indicator that is not suitable for comparing two securities;
- Linear MASD is undoubtedly a trend (lagging) indicator. It is suitable for analyzing the trend and momentum of a stock price, since it receives its values from the chart;
- The MACD histogram can most likely be called an oscillator. More suitable for making trading decisions;
- Divergence is one of the most powerful signals in trading. The MACD represents it perfectly;
- Colored MACD, combo, with entry points - these and other modifications greatly simplify the trader’s work.
Friends, that's all. I am sure you will have questions that you can freely ask in the comments. And we have two more big topics on the MACD stock indicator: how to use it and divergence. Good luck and be successful!
Technical analysis figures
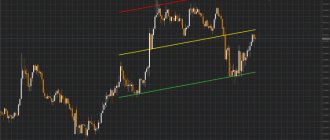
If you carefully examine the histogram drawn by the MACD indicator, you will notice that the figures on it work quite well.
The picture above clearly shows that when using the principle described in the previous paragraph, you can also successfully trade classic patterns, such as head and shoulders, double bottom. The picture above shows a double bottom of the MACD indicator. If the right shoulder is broken, you can place a pending order (to buy in this case) and enter at the very beginning of a new movement.
Classical Bearish Divergence
Often, after a price rise in the market, you can see bearish divergence .
- The limit maximum price has been reached.
- There was a correction, but the price decided to go a little higher, and another high was formed.
- But the standard MACD bars began to show a decline.
- The FX5 MACD Divergence indicator indicated a downward trend; sales can be considered.
An example of a classic bearish divergence
Figure 4. Bearish divergence on the chart.
Sharing with other indicators
Sharing indicators is always a good idea. Each indicator has its own strengths and weaknesses. The computer will allow you to plot as many indicators on your price chart as you want. Try to combine them. Oscillators work especially well in turbulent market environments and at important turning points when the trend loses momentum. During a strong upward trend in the market, oscillators can do more harm than good.
The signals generated by stochastic lines tend to appear too frequently and are unreliable when using only the stochastic. MACD crossovers are less frequent and more reliable (though usually slower). A way to increase the value of both indicators is to combine them. Why not, for example, use the trend-following characteristics of the MACD system as a stochastic filter? In other words, follow buy signals on stochastic crossovers only when the MACD lines have a positive projection.
You can also use the weekly MACD histogram as a filter for daily stochastic signals. You will use buy signals on the daily stochastic chart to enter the buy side only when the weekly MACD histogram is positive or rising. In such a bullish environment, you are better off ignoring short-term sell signals from the more sensitive stochastic system.
Overbought and oversold
The MACD indicator can also give overbought or oversold signals.
- The MACD is overbought when the MACD line travels a relatively large distance from the signal line. In such cases, we expect the bullish move to exhaust itself after a strong rally and the emergence of a bearish move.
- The MACD is oversold when the MACD line moves a significant bearish distance from the signal line. In this case, we expect the price to exhaust itself and enter a bullish phase.
In the green rectangle you see a case where the fast MACD line is at a relatively large distance from the red signal line. This indicates oversold conditions.
Advantages of MACD
One of the main advantages of MACD is that it includes elements of both momentum and trend in one indicator. As a trend-following indicator, it will not give false information for too long. The use of moving averages ensures that the indicator follows the movements of the market instrument. By using exponential moving averages instead of simple moving averages, it was possible to reduce the lag. Divergences in the MACD can be key factors in predicting trend changes. Negative divergences signal that bullish momentum is declining and a trend change from bullish to bearish is possible. This may serve as a warning sign for traders to lock in some profits in long positions or for aggressive traders to consider taking short positions.
Results
One thing that speaks in favor of MACD is that traders have been using it for more than 40 years in all types of markets . This proves the effectiveness of the algorithm. At the same time, I want to warn beginners. This is by no means a holy grail , just another effective tool to include in your arsenal. It will not give you 100% profitable signals, but it can increase the efficiency of your trading if you use its signals wisely.
I propose to consider this review complete. Don’t forget to subscribe to my blog updates, there are many more interesting materials awaiting you!
If you find an error in the text, please select a piece of text and press Ctrl+Enter. Thanks for helping my blog get better!
Disadvantages of MACD
One of the advantages of MACD can also be a disadvantage. Moving averages, whether simple, exponential or weighted, are lagging indicators. Even though the MACD represents the difference between two moving averages, there may still be some lag in the indicator itself. The MACD is not particularly good at identifying overbought and oversold levels. While it is possible to identify levels that historically represent overbought and oversold conditions, the MACD does not have any upper or lower limits limiting its movements. MACD may continue to move beyond historical extremes. MACD calculates the absolute, not relative, difference between two moving averages. It is calculated by subtracting one moving average from another. If a market instrument rises in price, then the difference (both positive and negative) between the two moving averages will increase. Therefore, it is difficult to compare MACD levels over a long period of time, especially for instruments that have risen exponentially.
Classical Bullish Divergence
As soon as the price reached the next low, which was lower than the previous one, the price formed a minor correction, then broke through the support line and returned down.
The standard MACD indicator as well as the MACD Divergence indicator displayed this type of divergence on the chart.
A green upward arrow appears, signaling a price increase.
An example of a classic bullish divergence
Figure 5. Classic bullish divergence.
Monitoring results
Myfxbook has several monitoring results of advisors based on the MACD indicator. Let's take a look at some:
- Already reviewed MACD + Stochastic . Over the period since last year, the profit has exceeded 100%, however, you need to take into account that trading is carried out on a demo account, but the result is approximately the same as what we got when testing in the strategy tester. Note that the adviser did not lose the deposit during the year of operation; this is a good result for the Martingale method.
Monitoring the MACD + Stoch advisor.
- MACD + Bollinger Bands – shows approximately twice as bad efficiency, and the drawdown is large. But it still remains in the black;
Monitoring the MACD + Bollinger Bands advisor.
- There is an interesting monitoring of an advisor that works only on MACD signals. True, the author is silent about the additions to the rules, but the result is obvious - over 100% profit in a couple of months of work.
Monitoring the advisor on MACD.
There are also leaking monitoring, but in general, they prove that a good advisor can be created based on this oscillator.
Instructions for setting up MACD Sample
The MACD Sample trading robot contains a minimum of settings due to its very simple and reliable strategy. However, with their help you can easily adapt the expert to any time frame and currency pair. The settings themselves look like this:
Fig 3. MACD Sample robot settings
1. Take Profit – the desired profit in points, upon reaching which the robot will close the position; 2. Lots – trading lot with which the robot will open its positions; 3. TrailingStop – moving the stop order by a specified number of points after the price moves towards profit; 4. MACD Open Level – the base coefficient for calculating the size of the MACD column required to open a transaction; 5. MACD Close Level – coefficient used to close a transaction with an opposite signal; 6. MA Trend Period – period for calculating the Moving Average line used for trend analysis;