Thanks to this indicator, a trader has the opportunity to more accurately monitor the dynamics of an asset, determine trend change points, and make profitable trades.
There are 4 types of moving averages:
- indicated above - Exponential Moving Average;
- simple (Simple Moving Average);
- smoothed (Smoothed Moving Average);
- and Linear Weighted Moving Average.
Exponential is considered the most convenient and successful option.
The EMA indicator takes a set of data (closing price levels for a specified period) and provides their average price. Moreover, the MA moves along with the price, not limited by any ranges or boundaries. Time frames can be different, moving averages at all time frames can lag - as a rule, the longer the period, the stronger the lag (on small time frames the lag is minimal).
EMA construction
Forex traders often use moving averages SMA and EMA in trading. EMA is calculated using the following formula:
(CLOSE (i) * P) + (EMA (i - 1) * (1 - P) = EMA,
Where:
- EMA (i - 1) – displays the value of the moving average for the previous period;
- P – share of price value usage;
- CLOSE (i) – closing value of the current period.
The formula of the EMA indicator for MT4 is constructed in such a way that the value of the first prices will have a minimum value, and the price of the last ones will have the greatest value. As for the simple moving average, for it the value of all Japanese candles will be the same.
Calculation of the EMA instrument
In order to calculate the required point on the timeframe, you should add part of the real closing cost to the previous price. In practice it looks like this:
You might be interested in: What is an ATM and what is it for?
EMA (t) = EMA (t-1) – EMA (t-1)) + 2*(P(t) , where:
- EMA (t) – exponential indicator for a specific cycle;
- P(t) – the price at which the previous Japanese candle closed;
- EMA (t-1) – the size of the previous segment to be measured.
Many traders do not study the rules for calculating the indicator, but only remember when to use EMA and when not to. The main advantage of the indicator remains its quick response, and if the trader’s system is based on entry precisely at the moment when a new trend in the market is just emerging, you just need to correctly set the parameter for the time frame on which trading is taking place. You can find a description of the EMA indicator on the website of any Forex broker.
What are the differences between SMA and WMA from EMA?
Below in the screenshot of the chart there are three moving averages that have the same periods. Faster EMA (black) compared to SMA (red), but smoother compared to the WMA indicator (blue).
Thus, the applied moving averages in relation to the current price will move either closer or further .
Figure 1. Currency pair – EUR/USD, indicators – SMA10, WMA10, EMA10.
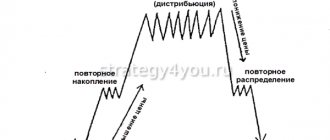
Trading strategy using the TMA channel
Since it is intended for low-volatility areas of the market, all trading strategies focused on working in a relatively stable channel are suitable. In general, the vast majority of them assume:
- buying when the price and lower limit approach;
- selling when the price and the upper limit converge.
Such flat areas are formed almost daily - during the absence of American and European exchanges on the market. At this time, there are either no active sessions on the market at all, or they affect quotes that do not contain the country’s currency very little. Thus, during the Asian session, excessive changes in the euro, American dollars, ruble, British pound, etc. will not occur (global fundamental factors may influence). But quotes with the Japanese yen and other Asian currencies can be quite volatile.
Thus, areas with relatively low volatility appear every day on weekdays from 21.00 (GMT), when the American session ends, to 5.00 (GMT), when the European session opens. In Moscow this is the period from 00.00 to 8.00. And in the vast majority of the Russian Federation, this period falls on deep night. Having learned to work well during such lulls, you need to be prepared for the possibility of working exclusively at night.
Figure 3. A section of the Asian session with noticeably reduced volatility between the end of the American session and the beginning of the European one (highlighted by two red straight lines).
It is important to correctly configure the TMA channel indicator specifically for the features of the Asian session. In Fig. Figure 3 shows that the boundaries of the channel, which follow the extremes well (outside the area highlighted with red straight lines), built with the default settings, become very wide during the Asian session (highlighted area).
Figure 4. The area highlighted in Fig. 3, but on the M1 timeframe.
The solution to this problem (bringing the channel boundaries closer to the formed price extremes) may not be changing the parameters, but switching to a lower timeframe. In Fig. 4 shows that in this case there are quite a lot of opportunities for opening positions during 8 flat hours.
Video
Application of exponential moving average in trading
The EMA indicator is used in trading for the following purposes:
- Stop-Loss settings.
- Determine the direction of the trend.
- Trading signal after moving averages cross.
- Acts as resistance/support zones.
- Can be used with a number of other indicators.
Note that Exponential Moving Average perfectly determines the current market trend. For a bullish Forex trend, the following conditions must be met:
- the EMA indicator should look up;
- the current price is above the EMA;
- an exponential average with a shorter period should be above an EMA with a longer period.
Let us note that a correctly selected period of the exponential average line for the specifically considered time frame will qualitatively indicate the levels of resistance and support. To limit losses through Stop Loss, this stop order should be placed far beyond the EMA indicator for MT4, and not forget beyond local extremes.
Many traders continue to consider the moment of crossing the EMA at various time intervals as a strong signal to enter the market. But this approach to market trading no longer works , since the EMA lags behind the market movement, especially when it is in sideways movement.
We recommend the EMA indicator for MT4, but still use it for charts up to H4 . The fact is that this indicator reflects the current price position more accurately than all other moving averages.
This is how the EMA indicator with a period of 50 looks on the chart of the EUR/USD currency pair, timeframe H4:
Figure 2. EUR/USD, H4, EMA50.
Exponential Moving Average indicator
Moving averages are a popular and favorite trading tool among investors of all categories. No matter what kind of capital you manage, the moving average indicator is ready to provide benefits for every currency asset and time period. Today we want to tell you what the EMA Forex indicator is and how to use it correctly. This program is an integral part of more than a dozen trading strategies, and helps to filter false commands from other elements of the system.
Exponential Moving Average is one of the most respected types of moving averages. It is not as easy as a simple line, nor is it complicated by extra numbers like a weighted curve. Due to its acute reaction to recent market fluctuations, it is very common in trading techniques. The EMA indicator formula is designed in such a way that the latest price of a commodity gives the most accurate picture of the positioning of players on the exchange. The extreme value of the product is most important, while past values lose their relevance. The tool is calculated as follows.
To calculate the starting point on the chart, we must add part of the current closing cost to the previous value. It looks like this:
EMA (t) = EMA (t-1) + 2 *(P(t) – EMA (t-1)), where:
- EMA (t) – parameter of the exponential curve for the current cycle;
- EMA (t-1) – the value of the previous measured segment;
- P(t) – closing cost of the previous Japanese candle;
Click the button to go through a step-by-step guide to the “EMA Indicator” and master this tool in a few simple steps Explore »
Most traders, instead of memorizing the formula, prefer to have an idea in what situations it is necessary to use the EMA indicator. The main advantage is the speed of response . Therefore, if your system is designed to enter at the moment a trend emerges, you need to select a parameter for the appropriate timeframe.
Before we look at the description of the EMA indicator, let’s look at the customizable values of the Forex indicator. All moving averages are installed on the chart in the same way. The easiest way is to drag a tool from the Navigator window . Or open the “Insert” tab, go to “Indicators” and click on the required element. In the “MA Method” window, fix the exponential line – Exponential. Here you can select at which points the curve will be constructed. Construction by Open, Close, High, Low is allowed. Also, the description of the EMA indicator includes the period and shift.
What period and shift value to use depends on the current trading model. For example, the Caesar strategy analyzes the EMA indicator for MT4 with a period of 21. Based on the slope of EMA21, the Caesar strategy determines the trend vector, and the intersection of the asset value with the line is considered as a change in the trend line. The closer the indicator angle is to 90 degrees, the stronger the impulse. At the flat stage, a curved line divides the price chart in half, moves horizontally and does not give trading commands. Crossing of the price and EMA21, a signal characteristic of all moving averages, signifying a change in the mood of trading participants. These are the main purposes for which the program in question is used.
Another example of a profitable technique is the Puria Forex method. In it, the EMA indicator with a small period of 5 plays a characteristic role. At the moment of intersection of the fast exponential line with the slow weighted curves (WMA85 + WMA95), the medium-term trend changes. Let us remind you that in the settings you need to “apply the EMA to” Close. The basis for opening an order, such as crossing slow and fast moving averages, is another typical function performed by the EMA. And the Puria Forex method is a perfect illustration of this.
Click the button to go through a step-by-step guide to the “EMA Indicator” and master this tool in a few simple steps Explore »
In trading models, in addition to a combination of moving averages that differ in the method of construction, not one EMA indicator for MT4 can be used, but several at once . An excellent example is the Rainbow strategy. It uses 3 moving averages with an exponential construction method at once. Even binary options consider Rainbow as a quality trading system. It has 3 lines at once with periods of 6, 14, 21. The intersection of fast curves with different parameters gives a command to buy a lot. This example demonstrates the versatility of the tool in question.
The final example of how to use the EMA indicator for MT4 profitably will be the FX50 trading strategy. This technique uses a long period of 50. In the context of the FX50 strategy, the EMA indicator:
- Plays a support/resistance role.
- The tilt angle records whether there is a trend in the market.
- Crossing with the value of a currency pair gives a command to conclude a transaction.
All described strategies are presented on our website. You can access detailed, educational guides for free. Each system mentioned is a high-quality and profitable Forex trading technique that uses the EMA indicator. This is not a complete list of curve-based profit making methods. We wanted to show the variety of possibilities provided by the standard MT4 terminal tool. Let's summarize the purposes for which the line in question is suitable.
Click the button to go through a step-by-step guide to the “EMA Indicator” and master this tool in a few simple steps Explore »
- The angle of inclination will indicate the existence of a trend.
- Moving vertically divides the price chart in half and reports a sideways trend.
- Support/resistance.
- Crossing with a financial asset is a message about a change in positioning on the stock exchange.
- Crossing fast and slow moving averages as a basis for buying/selling goods.
- Analysis of crossing only fast lines.
- Intersection analysis of slow curves only.
- Analysis of the intersection of lines that differ in the method of construction. For example, EMA indicator + SMA indicator + WMA indicator.
- Use in conjunction with technical indicators within trading models.
For each time period, you should individually select the period settings based on the goals being pursued . Due to its fast response, it most often works on the H1 and H4 intervals. In the training manual on the Forex Academy website dedicated to EMA, you will find more examples of its use with other instruments, and you will also be able to study the moving average in detail. We recommend studying all Moving Averages to understand which curve is best suited for your system.
The following example will help you understand what the EMA Forex indicator is and how it differs from other MA indicators. A simple sliding road can be thought of as a flat road, moving along it at different speeds, and the average travel time is displayed on the on-board computer. Such information will be useful in calculating the final figure for achieving the goal. Weighted sliding is similar to steps. The most important stages are those you are at or about to enter. Each completed stage is no different from the previous one. The EMA indicator is comparable to climbing a mountain. The flat path gives way to steep serpentine roads. The place where you are has the highest value, and the path you have traveled loses its relevance.
Using examples, we tried to consider not only the description of the EMA indicator, but also how to use it in practice. The presence in a huge number of trading techniques indicates the importance of the tool for the modern trader.
About false EMA breakouts
Like any indicator in the Forex market, it cannot be called an ideal tool for making money . The EMA indicator also shows false entries, which are not always identified by market participants within the framework of breakdowns of moving averages. Often, false breakouts are observed during sideways market movements. After all, the price periodically breaks through the EMA from top to bottom, then from bottom to top.
Naturally, in such cases, the Stop Loss will need to be moved far beyond the limits of the opposite polarity of the exponential moving average. You need to focus on nearby local extremes.
Figure 3. Examples of false breakouts.
Basis of operation
The TMA indicator is a channel indicator based on moving averages. This asset was invented recently, so it cannot be found in major trading terminals. But this issue can be resolved quite simply - just download a third-party library. The main difference from other channel tools is double smoothing of each line. This has both its positive and negative sides. Let's consider them further.
Open a demo account with the broker Intrade.Bar
The main disadvantages of working with the EMA indicator
To better understand what the Forex EMA indicator is, let’s talk about its disadvantages:
- All moving averages follow price, and therefore they are late in identifying a new trend. They become effective only on pronounced price movements.
- The pair can move long enough until the EMA indicator shows a signal to enter the market.
- There are many false signals within the “sideways” trend.
- Due to the fact that the indicator does not keep up with the price, its signals will be delayed, which increases the risk of making a profit on the transaction.
Concept of MA
A moving average is a chart built using averaged data for a certain period. Used in statistical, technical, economic calculations. The indicator helps to identify trend changes and smooth out the impact of random events on our perception. We use the method in a simplified form in everyday life subconsciously because it is logical and simple.
The way the actual quantities are mixed and divided affects the final result. Returning to the example, we may place greater emphasis on speed in a traffic jam because it is characteristic of the area, or vice versa. Perhaps the avenue is located at the exit of the city, and during the summer season the traffic becomes denser. Then, when planning our trips, we attach more importance to the time spent yesterday than a week ago.
It’s the same on the stock exchange: varieties of moving averages allow you to make forecasts taking into account various factors. The trader determines their relevance independently, based on real market conditions.
Trading system “Alligator”
For the work to be considered completed, we need to install 3 EMA indicators, which will have different parameters and shifts over time periods. In addition to them, you will need to install the Fractal indicator.
For deeper trading efficiency, it is best to pay attention to the following parameters:
- EMA 9 (shift 3);
- EMA 15 (shift 5);
- EMA 25 (shift 8).
The construction of all exponential averages is based on half the sum of each closed candle.
Please pay attention to the location of the current price . If it is above its value, then only purchases are considered. If it is under the moving average, then sell. You should take profits when the movement slows down.
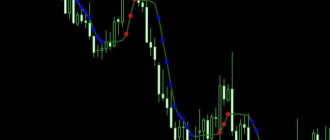
In the example below, we showed examples of work using the Alligator strategy. Price moves beyond all exponential moving averages when a bullish trend occurs.
The 1st local maximum is formed (it is marked with the fractal indicator). Our EMA 9 indicator breaks through two slow moving averages from bottom to top. So, we can observe how 2 signals are generated simultaneously:
- The EMA lines are crossing.
- Fractal appears.
Figure 4. Alligator trading.
More cautious traders who have read the description of the EMA indicator prefer to wait for the price to roll back to the lips of the “Alligator” and only after that enter the market. However, in this case, it was possible to open a sell transaction.
Conservative traders can wait for the price to fall back to the alligator lip line before entering trades. From our point of view, this approach is the most correct.
Terms of trade
RSI TMA Centered Bands is a hybrid tool that combines the characteristics of a channel TMA and an RSI oscillator. The new combination turned out to be successful, as it allows you to simultaneously evaluate:
- the probability of a change in trend direction towards growth or decline;
- the degree to which the selected option is overbought or oversold.
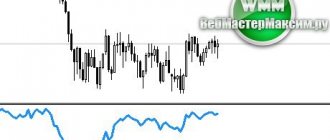
This indicator signals an imminent change in upward trend direction when the oscillator line rises above the central TMA line. A probable fall in the value of an asset is indicated by a chart on which the RSI is below the TMA line.
In addition, an asset is overbought when the RSI line is above the upper line of the TMA indicator; oversold – RSI line below the lower TMA line.
The modification under consideration uses an oscillator with a small period. The default value is three. Therefore, it is not recommended to apply RSI TMA Centered Bands to a period of more than two candles.
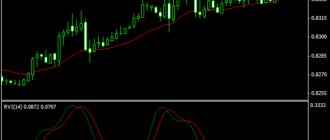
Using EMA with other indicators
As we wrote above, exponential average lines can be used in conjunction with the Stochastic indicator.
To do this, you need to plot the following indicators on the chart :
- EMA50 (blue);
- EMA13 (red);
- EMA4 (green);
- Stochastic Oscillator with levels 60 and 40, as well as values 12,9,5.
Let's look at an example of this strategy on the EUR/USD pair Н4 .
If we look below, we can see that the lines of the Stochastic indicator are significantly ahead of the signals from the EMA.
So, let's figure out when to open a sell order:
- When the green moving average crosses the blue one from top to bottom.
- Stochastic will break through level 60 from top to bottom.
- The blue EMA will be crossed from top to bottom by the red moving average.
Figure 5. EMA + Stochastic.
Stop Loss is set 50 points from the entry point. Profit taking occurs when the price goes beyond the blue moving average.
Practice of its application
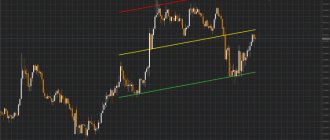
First of all, given the fact that we have a channel indicator, the direction of the channel can indicate to us the development of a particular trend, let me show you an example!
Here we see that the channel lines are directed clearly upward, what can this tell us? In this case, we conclude that we are developing an upward trend, and accordingly, our priority will be purchases. In this case, one could potentially consider buying from the lower border of the channel.
On topic – Price Channel Indicator
Of course, as I already said, you need to confirm your inputs with something additional. For example, you can additionally filter the input using some kind of oscillator. Let’s say the price has touched the lower border of the channel and the oscillator shows oversold conditions. In this case, you could safely open a corresponding buy transaction.
Entries must be confirmed, for example, with an oscillator.
Once again I tell you that none of the indicators is the grail, and this indicator is not the grail either. This is just an additional tool for technical analysis, and there is no need to assign tasks to it for which it is not designed. If you use channel trading systems, then this indicator will come in handy. Yes, it redraws, but this is a feature of this indicator.
On topic – Price channel indicator
In short, I found on the Internet a version of this indicator that does not redraw its values. To be honest, I don’t see the point in this, and now I’ll tell you why. Even if you use this version, you will see how the price breaks through the channel border, yes, the indicator will not be redrawn, but this will be of little use, since the position was set for a rebound, and the price moved on. Let's learn to conquer Forex in different ways. Construction of channels.
Look
This is why I say that touching one or another channel boundary will need to be confirmed by other technical analysis tools. In particular, a very good entry point will be the moment when the price touches one of the channel boundaries, and at the same time the channel line coincides with some level.
It’s not a bad thing if the signals from the indicator are combined with others, for example, by approaching an important horizontal level.
In my opinion, this would be a great option for opening a trade. Personally, I think that this tool can be used purely for clarity, based on its direction, but it is clearly not suitable as the main tool of the system. In any case, the effectiveness of this indicator has long been proven by the same VICTORY system, it’s just important to use a systematic approach in your trading and then success will not keep you waiting!
Previous
Forex IndicatorsStandard Vertical Volume Indicator MT4
Next
EMA+ADX+MACD strategy
To work with this TS we can use absolutely any pair with the H1 timeframe . But first, let's set the following indicators:
- EMA21;
- EMA7;
- MACD12,26,9;
- ADX14.
As an example, let’s look at how we will enter the market on the EUR/USD pair, H1 timeframe. The entry rules are as follows:
- The faster EMA7 crosses EMA21.
- The ADX 14 indicator is directed upward and is above level 25.
- The MACD indicator crosses the zero mark.
In the screenshot below we have marked the entry points numbered 1,2,3. Entry is made in accordance with all rules. It is necessary to close the trade as soon as the price crosses the EMA in the other direction.
Figure 6. EMA+ADX+MACD.
As a conclusion, we note that we talked about the exponential moving average, as well as how it can be used with other indicators. Still wondering if you need to download the EMA indicator or if it’s not worth your time? We hasten to assure you that it is definitely worth using in conjunction to filter profitable signals.
Some tips for using EMA
In order for a trading operation to be as profitable as possible and minimally risky, it is recommended to take into account a number of nuances when using this analytics tool. In particular:
- since trading is focused on short-term positions, you should not pay attention to economic news and extrapolate them to the price chart - the events simply will not have time to affect the price before the order is closed;
- It is best to conclude a deal within the first ten minutes of the hour;
- do not use large time frames - in this case the information content will be very low;
- do not trade exotic binary pairs - the optimal solution would be EUR-USD or either gold;
- it is necessary to select the time for closing transactions so that it falls at the end of the day or trading session;
- do not take risks: if there are doubts about the forecast, then it is better to wait for a more favorable moment for trading;
- watch out for fatigue: since turbo options are usually traded in a series, a series of successful transactions dulls control and attention, which is fraught with mistakes.
EMA is widely used not only as a stand-alone analytical solution, but also perfectly combined with tools such as RSI and MACD.
Exponential Moving Average is an effective and, for most experienced traders, an indispensable assistant in trend trading on the binary market. It will be an ideal option when working with both short-term and medium-term orders; it shows the greatest performance when used with 15-minute options. The EMA indicator allows you to almost accurately determine the direction and strength of the price and reduce the risks inevitable for this field of activity.