Good day, ladies and gentlemen, forex traders. Today’s video tutorial will talk about the secrets of working with the classic “Double Top/Double Bottom” graphic pattern. This pattern occurs frequently and is mentioned in many books about Forex, but few know how to trade it correctly.
Hello ladies and gentlemen traders. In this video lesson we will talk about such a graphic formation as a double bottom or double top. This pattern occurs very often. It is reversible. And in this lesson we will talk about how to enter the market when this pattern occurs. How to set stop losses and goals. How to Avoid Falling for the False Double Bottom/Double Top Pattern, What to Look For. And also the characteristics of the most adequate assessment of this pattern.
How can this pattern be interpreted?
The first peak, after which the market makes a pullback. At the moment, you cannot say for sure whether it will be a reversal, since trending markets go into correction from time to time. Second peak – the market again makes a pullback in the same area. This is the first sign that the market may go even lower. Breakout of the neckline - sellers are increasingly taking the initiative, and the market may continue to decline.
Thus, the formation of a double top signals a possible trend reversal.
Not all double top formations are quality. If you find this pattern in a strong uptrend, the market is likely to continue moving higher.
It is also very important that enough time passes between the first and second peaks and, accordingly, there is enough free space.
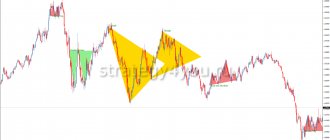
Try to look for setups such that the peaks of the peaks are located at a sufficiently large distance from each other. As in the example below.
Why is it important for the vertices to be far apart? When enough time passes between the formation of the first and second peaks, the level from which they start becomes more significant, and an increasing number of traders begin to enter sales from this level.
Trap setup double top
Consider the following graph.
At the moment, many traders will wait for the breakout of the neckline and begin to open long trades. The breakdown occurs on a large candle. But then the following happens:
Traders who were hoping for a long-term bullish trend are now trapped in a false breakout because the market has made a sharp reversal.
Now that this has happened, we have the opportunity to take advantage of this situation. How? We will open a sell position after a false breakout. If the market continues to decline, it will trigger the stop losses of traders who were long, causing the price to move even lower.
When you trade this strategy, you will likely be trading against the long-term trend. Therefore, do not be too aggressive with setting take profits. Instead, you may want to consider taking profits at a nearby level.
Entry points
Next, we will look at how to open positions and where to set a stop loss when this pattern appears on the chart. There are several ways to open a position when the Double Top and Double Bottom patterns are formed.
As an example, let’s study the possibilities of opening a position in the presence of a “Double Top” on Forex:
- The first way to enter a trade is to open a position after the price reaches the Double Top support level and trades near this level. This method is the most risky, because... a sell transaction is opened at a time when the “Double Top” itself has not yet formed. Although, as a result, we can make a profit that will be much greater than when opening a position in other ways. In this case, the stop loss is placed slightly above the high of the highest peak.
- When entering using the second method, we wait for the final formation of the graphical model and open a position after the candle that breaks through the local minimum closes below the support line. Even though in this case the entry point is much lower than in the previous example, the stop loss is also placed behind the high of the highest peak.
In the case of a Double Bottom, technical analysis uses the same methods of opening a position, only in the opposite direction.
How to enter a trade with the best combination of risk and profit?
In classic technical analysis, it is recommended to enter a trade after the price breaks the neckline and place a stop above the top level (or below the bottom level in case of a double bottom).
However, this approach has two problems. Often, after a sharp movement and breakdown of the neckline, a false breakout is formed. And also the risk-to-reward ratio with the classic stop setting is not the best.
Therefore, sometimes it is better to wait for a slight consolidation near the neckline, which is nothing more than a set of positions due to traders opening buy trades at this level. And place a stop outside the border of this consolidation.
If you enter using this strategy, use a trailing stop and try to take as many points as possible in the upcoming movement.
Setting a stop loss
Everything here is quite simple - the stop is removed behind one of the peaks, you should choose the one with a price value further along the trend. For a double top it will be a larger quote, for a double bottom it will be a smaller quote. Just in case, a small indent of a few points is made in case another round of oscillatory movement in the range is formed.
You shouldn’t move your stop too far because:
- This is not provided for by the trading strategy, and any own changes to the procedure, parameter values, and options for setting take and stop orders negatively affect the overall statistics. These patterns bring profit over a long period of observation and with the same size of positions.
- In the event of a breakdown, it is quite likely that the previously mentioned “flag” technical analysis pattern will work out, which implies an acceleration of movement after consolidation. Therefore, by moving the stop, we only increase the loss, and do not at all reduce the probability of receiving it.
How to determine market reversals with the greatest accuracy?
To determine the highest probability of a market reversal using the double top pattern, you can use the multiple time frame strategy. Here's how it works.
Determine that the market is in a downtrend. Let the price approach the nearest resistance area. Look for a double top formation on the lower time frame.
Here's an example. The price is approaching the resistance level on the 4-hour timeframe.
A double top is formed on the hourly timeframe.
What time frames to use for trading double tops
It is not advisable to use weekly charts and, especially, monthly charts for trading. Because the patterns on them will be worked out, respectively, for several weeks, months or even years. Will you wait that long? Hardly.
However, it is still worth taking a closer look at the weekly and monthly charts. They may portend global reversals and continuation of market trends.
It is also better not to take small time frames (less than an hour). They convey mainly market noise and do not reflect the real, stable situation.
There are only three timeframes left - hourly, four-hour, daily. Some terminals have others, for example two-hour ones - these will also work.
You can read more about choosing time intervals in my article about timeframe.
What is a double bottom?
The double bottom pattern is used to determine the market reversal after a downtrend. However, trading this figure has its own nuances and features.
A double bottom is a reversal pattern in a bearish trend (its opposite is called a double top).
It consists of three parts:
- The first low is the first price rebound.
- The second minimum is the second price rebound.
- The neck line is a resistance zone.
What does this pattern mean?
First Low – The market makes its first pullback in a downtrend.
The second minimum – at approximately the same place the market turns around again. We now understand that there is strong buying pressure in the market, but it is too early to say whether the downward trend will finally change direction.
Breakout of the neck line - the price breaks through the neck level, and this signals that buyers are now in complete control of the situation. The market will most likely continue its upward movement.
In short, a double bottom pattern signals that a downtrend has likely bottomed out and the price will soon begin to rise.
This is what it looks like:
On which charts can you look for double tops?
On any. Looking for patterns, trends and resistance support levels means doing technical analysis. That is, trying to predict future price movements based on the history of its fluctuations. All supporters of technical analysis believe that it can be used on charts of any financial instruments.
But here it is worth noting some subtleties. There are low-volatility financial instruments on the market that lend themselves very poorly to technical analysis. These are, for example, bonds of some companies on the stock exchange. Even if you see something similar to a double top there, it’s far from a fact that it will work.
In addition, with low volatility, gaps constantly appear, which seriously complicate trading. And they can lead to larger financial losses than you previously thought.
If you try to speculate on the market using technical analysis, carefully study the instruments you decide to trade. The general rule is that the more popular a tool is, the better it lends itself to technical analytics. For example, the Eurodollar is likely to perform better than the Turkish Lira.
Don't Make This Mistake When Trading the Double Bottom Pattern
Many traders open positions on the breakdown of the neckline after the formation of a double bottom. However, they do not pay attention to the market context. So be careful.
If the market is in a strong downtrend and forms a small double bottom, the market is likely to continue its decline.
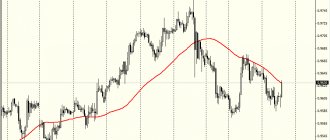
You can use an additional filter to avoid this situation:
- Add a 20-period moving average (MA) to the chart.
- If the price is below the 20 MA, do not enter the market.
Which vertices work best?
There is an opinion among traders that tops are best processed on three time frames - hourly (H1), four-hour (H4) and daily (D). Let's figure out why.
Time frames less than an hour are less suitable for technical analysis because they have a lot of “noise”. They reflect some random price jumps, the “chaos” of the market. There is also noise on hourly and daily timeframes, but it is much less.
Noise is completely absent only on the weekly chart. But during the week, rarely does anyone trade according to any patterns. Because you have to wait several weeks until the trading position is closed (with a profit or a loss). Weekly charts are looked at not by traders, but by investors who invest money in the market for the long term.
How to trade double bottom and make a profit?
If you are trading a double bottom pattern, you should pay attention to the space between the two lows - the larger this distance, the better.
Why is that?
When the lows are far enough apart, it attracts the attention of a large number of traders who open short positions and thereby become trapped.
We can take advantage of this situation:
- There must be sufficient space between the first and second minimum.
- The price must make a false breakout.
- We expect a strong price rebound and open a long trade.
As the price falls below the first low, many traders begin to short the market and place their stops just above the broken level. But if the price turns upward, the stops of these traders begin to be triggered. You can take advantage of this by going long on the double bottom pattern.
What should you pay attention to?
Let's say you had some purchases open, you saw a double top and, accordingly, decided to exit. So, how can we determine whether this pattern is of high quality or not?
Firstly, you should pay attention if there is also a support/resistance level at the level of a double bottom or double top. In this case, we have one vertex, the second and you can pay attention to the fact that there is a level nearby. And it practically overlaps our double top.
This gives extra strength to the pattern and makes it more meaningful. Secondly, there must be at least six candles between two tops. That is, the vertices should not literally follow each other.
There must be at least 6 candles between the tops. So that it visually looks like 2 peaks or troughs, and not 2 or 3 candles standing next to each other. But at the same time, keep in mind that if the second peak is very far from the first, then such a pattern is most likely not a pattern and it is just a coincidence, and most likely you will not see any strong trend reversal. A correction, perhaps, but no more. Accordingly, the further the first peak is located from the second, the weaker the pattern. Because the significance of the graphic formation is simply lost in time.
What is interesting and what many beginners fall for is that they believe that a double top, or a double bottom, is formed only if the prices are almost the same. Let's say the high here was 1.6245 and our previous high was 1.6245.
But only if in the case when the prices are completely equal, only in this case the pattern is considered correct and it is worth taking a deal. Quite the contrary, if the prices of the tops or bottoms coincide very, very much, literally almost to the point, then most likely this pattern is false. It must be a little ugly. As in the picture below, when one peak is higher than the other, or lower than the other, but they are not identical.
If the tops are identical, the price is very, very close to the values of the previous top, or the bottom of the previous one, then most likely this is a false pattern. And you won't get any serious movement. There will be a correction, but you won't see any big movements. You shouldn't count on them.
Therefore, if you see a double top or double bottom pattern and the prices of the tops or bottoms are almost identical, then it is better not to enter into such a deal, it is better not to consider such a pattern. As for the location of the peaks, or bottoms, relative to each other. If the maximum price values decrease, let’s say the first peak was at the same level, and the second peak is slightly lower, then there is a high probability that the downward movement will continue.
If we have a double bottom pattern and the second bottom is slightly higher than the first, then in this case our chances that the price will go up increase. As I already said, the further the distance between two bottoms or tops, the less likely it is that the pattern will work out strongly. There will be not some small correction, but a strong upward movement if these were bottoms or downward if these were tops.
Therefore, try to select transactions in which the second touch is, if possible, lower than the previous one. The opposite is true in the case of a double bottom.
What’s interesting is that sometimes you can come across on forums or in some articles a mention of the triple bottom , or triple top . There is nothing supernatural about this, it’s the same as a double bottom, but we have three touches. The triple bottom pattern works the same way as a double bottom. Accordingly, a triple top works in the same way as a double top. Therefore, no difficulties should arise here. But most often there is a double bottom and a double top. If you are looking for strong reversals, then pay attention to the space on the left. That is, there should be such an empty area to the left of the price and the trend should be quite strong and long-lasting.
And if a reversal actually takes place, you can catch a very, very large movement. But if the space on the left looks full, then you shouldn’t count on any strong reversal. But strong global reversals do not occur so often, so catching them is not easy in any case. Since they themselves arise quite rarely.
Reliable entry technique
The price often pulls back after breaking the neckline. However, you can see the strength of buyers in advance before entering a long position. To do this you need:
- Find a potential double bottom.
- Wait until the price starts moving up.
- See the formation of a pullback in the form of a tight consolidation.
- Open a trade when the price breaks out of the range.
This is a reliable entry technique that will give you the opportunity to enter the market with an optimal risk to reward ratio.
When there is a weak pullback that turns into a tight consolidation, it suggests there is no selling pressure. You can set a stop loss below the low of the range boundaries.
However, sometimes the price will move up without any pullbacks. What to do in this case?
Don't chase the market
When the price makes a sharp breakout of the neckline, it is not worth pursuing the market in this case. You won't have a logical place to place a stop loss, and you'll likely take a loss on the first pullback or reversal.
Instead, it is better to wait for the breakout level to be retested.
- After the breakout, we are waiting for the neck level to be retested.
- We are looking for a price action pattern on the neck line.
- Open a long position by setting a stop loss at a distance below 1 ATR from the entry point.
Sometimes the market may not test the neck level. However, a bullish flag may form instead. Another figure based on which you can enter the market.
What else to read
Read my article “Can you make money from trading”. Several years ago, when I first started learning trading, I believed that it could be turned into a source of stable income. And that in general you can “get rich” on the stock exchange game. Now I have “come to my senses” and no longer waste my time, money and nerves on trading.
I hope the arguments I present in this article will make you think twice before putting real money into your trading account.
When I was studying trading, dozens of authors on the Internet told me: “This is a waste of time.” But I didn’t believe them and continued to study. You will most likely do the same or are already doing it if you are reading this article.
I advise you to never buy paid trading courses. If you want to systematically study technical analysis and the essence of different trading instruments, take a look at all the FREE courses from my selection of trading courses. I myself have never purchased paid courses and I do not recommend them to you.
If you have money and want to increase it, invest. This is a much more reliable way. Read my article about investments, I talk there in general about how and where you can invest. The article contains many links to other materials.
If you don’t have money yet, earn money. Here are links to two good collections with courses on making money on the Internet, also collected by our authors:
- Courses on remote work.
- Courses for mothers on maternity leave.
Pay special attention to courses from two online universities: Netology and Skillbox (links lead to the main pages of the projects). They have official licenses for educational activities, they provide in-depth material, and students receive certificates of advanced training.
Regarding investments, I would also like to recommend to you the project City of Investors. Both I and Vasily Blinov (the owner of this site) read their newsletters. In the City of Investors, there are mainly paid materials, but there are also free manuals for downloading, for example these:
- How to become financially independent in 1 year - what you need to do right now in order to reach the level of financial independence in a year.
- 5 ways to effectively invest 1000+ rubles - on how to make investments, starting with small amounts. This manual is practice-oriented; the author examines real examples of investments and comments on them.
- 6 steps to financial security - what needs to be changed in life in order to feel secure financially and always be confident in the future.
Recently, another practical marathon began in the City of Investors - “How and where to invest in 2021” - you register for webinars and, in parallel with training, make real investments. Teachers will tell you how to invest money taking into account the current market situation.
I also advise you to watch recordings of free webinars on investing on the YouTube channel of Ak Bars Bank. Here is an example of one such recording, you can watch it directly from here:
View and “save”, “add to bookmarks” are not the same thing. You just need to watch it, from beginning to end.