“Flags” and “pennants” are considered to be the most reliable trend continuation patterns. A reversal of the trend on these models appears very rarely. The diagrams shown below clearly show how similar these figures are to each other. During an uptrend, there is a rapid increase in quotes combined with large trading volumes. At the moment the patterns are formed, the price rolls back somewhat with much more modest activity from traders. A consolidation phase occurs, after which volumes grow again, and quotes break out, continuing to move in the previously specified direction.
John J. Murphy in the book “Technical Analysis of Futures Markets: Theory and Practice” (see Library of the MasterForex-V Trading Academy https://dma.masterforex-v.org) characterizes these trend continuation figures as follows:
“The flag and pennant patterns mark short pauses in a dynamically developing trend. The formation of these patterns on the chart should be preceded by a steep and almost straight line of price movement. They denote markets that, in their upward or downward development, seem to outstrip themselves and therefore must stop and rest for a while before continuing to move in the same direction.”
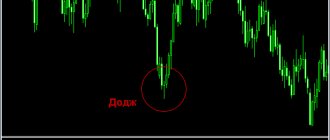
Rice.
1. Schematic representation of the bullish “flag” and trading volumes As shown in Fig. 1, after a sharp increase, the trend takes a pause. The "flag" moves prices in the opposite direction. But this happens only until the moment when a breakthrough occurs with continued growth. Typically, a “flag” appears in the middle of a trend.
Construction of the “flag” and “pennant” models
These models are almost no different from each other. The “flag” resembles a parallelogram (sometimes a rectangle) if it is limited by two parallel trend lines with a slope from the direction of movement of the prevailing trend. With a downward trend, the “flag” should be directed slightly upward, and with an upward trend, downward.
A pennant can be identified by two converging trend lines and a more horizontal position. This figure resembles a small symmetrical triangle. Both models are formed against the backdrop of a gradual significant decline in trade volume.
Rice. 2. Schematic representation of a bullish pennant
“Pennant” is also formed with low volume. After the pattern is completed, the price should travel approximately the same distance along the trend as before it appeared. Typically, prices in this model are no more than three weeks in an uptrend and two weeks in a downtrend.
And what is the result?
Please note that all recommendations regarding the pattern apply only to the “normal” market and the speculation that formed the flagpole has already passed. While the price is nervous, there is no decrease in the amplitude of movement and volumes – there is no point in looking for this model. It is not recommended to trade binary options according to the Pennant scheme, except perhaps after a clear breakdown of the border and only for short-term ones.
The Pennant figure in technical analysis, regardless of the size or trading asset, is formed and implemented quite quickly, this is especially noticeable on the M15-M30 timeframes. This is why medium- and long-term strategies usually do not pay much attention to this pattern. However, on most assets, it is precisely different Pennant patterns that appear, rather than the more stable and “correct” Flag or Triangle, and most often in the middle of a trend and in a falling market. So the skill of trading using this model will be useful to everyone.
If you have successful experience trading using the Pennant pattern, share your experience, leave feedback, we are interested in your opinion!
Methodology for measuring the “flag” and “pennant” models
The measurement methods for both models are similar. Figuratively speaking, the “flag” and “pennant” models seem to fly from the flagpole to half the length of the mast. A flagpole refers to a sharp rise or fall in prices preceding the appearance of a model. The half mast length suggests that these small trend continuation patterns typically occur around the midpoint of the move. In general, the price movement after the resumption of the trend will cover a distance equal to the length of the “flagpole” or the length of the price move that preceded the formation of the pattern.
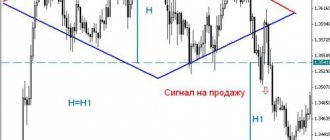
“Flags” and “pennants” are characteristic of dynamically developing markets. Pay attention to the number of these figures that appear during the growth of quotes of the euro/dollar currency pair.
Rice. 3. “Flags” and “pennants” during the upward trend of the euro/dollar pair
Description
The flag pattern in technical analysis is a popular pattern because it offers a chance to get a good starting point and profitable profit potential. The classic form of this instrument is presented in the form of a correction diagram and received an individual name precisely due to its similarity with the flag (stick and cloth). By default, they come in different types and parameters, but in each case they are presented as a standard version of trend continuation.
Characteristics
In fact, the flag consists of a flagpole (occurs during a period of a pronounced trend due to strong price correlation) and a banner (minimal change, moving along the channel between 2 levels). It is worth considering that the typical length of the flag does not exceed 1/2 the length of the flagpole. The clearest signal at the time of entry is demonstrated by patterns where the usual correction ends at 1/3 of the entire size of the flagpole. So the figure in question is ready when the price breaks the level and goes in the direction of the main trend movement.
Reasons for formation
The flag represents the process of consolidation: the typical trend periodically slows down to eliminate short-lived traders and attract new participants to the exchange.
The nature of generation can be described in this way using any method:
- before the change, the market performs a “sigh”;
- unnecessary participants are removed;
- an attempt to confuse novice and ignorant traders;
- deliberate goal to misdirect assets;
- checking the cost to determine whether there is interest.
Suspension of momentum and adjustment are triggered either by traders fixing financial gains at a specified level, or by the participation of larger players in any stage of the trade in order to gain positions.
Conclusions: the most important features inherent in the “flag” and “pennant” models
- The appearance of such patterns is preceded by a sharp price movement in the form of an almost straight line, accompanied by a significant trading volume.
- Then there is a pause, and with a small volume, prices remain at approximately the same level for one to three weeks.
- The trend resumes with a sharp increase in trading activity.
- Both patterns form approximately in the middle of the price movement.
- The pennant has a shape similar to a small horizontal symmetrical triangle.
- The “flag” resembles a small parallelogram, located at an angle from the direction of movement of the dominant trend.
- These patterns form faster during a downward trend.
- Both patterns appear very often in the futures markets.
Forex trading examples
You can take note of 4 diagrams on how to correctly apply the flag pattern on Forex (2 concerns the bullish version, and 2 concerns the bearish counterpart).
An example of flag processing on USDCAD
The USD/CAD pair on Forex is an example in the European session, when there was a jump up, and then a correction began. Having marked the max and min of the correctional channel, there is a downward option - a bullish flag figure, after which you should wait for the pattern to break out. It is necessary to place a stop below the local border of the channel and find out the distance traveled to take profit.
Example on USDJPY
Japanese dollar and yen pair: the figure is more crooked. According to the basics of flag pattern construction, the impulse is a flagpole. A channel is being formed. After 2-3 touches of the channel, the bearish candle exits and closes below the pattern. StopLoss is set above max, TakeProfit is equal to the flagpole.
Example on EURUSD
This is where the bullish counterpart comes into play. Having overcome consolidation, the price dropped slightly. Throughout the entire session in Asia, it changes in the other direction, provoking the formation of a downward channel. As soon as the pattern breaks upward, a purchase can be opened immediately, the stop can be placed below the low of the flag, and the take is again equal to the flagpole.
Wedge model
John J. Murphy wrote:
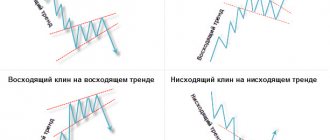
“In terms of shape and duration of formation, the wedge model resembles a symmetrical triangle. Similar to the symmetrical triangle pattern, the wedge is easily recognized by the two trend lines converging at its apex. The wedge usually forms within one to three months, which allows it to be called an intermediate type model.
The wedge model has a significant slope - up or down. Typically, like a flag, the wedge is angled against the direction of the prevailing trend. Thus, a wedge pointing downward is considered a bullish pattern, and a wedge pointing upward is considered a bearish pattern.”
In Fig. Figure 4 shows that the bullish “wedge” is formed with a downward slope and is located between two converging trend lines.
Rice. 4. “Wedge” during an upward trend
In Fig. Figure 5 shows a bearish “wedge” in which the trend lines converge with an upward slope.
Rice. 5. “Wedge” with a downward trend
Rice. 6. “Wedge”, “pennant” and “flag” on the chart of the energy futures price index of Vietnam
In Fig. 6 we see four different models:
- the first (top left) is “rectangular consolidation” with an upward trend;
- the second pattern (August-September) is a bearish “wedge” directed upward;
- third (October and November) - bearish “pennant”;
- the fourth (November-December) represents a “flag” pointing upward.
Rice.
7. “Wedge” and “flag” on the chart of fuel oil quotes In Fig. Figure 7 shows a clear example of a “wedge” pointing upward. In this case, the model reflects the recovery in the market for fuel oil contracts from October to November. The trend lines converge and are directed upward. The price recovery that took place at the end of November and the beginning of December resembles a rising flag. Please note the similarity of this graph with the NRV energy price index graph in the previous example.
Why is the flag shape formed?
First of all, the flag represents consolidation. A healthy trend stops from time to time to get rid of short-term traders and accumulate new buyers or sellers.
When there is a pullback or consolidation in a trend, some traders take their profits. It is at this moment that we should be on high alert to look for an entry point for a breakout. This allows us to enter the market with the trend and place a stop loss.
Notice how each subsequent flag is formed at a steeper angle. This is a sign of a healthy pullback that should lead to a continuation of the current trend.
“Wedges” as trend reversal patterns at the top and bottom of the market
John J. Murphy wrote:
“Wedges most often form during the development of an existing trend and, as a rule, are patterns of trend continuation. They can also form at the top or bottom of the market, signaling an imminent trend reversal. However, this happens very rarely. A clearly defined upward wedge can sometimes be seen at the last stage of an upward trend. Typically, a wedge is a trend continuation pattern.
Regardless of where this pattern is formed - in the middle or at the end of the price movement segment - you must always be guided by the rule that an upward wedge is a bearish pattern, and a downward wedge is a bullish one.
As a rule, such a pattern manages to travel two-thirds of the distance to its top before breaking out, and sometimes even reaches it (the ability to go all the way to the top also distinguishes it from a symmetrical triangle).”
Jack Schwager on the wedge, flag and pennant models
D. Schwager in the book “Technical Analysis. Full course" (see Library of the MasterForex-V Trading Academy - https://dma.masterforex-v.org) made an important addition, named the criterion for the truth of the "flag" and "pennant" models as trend CONTINUATION figures - their formation OUTSIDE of the trading range (flat).
Rice. 8. “Flag” after a long trading range
Rice. 9. The “flag” pattern after breaking through the trading range in a downward trend
Methods for calculating further moves based on a pattern
Let's look at take profit . It is defined in the same way and is located at the extreme point of the second impulse of the flag figure. To build it, you need to measure the distance of the first flagpole with a crosshair and place it upward from the 3rd price range mark. This is exactly how the potential extremum of Scheme 6 is assumed - the complete completion of the formation.
Although the pattern is worked out at the extreme of the second impulse, the price may reverse or go even further along the trend.
D. Schwager on opening trades with the “flag” and “pennant” models
D. Schwager recognizes these models as trend continuation figures and indicates the points for opening transactions on them as during a rollback:
“A break of a flag or pennant boundary can be seen as confirmation that the trend is continuing and as a signal to trade in the direction of the trend. However, since breakouts usually occur in the direction of the main trend, I prefer to open positions during the formation of a flag or pennant, without waiting for its breakout. This approach provides more favorable conditions for entering the market, without significantly deteriorating the percentage of profitable transactions.”
Rice. 10. “Flags” and “pennant” as trend continuation figures
Rice.
11. The point of opening trades when the “flag” appears is in the direction against the trend D. Schwager also writes:
“Reversals (!) after breakouts of flags and pennants occur almost as often (!) as breakouts in the direction opposite to the expected one. After a breakout from a flag or pennant, the low point of the pattern (in the case of a growing trend) can be used as an indicative protective stop.
A significant breakout beyond the flag or pennant in the direction opposite to that expected, i.e., against the underlying trend, may be considered a signal of a potential trend reversal.”
Please note that after a long series of these patterns (Figure 11), ending with a continuation of the main downward trend, the exit from the last “flag” led to a breakdown of the upper boundary and a rise in prices.
Rice. 12. False signals from trend continuation patterns lead to a breakout in the expected direction, followed by a reversal
Rice. 13. Breakout of “flags” in the direction opposite to the expected one leads to a reversal in the direction of price movement
What is the shape of a flag?
Flags can come in different shapes and sizes, but they all represent a continuation of a current trend. If the market is moving up and a flag is forming, it is likely to break out soon. The opposite applies to a downtrend.
The flag pattern is one of my favorite technical analysis models, because it provides an opportunity to get a profitable entry point and good profit potential.
The most profitable bull or bear flags form in a strong trending market, where buyers or sellers begin to take profits. This causes the price to temporarily move against the general trend, allowing new participants to enter the market.
Bullish flag
Bear flag
Eric Nyman on trade entry points
Eric Nyman , like Murphy, calls the “flag”, “wedge” and “pennant” patterns of CONTINUATION of a trend.
Rice. 14. Trend continuation patterns on E. Nyman’s diagram
Rice. 15. “Wedges” on the diagram by E. Nyman
E. Naiman suggests looking for opening points for transactions in accordance with the strength of the signal. At the same time, he evaluates “flag” and “wedge” as good positions for opening buy or sell orders after breaking through resistance or support lines along the main trend.
Rice. 16. Points for opening transactions with the “flag” model by E. Nyman Fig. 17. Point of opening trades with the bullish “wedge” model by E. Nyman Fig. 18. Point of opening trades with the bearish “wedge” model by E. Nyman
Bear flag in trading
A bear flag is formed from a downtrend and a short-term series of higher highs and higher lows.
Long bodies of falling candles with small shadows indicate the dominance of bears in the market. A small failure reflects profit taking by traders with a short-term trading strategy. After which the trend confidently continues to move downwards.
The best moment to enter a bearish flag trade occurs when 2 conditions are met:
- The rate moves next to the Moving Average with a period of 20,
- The candle closed, breaking through the low of the flag.
Notes from MasterForex-V Trading Academy
The MasterForex-V Trading Academy expresses several serious criticisms regarding the conclusions of the classics of technical analysis regarding the pennant, flag and wedge patterns:
For some reason, John J. Murphy
In part, he wrote: “The models are relatively short-lived and are completed within one to three weeks. When prices tend to fall, they require even less (!) time to form, and in this case, the duration of their existence often does not exceed one or two weeks.”
What should a trader do all this time?
Question for the trader : do you think this approach is correct (distributing the “flag”, “wedge” and “pennant” patterns only to large time frames, as well as indicating the exact periods of existence of these patterns)?
Or the conclusion from the MasterForex-V trading system : the essence of these models is ONE. Regardless of the time interval of the chart (m5, n1, d1), the CONTINUATION figure of the trend of this time frame will be recorded on the chart. Or will a reversal pattern appear when the starting point of the “flag”, “pennant” or “wedge” is broken through and additional conditions are met?
- John J. Murphy, Eric Nyman and others consider volume as confirmation of the truth of trend continuation patterns.
Question : what is the confirmation criterion in the Forex market, where the volume of transactions cannot be traced? - Does John J. Murphy's that increasing volume is significantly more important in confirming an upside breakout than a downside breakout apply to Forex?
Or another statement that when prices tend to fall, they take even less time to form? - D. Schwager, unlike Murphy, he is a real trader and manager of a large investment fund. And yet he claims that
“reversals (!) after breakouts of flags and pennants occur almost as often (!) as breakouts in the direction opposite to the expected.”
Based on all this:
- evaluate the works of the classics of technical analysis, which consider the “flag” and “pennant” models as figures of continuation of the existing trend;
read Schwager's main criterion again about the difference between true and false breakouts of the "flag" and "pennant" levels (OUTSIDE the range) and see that the REVERSAL "flags" and "pennants" were also outside the trading range or within a WIDE range of larger timeframes.
- D. Schwager also did not point out that not every breakout in the opposite direction of the current trend is a reversal of this trend.
Question : what criterion should be added to what D. Schwager indicated in the book “Technical Analysis. Full course?
On real charts you can find many examples when a breakout in the opposite direction was FALSE. After this, the previous trend continued.
Rice. 19. False breakout on the M5 chart of the GBP/USD pair
Rice. 20. False breakout on the H1 chart of the GBP/USD pair
Rice. 21. False breakout on the M15 chart of the GBP/USD pair
Rice. 22. Acceleration in a bearish trend. USD/CHF pair
What then is the criterion for the truth of breaking through the opposite level and what is the difference between a true (real) reversal and a false one?
Note : we find such graphs in the books of E. Nayman . D. Schwager gives similar examples : false breakouts in both directions that do not turn into a new trend.
Determine what is methodologically incorrect in the following picture by Eric Nyman ? What is NOT important for Naiman, but should be VERY important for a trader?
Rice. 23. Scheme by E. Nyman
Try to complete this drawing by E. Nyman. Wherein:
- Correct mistakes;
- indicate at least 4 options for price movement instead of one, which was noted by E. Naiman, as well as the points for opening transactions in each of the options.
As noted in the materials of the MasterForex-V Trading Academy, if this is not done, beginners will place pending orders at point “A”, as Naiman advises, and ask during trading: why are they minus?
Trading the pennant pattern
So, let's look at the trading method of this graphic pattern itself.
- First and most important: we trade only in the direction in which the market was moving before the formation of the pattern . This, in principle, already follows from the name of the group to which the pennant belongs - trend continuation, but just in case, we still pay attention.
- After we have formed the first 3 waves of correction, we draw forming lines through their corresponding extrema. Now we have conditional boundaries, crossing which can be considered as a signal to enter. But in trading, only one direction is suitable - following the trend.
- If there is a breakdown of the opposite line, then we skip the entry, since this is a movement within the framework of a correction, a separate case, which we will consider in detail later.
The entry point can be different levels:
- some enter immediately after the triangle is broken out. This is quite risky as it could continue.
- the second option is to enter the breakout of the high/low of the triangle. It's fairly reliable, but misses a lot of the movement.
- the best option is to return the price to retest the border and then revert to a finally confirmed trend. However, this does not happen very often, so the entry can be divided into several parts: from the very moment of breaking through and then gradually increasing the position.
The stop loss is set beyond the opposite border, or beyond the extremum of the first wave in it. In general, if the movement suddenly began to clearly develop in the opposite direction, then. There is probably no point in waiting for it to take the stop. The pennant pattern usually works out well, so if something goes wrong, the likelihood of a favorable outcome is greatly reduced.
As for the take, everything is a little more complicated. You can use the well-known principle regarding the equality of movement before the pattern and after the pattern. This is a “pole” that is also used in the “flag” pattern. However, this is a rather large movement for the supposed last one within the trend. So we focus on 60-80% of it and at the first signs of a reversal we take profit. You can use several orders and fix them partially as the price moves in our direction. There is also an option with a trawl; here the trader himself needs to decide.
I also recommend reading:
InstaForex – Forex broker review 2021. Bonus $1000 (no deposit)
Broker Instaforex has been on the market for more than 12 years and during this time has managed to enter the category of heavyweights. The company's clients […]
Algori, pennant, wedge in the new technical analysis of Masterforex-V.
The main disadvantage of traditional technical analysis of the forex and stock market is that the classics of trading give already FORMED figures and the trader is surprised to discover in the history of the terminal that
- There was already a “bearish wedge” or “bullish pennant” pattern and he missed the buy or sell trade;
- the figure worked completely WRONG. as described by Murphy, Schwager, Demark or Nyman.
And to whom will you make a claim in this regard? To them or to the market? Believe me, they don't care. A typical example of the 5th wave on a “bullish wedge” and this pattern turns into a “Head and Shoulders” reversal pattern (the new figure is drawn in green, the “wedge” pattern from the book by John J. Murphy is drawn in black
Or the “bull flag” from Eric Nyman’s book “The Trader’s Little Encyclopedia” turns... into a “Double Top” reversal pattern.
Under what conditions of the Masterforex-V algorithm would the “bullish pennant” and “bull flag” models work? Did you guess it? That's right: if a bullish wave quickly breaks through a strong level of order accumulation, consolidates ABOVE it and goes further, fulfilling the goals to the next strong level of orders that we give to students of the MF Academy every day.
Looking at our “flag” and “pennant” patterns, have you guessed under what MANDATORY conditions these patterns will be “trend continuation patterns”, and when they will be “trend reversal”? That's right, it is not the listed geometric patterns that are important, but the resistance and support levels of the MF. If the top of a bull flag, bull pennant, or bull wedge
- has hit a strong resistance level, there is a high probability of a trend reversal or, at a minimum, a continuation of the correction to the bullish trend on the older TF;
- if a strong level of order accumulation is UNDER the “flag”, “wedge” or “pennant”, the trend is likely to continue. With this option (to the delight of Nyman, Murphy and Schwager), the “flag”, “wedge” and “pennant” will fully confirm the conclusion about them as trend CONTINUATION models.
Another example of how knowledge of strong MF levels helped not to open a buy deal when the bullish flag was broken on h4 for XRPUSD
Tips on Masterforex-V TS
- do not open trades on the first break of the inclined level of any pattern from a “bullish pennant” to a “bearish flag”;
- you need to consolidate ABOVE / or UNDER a strong level + break through the peak + support from allies... and at least 1-2 more signals from 30 proprietary Masterforex-V instruments, the intersection of which gives a strong signal online, and not on the trading history, where the whole world, on the advice of Murphy, Schwager and Nyman, is looking for “bearish pennants” or “bullish flags”.
Practical examples of the pattern
Trend correction according to the Pennant scheme is not always clearly displayed. What does it mean?
This graphic pattern is significantly weaker than the more classic Flag pattern. You can assess the likelihood of the model working out by the accumulation of trading interest at the breakout point, but if the Pennant has an inclination in the direction of the current trend, then such signals become even more unreliable.
The most effective strategy for Pennant is the classic breakout of boundaries. We are waiting for a breakthrough, fixation of the bar behind the key zone (the retest strengthens the signal) and open a trade in the direction of the breakout. Those who are ready for aggressive trading can place a BuyStop/SellStop pending order behind the key line of the model. You can even place a bunch of layaways in both directions, because the chances of the Pennant being realized using the “Reversal Wedge” scheme are quite real.
The flagpole is rarely worked out completely and the problem of correct TakeProfit arises. You need to use ordinary trading logic and consider targets at Fibo levels, in the zone of round levels, local Forex extremes or according to money management.
A classically correct pattern on a chart is rare; a shortened version appears more often: the first impulse, a rollback of 30-45% and the trend continues. We remind you: the trading targets of the model are calculated from the breakout point, and not from the beginning of the formation of the Pennant. The minimum TakeProfit is obtained at the level of the pattern height (or better yet, the height of the flagpole) at the breakout point, the next one is at the height of 50-70% of the flagpole. If a strong price level falls within the range of the flagpole, then it is recommended to use the “shortened” option - from this level to the max/min of the entire model.