To successfully trade Forex, you need to independently develop or find a profitable strategy on the Internet. However, almost all strategies carry certain risks, so every trader tries to minimize them and create the so-called Grail - a trading system that brings only profit. Despite numerous attempts to develop such a strategy, the Grail was created many years ago and has been successfully used by various hedge funds, insurance companies and large banks. Until recently, this method was kept secret, but with the advent of the Internet it became available to the masses. This method is called “pairs trading” and it consists of simultaneous trading of pairs of correlated trading instruments, which are usually stocks, indices, futures contracts and options, but currency pairs can also be used. See also what brokers there are that offer CFD trading.
What is pairs trading?
Pairs trading is a strategy that allows you to minimize risks through multidirectional trading of two codependent assets. Two currency pairs are selected, the movement of which coincides in direction at each moment in time, after which transactions are opened on them in opposite directions . Since pairs cannot move in the same way with one hundred percent coincidence, some discrepancy arises between them: one has gone up, but the second has not yet. But since the similarity in their movements does not go away, over time this discrepancy will tend to decrease. And due to this, these currency pairs will converge to a certain equilibrium point. And by using this attempt to balance out their similarity, pairs trading works.
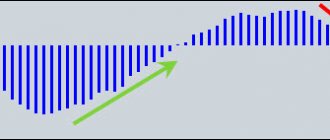
An example of co-directional movement of two currency instruments.
In the figure above you can see how the charts of two dependent assets change over time. You can notice that for some time they move almost the same. This movement is called correlation. This dependence of movement is determined by both economic factors and the trading psychology of market participants.
Introduction to Arbitration
Forex arbitrage is several interconnected trading operations in order to profit from the difference in the price of one or more instruments. Arbitrage appeared on the Forex market at the end of the twentieth century, before which it flourished on commodity exchanges.
Arbitrage trading is considered risk-free trading all over the world, and therefore it is worth learning a little more about this type of earnings on Forex.
Typically, the target for arbitrage trading is the inefficiency of supplying quotes in any of their manifestations. Arbitration cases last up to several seconds and during this time it is necessary to have time to complete more than one trading operation.
Using correlation in pairs trading
Correlation or dependence varies within a range of -1 to 1. A correlation level between -0.5 and 0.5 is low and not suitable for trading use . Anything outside this range can be used. Naturally, the further the correlation coefficient moves from the range between -0.5 and 0.5, the more effective trading will be.
Direct correlation between GBP/USD and AUD/USD.
As you can see in the figure above, the charts of the GBP/USD and AUD/USD pairs move almost the same. These graphs are similar, but not identical, and this is due to the fact that the correlation between them is +0.81. These assets are very suitable for a pairs trading strategy.
Inverse (mirror) correlation between AUD/USD and USD/CAD.
The same can be said about the currency pairs in the figure above, where you can see the inverse correlation between AUD/USD and USD/CAD. From the picture it also becomes clear why it is called mirrored. The correlation coefficient between these assets is -0.74.
You can also select any other currency pairs for use in pairs trading. The choice depends purely on personal preference. Once you select the assets suitable for trading, all that remains to be done is to calculate the correlation coefficient. This can be done even without using specific tools. To do this you need:
- upload quotes from the terminal to an Excel file for each pair as shown in the figure below;
Export archive of quotes.
- then form columns from the resulting data: date, time, opening, maximum, minimum, closing, volume;
- after that, copy the last 50-300 periods (rows) from the closing column of each currency and place them side by side in two columns in a new Excel file;
- At the bottom, under the columns, you need to add a function to calculate the correlation “=CORREL (array1; array2)”, where array 1 will be the entire first column of quotes, and array 2 will be the entire second column.
By taking the above steps, you can obtain the correlation coefficient. If it falls within the range we need, then we will be able to use the selected pair of assets.
What is the essence of the strategy?
The pairs trading strategy is based on correlation—the relationship between two currencies, stocks, commodities, etc. We mean those assets that are tied to each other directly or indirectly. For example, oil, shares of oil refining companies and refined petroleum products.
In most cases, these goods rise or fall in price at the same time - the graphs repeat each other. But sometimes situations occur in which the trend diverges for some short-term(!) time. For example, the price of oil rises, and the shares of a processing company fall. The situation will definitely stabilize soon, but first we will take advantage of the situation.
Spread and its function in pairs trading
In order for us to start trading, we need to create a spread chart for the asset pair we have chosen. Pairs trading begins with spread analysis. It is immediately necessary to clarify the following point - the spread of a pair is the difference between the Bid prices of each currency quote. Thus, this spread will be the main trading instrument. Since the currency pairs we have chosen move unidirectionally, the difference between them will be conditionally constant. And if a divergence begins in the movement, then subsequently the pairs will try to return to their standard range.
Two charts of correlating pairs on one field GBP/USD and AUD/USD.
The figure above shows a graph of a correlating pair on top of the main one. This is done using the OverLayChart for MT4, which can be downloaded at the bottom of the page for free. As we can see from the figure, on segment A the spread remains relatively constant, since the charts move almost synchronously. The gap between segments A and B shows the beginning of desynchronization in movement, which becomes obvious in segment B, i.e. in section B the spread widens. This is precisely the signal to make a deal. In this case, we need to buy the spread - buy GBP/USD and sell AUD/USD. Otherwise, we will sell the spread - sell GBP/USD and buy AUD/USD. The main question remains unresolved: how to understand when a spread is bought and when it is sold?
Advantages and disadvantages
Advantages:
- Pairs trading is suitable for those who know from experience how to analyze indicators. Here you don’t need to think about the direction of movement of the value of any one asset;
- if you choose the right financial instruments and build a chart, the results will be impressive and quite stable;
- For experienced traders, this is one of the easiest ways to make money.
Disadvantages of pairs trading:
- difficulty in dealing with risks;
- manually searching for correlated pairs takes a lot of time.
Indicators for pairs trading
The indicator of the second chart (OverLayChart) already helps to see such moments when the divergence in correlating currency pairs becomes maximum or clearly expressed. Using this indicator alone, it is difficult to determine the moment when the divergence reached its maximum. To determine this point, we will be helped by the delta of the spread of a currency pair - the difference between the current bids of the currency pairs participating in trading. Using delta will help calculate the maximum deviation from the normal state of the spread.
First we need to build a graph. You can build it in Excel, we know how to export quotes by subtracting AUD/USD prices from GBP/USD. For more effective pairs trading, it would be best to build it right in the terminal window. To do this, we can use the second indicator from our archive, which can be easily downloaded for free from the link below.
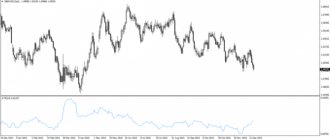
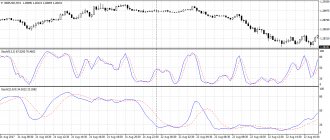
Spread delta for GBP/USD and AUD/USD pairs.
In this picture you can see the indicator window under the price chart; the red line is the delta of GBP/USD and AUD/USD. It will serve as a base for us to receive a signal. All pair trading is based on the analysis of delta behavior.
To receive a signal, we need to mark the average state and boundaries, entering which chart will give us a signal to buy or sell the spread. This can be achieved manually or using an indicator. For ease of use, you can connect the Bollinger Band indicator - it shows the average value and the maximum deviation from it well. All we have to do after connecting it is to set up a period that best suits the selected currency pairs for pair trading.
To connect the indicator you need to take the following steps:
- Move the Bollinger Bands indicator to the chart.
- Select the “Previous Indicator's Data” item in the “Apply to:” selection menu.
Adding the BB indicator to the GBP/USD and AUD/USD delta chart.
After adding the indicator to the GBP/USD and AUD/USD delta chart, you will be able to see the signals that its exit beyond the Bollinger Band gives us.
Signals for opening a trade on the GBP/USD and AUD/USD spread.
This figure shows signals for entering the market. You can see that when buying a spread using signal 1 (Buy GBP/USD, Sell AUD/USD), you can make a profit until the delta chart crosses the middle line of the Bollinger Band. If you wait longer, the profit will accordingly increase. At point 2, the signal will be reversed and it will be necessary to reverse trades based on the spread, i.e. close old ones to buy and open new ones to sell the spread (Sell GBP/USD, Buy AUD/USD). As you can see, the delta chart did not go below the middle line of the Bollinger Band. If you close trades in the middle, you can get a good profit on AUD/USD and a small loss on GBP/USD. This is a normal situation for pairs trading. Further, at the point of the third signal, you can again sell the spread and reverse or close transactions using signal 4. This will work in the same way on other pairs.
Arbitration Advisor
Due to the fact that cases where arbitrage trading is possible do not happen very often, and the lifetime of such a case ranges from a few fractions of a second to several seconds, effective trading requires automation and here we need not simple robots, but high-frequency robots (HFT) ), which could open and close a trade literally in an instant.
Agree that such a speed of opening and closing transactions is beyond the power of an unarmed trader.
The principle of operation of the robot advisor is quite simple: analysis of currency pairs specified in the settings, as well as search for arbitrage cases and direct trading of these cases.
At first glance, everything is as simple as shelling pears, but don’t rush to conclusions. To carry out such trading, you need not just an excellent connection to the DC server, but simply an ideal one, so that the advisor can open and close a lot of transactions in a few seconds.
Ratio of transaction volumes in pairs trading
It should be remembered that in addition to currency pairs with direct (positive correlation), there are also pairs with reverse (negative, mirror) correlation. Pairs with direct correlation most often refer to direct (dollar in second place in the pair) quotes of major currencies, where the cost of a standard 100,000 lot will be equal to $10 and therefore the same volume on these pairs will give the same pip value. Pairs with inverse correlation most often refer to inverse quotes and the cost of points for the same transaction volume will vary. For example, pairs with an inverse correlation of GBP/USD and USD/CAD will have a pip value for a standard lot of 100,000 currency units of $10 and $7.90 (with a market price of USD/CAD = 1.2659). Thus, if we want to have approximately equal pip value, we must open a larger USD/CAD trade. To do this, it is necessary to calculate this volume. It will look like this:
USD/CAD trade volume = (GBP/USD pip value : USD/CAD pip value) * GBP/USD trade volume,
Transaction volume USD/CAD = (10: 7.90) * 100,000 = 126,582.
Pairs trading is useful for a hedging strategy and therefore it is necessary to use the correct volume ratio to offset the loss on any of the currency pairs if necessary.
Yes, no matter how it is! Arbitration nerds!
Locking a Forex transaction only makes sense if it is done on one currency pair, then yes. You don’t earn anything, but you don’t lose anything (read more about locking here and here). Two different currency pairs are subject to their own laws, so for example, for the euro-dollar, news on the EU will be more important than for the pound-dollar. And the Bank of England news most likely may not affect the eur usd, but will greatly affect the GBP USD exchange rate. Imagine a situation in which you supposedly found a peak of negative correlation and at this moment or later news comes out that affects only one of the instruments. And the quotes, like a powerful news shot, will begin to eat up all your profits, when the Forex pairs return to a positive correlation; their distance from each other can be so great that you will wait for years for the banal conclusion of this “pseudo locking” to at least breakeven.
Of course, I searched the Internet for solutions to this issue. Some suggest using stop orders, others analyze the news. But the first or second option will not be of any use to them. The first is because they will be quite frequent, and checking the optimal value of an order’s stops is very problematic even on history. The second one is complete nonsense, you can open a deal today, and the news will come out tomorrow, if you want to filter them too, then the rules of the Forex strategy will not allow you to open a single deal. Well, I would really like to add one more minus to the arbitrage strategy - well, the appearance of signals is too rare.
There is only one correct solution to this issue: stop lying that it does not require technical analysis and start looking for working patterns of turning points, without even thinking about putting “simple and convenient” ones there! forex indicators. Unfortunately, automating such strategies so that it can be checked in a tester is quite problematic and this becomes a big stumbling block for those who are used to carefully checking analysis systems before using them in practice. whether you should use arbitrage strategies on Forex , but my personal opinion is that there are no such systems yet that would be worthy of the attention of a modern speculator. But this is exactly that rare moment in Forex when you can develop something new. Now let's move on to what actually works on the stock exchange .
Let's summarize the pairs trading strategy
Pairs trading is a very good alternative to riskier strategies. It makes it possible to minimize risks in the event of unpredictable price changes and is well suited for hedging. It is worth noting that pairs trading itself is not the magic formula with which income becomes guaranteed - this is the Forex market and it can sometimes be unpredictable. Therefore, when using a strategy, you must always take into account risks and monitor losses.
To download the file and continue studying, you must log in or register.
Login Register
Market-neutral strategies
The neutrality of the strategy in relation to the market means that the profitability of the strategy does not directly depend on the direction of the price movement of an individual instrument. This is achieved by creating a hedging position between two or more instruments, the profits and losses of which offset each other.
One of the main characteristics of such a strategy is minimal risk, since we exploit low-level market dependencies. Such strategies, for example, include market making and arbitrage. However, unlike classical arbitrage, statistical arbitrage does not imply obtaining risk-free profits.
In the context of statistical arbitrage, the main task is to create a market-neutral portfolio. To achieve the effect of neutrality, the portfolio must consist of highly dependent instruments, roughly speaking, so that the growth of one compensates for the decline of the other. That is, we must create a kind of closed system where funds are redistributed between portfolio instruments. Pairs trading is a special case of statistical arbitrage and the most popular strategy of this kind.
Frequently asked questions about Forex
✅ Are there tools with “eternal” correlation?
No, this parameter is constantly changing
✅ What capital is needed for pairs trading?
Considering the low trading frequency, we recommend more capital
✅ Do I need to open accounts with different brokers for pairs trading?
No, you can trade with one broker on one account
✅ How to determine the threshold spread for opening transactions?
Only experimentally.
Study history for 2-3 months February 26 at 15:13
Open a free demo account, see all quotes online and learn to earn money. When you open an account, you get a bonus of 3,000 rubles!
Open a Demo account and see all quotes online! When opening an account - a bonus of 3000 rubles!
| Article rating: Pairs trading on Forex, building a market-neutral strategy4 | Rated by people: 4 |