Hello, fellow Forex traders!
Almost each of us, at the stage of the first currency speculation, biasedly observes changes in the exchange rate of Forex currency pairs. Beginners cannot get rid of the concepts of “too expensive” or “too cheap”. As you know, the market does not accept such formulations; trends can last for years, constantly forming new highs or lows.
In such difficult conditions, a trader needs a tool that can help analyze the market, providing a certain advantage when opening transactions. One of these tools is oscillators, which probably everyone has heard of. Today we will look at what oscillators are, how to interpret their signals during trading, and also look at the strengths and weaknesses of this type of indicator.
Content
- Leading Oscillators in Binary Options Trading
- Oscillator RSI (Relative Strength Index) – relative strength index
- Oscillator Stochastic – Stochastic
- Oscillator CCI (Commodity Channel Index) – commodity channel index
- Moving Average Oscillator or Moving Average
- Oscillator Bollinger Bands or Bollinger Bands
- Oscillator MACD (Moving Average Convergence Divergence) or Moving Average Convergence/Divergence
- Using Oscillators to Determine Divergence or Convergence
- Using Oscillators to Determine Overbought and Oversold Zones
- Oscillator zero level crossing
- Intersection of oscillator lines
- Strategy based on RSI and Bollinger Bands oscillators
- Strategy for binary options based on the RSI oscillator – 95-5
- Strategy based on three RSI oscillators
- Strategy “Intersection of moving averages and MACD”
- Strategy for catching reversals based on the RSI oscillator and Bollinger Bands
Leading Oscillators in Binary Options Trading
Leading oscillators indicate a price reversal or the beginning of a new trend even before the signal itself appears on the market - i.e.
they are ahead of the price, and this can be used very profitably in trading. The most common leading indicators are:
- RSI (Relative Strength Index) – relative strength index
- Stochastic - Stochastic
- CCI (Commodity Channel Index) – commodity channel index
Oscillator RSI (Relative Strength Index) – relative strength index
The RSI oscillator or relative strength index indicates the state of the market - 95% of the time the market is at rest, the remaining 5% is imbalanced. To identify this imbalance, the indicator, on the reading scale, has levels “30” and “70”. If the RSI indicator line goes beyond the “30” level, then the asset price is considered to be oversold. If the line goes beyond the “70” level, then the asset is said to be overbought. In both cases, we should expect a possible price reversal:
The Relative Strength Index Oscillator can work both during sideways movements and during trend movements.
During a flat, the RSI indicator shows significantly better results, since the price moves within a certain price range, and all movements are reduced to simple “up” and “down” from the channel boundaries. In trending price movements, oscillators (including RSI) may give false signals - they will still indicate overbought and oversold zones, but a price reversal may follow much later than the trader expects:
Oscillator Stochastic – Stochastic
The Stochastic Oscillator is another leading indicator that indicates the rate of change or momentum in price.
Like RSI, Stochastic can predict reversal points and trend continuation points. The indicator has a scale with levels “20” and “80” - these are overbought and oversold zones. Unlike the RSI indicator, the stochastic has two lines - fast and slow. The intersection of these lines allows you to quickly determine price turning points. The most valuable are considered to be intersections beyond the levels “20” and “80”. The Stochastic oscillator performs well in sideways movements and very poorly in a trend:
Personally, this indicator does not inspire confidence in me. The problem, most likely, is a personal dislike for this oscillator - I don’t like its signals because they are “blurred” and inaccurate. On the other hand, many traders understand this indicator perfectly and make serious money from its signals. So, it's a matter of taste.
Oscillator CCI (Commodity Channel Index) – commodity channel index
The CCI (Commodity Channel Index) oscillator or commodity channel index is another interesting indicator that looks like RSI, but shows completely different data.
CCI indicates strong trend impulses, as well as the end of these impulses. The Commodity Channel Index has a scale with levels of “100” and “-100” - if the oscillator line goes beyond these levels, then there is a strong trend impulse in the market. The CCI indicator does not indicate price turning points, unlike the RSI. If the price, having been beyond the “100” and “-100” levels, returns to the “usual range”, then these signals can also be considered for opening buy or sell transactions:
The CCI oscillator is beneficial to use in trending price movements, and in sideways movements, the indicator will give many false signals, since trend impulses will quickly fade. In a trend, it is best to look for entry points in the direction of the main movement - the commodity channel index copes with this task perfectly.
Lagging oscillators in trading
Lagging oscillators are indicators that follow price.
Simply put, the price changes first, and only then the indicator indicates the presence of a trend - you won’t be able to catch the very beginning of the movement, but these indicators will indicate changes in the market with high accuracy. Delayed oscillators include:
- Moving Average or moving average
- Bollinger Bands or Bollinger Bands
- MACD (Moving Average Convergence Divergence) or Moving Average Convergence/Divergence
Moving Average Oscillator or Moving Average
The Moving Average oscillator or moving average is a lagging indicator. MA shows the average price value for a certain period, which is set in the settings, and the longer this period, the longer the indicator line reacts to price changes. All trend movements will be shown with a delay, but, on the other hand, we get a dynamic support and resistance level that can be used to catch the end of pullbacks:
In some cases, the moving average line will take a very long time to react to price changes - by that time the trend impulse may completely end. Another obvious disadvantage of the Moving Average is its poor performance in lateral movements - there will be a lot of false signals.
Oscillator Bollinger Bands or Bollinger Bands
The Bollinger Bands Oscillator or Bollinger Bands is a channel indicator for all occasions.
It is able to work perfectly both during sideways movements and during trend price movements. You just need to correctly understand the operation of this indicator. But the indicator is also a lagging oscillator, which means that you will receive some signals with a delay. In sideways movement everything is quite simple and you need to pay attention to the boundaries of the price channel:
- If the price has broken through the upper border, but the lower border has not begun to expand, then we should expect a rollback. Similarly with breaking the lower border
If a trend has begun, then the price reaches the boundaries of the Bollinger Bands, and the opposite boundary begins to expand - this is the action that occurs with a delay, because the price needs time to reach the border of the price channel:
The trend impulse ends when the opposite boundary of Bollinger years begins to narrow, but this does not mean the end of the trend - just the strength of the movement has decreased and it may take time (a pullback) for the price to continue moving in the same direction. During trend movements, the Bollinger Bands middle line can act as a support and resistance level - this is a regular Moving Average indicator, so there is nothing surprising about it:
Oscillator MACD (Moving Average Convergence Divergence) or Moving Average Convergence/Divergence
The MACD (Moving Average Convergence Divergence) oscillator or Moving Average Convergence/Divergence is an indicator that is most often used to find divergence and price convergence (the discrepancy between the indicator readings and what is on the price chart).
MACD consists of a histogram, which is used to determine divergences and convergences, as well as a signal line, which is needed to determine trends and entry points into them. If we consider MACD (or makdi in common parlance) as a tool for searching for divergence, then everything is simple:
The graph goes up, and the indicator histogram gradually decreases - this is a sign of an imminent price reversal. The only problem is that we don’t know exactly when this reversal will happen and how long the divergence will last. Therefore, MACD is a lagging oscillator.
With MACD trends and reversals, everything is also simple:
- The signal line enters the histogram – a trend impulse has begun
- The signal line has gone beyond the histogram - a rollback or price reversal
Of course, entry points in the direction of the trending price movement will be better than against the trend. Don't forget that the MACD oscillator follows the price - it lags in its readings!
Continuous units
Such devices operate synchronously with the power source. The excitation process occurs by applying high voltage and frequency to live parts. This current does not pose a danger to the worker, but is capable of exciting a welding arc without contact between the electrode and the workpiece, and due to the high frequency, sufficient arc combustion is maintained.
Oscillators whose types are connected in series are considered more effective. It does not require activation of a special overvoltage protection system in the source circuit. The coil is connected in series to the arc. During operation, the spark gap emits a quiet crackling sound.
With the unit disconnected from the network, you can use the adjusting screw to adjust the spark gap in the range from 1.5 to 2 millimeters. The installation of such equipment should be trusted to specialists, since unprofessional installation can threaten the health and life of the worker operating the device.
Using Oscillators in Trading
All oscillators are used in trading, as a rule, for only two purposes - to determine:
- Intersections
- Divergence or convergence
Using Oscillators to Determine Divergence or Convergence
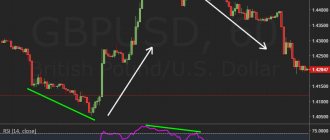
Many oscillators are capable of determining divergence (divergence) and convergence (convergence) of price charts.
For example, the same Stochastic or RSI will show divergence no worse than MACD. So it’s a matter of taste and preference of the trader himself. It is worth understanding that after divergence or convergence, a price reversal is expected. For example, this is what divergence looks like based on the RSI indicator:
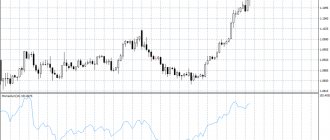
And this is the convergence of the Stochastic oscillator:
Divergence and convergence mean that the price movement is weakening (which is what the oscillators indicate), but this is not yet noticeable on the chart. Of course, convergence and divergence naturally lead to a price reversal or rollback, because the strength of the trend will end sooner or later.
Using Oscillators to Determine Overbought and Oversold Zones
With the intersection of oscillators, everything is quite clear - we are waiting for:
- Crossing levels that define overbought or oversold zones (for example, on the RSI indicator)
- The intersection of the price with the moving average line to determine a change in trend
- Price crossing of Bollinger years boundaries
- Crossing CCI Oscillator Levels to Determine Trend Impulses
Simply put, we are looking for imbalances in the market that allow us to predict future price movements. If we consider the same RSI, then we will be interested in the overbought and oversold zones:
Overbought and oversold zones are atypical price zones.
If we talk about the nature of their occurrence, then they appear at moments when the price moves very quickly in one direction. Indicators working according to conventional formulas notice these sharp movements and compare them with the previous “calm” market - as a result, we get an indicator line that is in the imbalance zone. This can very often be observed during the release of important economic news, and at this time not a single technical indicator is working correctly. It follows that finding the indicator line in overbought or oversold zones is not at all a clear signal calling for action. On the contrary, this is a warning signal that you should pay attention to the asset, and only then find a more compelling rationale for opening a transaction.
Oscillator zero level crossing
The zero level of oscillators is also an important level for many indicators of this type. Crossing the zero level most often means a trend change. For example, the MACD indicator has two indicators of trend changes:
- Histogram readings
- Crossing the zero level by the signal line
The histogram reacts to price changes faster, so it will be the first to cross the zero level of the indicator, and a little later, the signal line, crossing the same zero level will confirm the presence of a trend:
The CCI indicator line also lets us know about a trend change when crossing the zero level:
Signals should be understood as follows:
- The zero level is crossed from bottom to top – an upward trend has begun
- The zero level is crossed from top to bottom – a downward trend has begun
Intersection of oscillator lines
The MACD, Stochastic and many others oscillators have two lines to determine the market situation.
It is also worth considering their mutual intersection (they still exist for a reason). As a rule, the intersection of lines means the same thing as the intersection of a fast and slow moving average - a change in trend or the beginning of a rollback. For example, the intersection of the lines of the Stochastic indicator means a change in the current trend, but since the indicator reacts very quickly to price changes, the intersection can even indicate a rollback of one candle.
The intersection of the MACD signal line and the histogram indicates a continuation of the current trend. If the signal line leaves the histogram, then a rollback or trend change has begun - in any case, you should wait for the price to move against the current trend. But MACD reacts to changes later than stochastic, which means its signals will be stronger, although delayed.
It is also worth paying attention to where exactly the intersection occurred (for oscillators with overbought or oversold zones) - if the intersection occurred in an imbalance zone, then it will be stronger than the intersection in the “usual” state of the market.
Please note that the stochastic actually detects the beginning of a rollback faster, but this is not much use. The MACD later sees a pullback, but its signals are more accurate.
Pulse devices
An oscillator is a device that is divided into two types. A device with pulsed power allows you to provoke its constancy at alternating current at the initial occurrence of an arc. When welding, fluctuations in the current used may occur, which can sometimes cause deterioration in the quality of work. To avoid this, the oscillators are synchronized.
Often, to excite a non-contact arc, pulse-type generators are used, which have accumulated reservoirs that are recharged from a special device. Taking into account the fact that the phase change of the welding current in the working process is not always stable, in order to organize reliable functionality of the generator, a device is required that synchronizes the discharge of the capacitance in cases where the current from the arc passes through zero.
Using alternating current, the oscillator is used for welding with both conventional electrodes and elements used to work with stainless steel, non-ferrous metals, and argon processing.
Pros and cons of oscillators
Oscillators have their pros and cons that you need to know about:
- Oscillators show the situation on the market quite accurately: they determine the beginning of a new trend and reversal points. Some oscillators work great in sideways movements, and some are designed to be profitable during a trend. There are also those who feel great in any market.
- Oscillators are very easy to use - their operation is clear and does not raise serious questions. It is also worth noting the fact that these indicators are leading (or lagging, depending on the nature of their work) and allow you to predict price movements in advance, albeit not always.
- Oscillators are great for determining the strength of a trend, or more precisely, for determining the decrease in this strength. Convergence and divergence perfectly indicate a weakening trend, which means that you can prepare in advance for a price reversal.
- Oscillators are very common - they are available in almost any trading terminal. There are a lot of strategies built on oscillators, as well as thousands of modifications that allow you to use these indicators in various situations.
The disadvantages of oscillators can be safely attributed to the quality of their signals.
There are indicators whose signals need to be filtered constantly. Many oscillators perform very poorly in trending price movements, which poses particular challenges. It is also worth noting the moments when a sideways movement transitions into a trend - at these moments the oscillators will also produce false signals, because they will recommend trading a pullback rather than an emerging trend. It is best to use oscillators in conjunction with other indicators or support and resistance levels. This will help get rid of a number of problems associated with false signals. Also, combinations of Japanese candlestick models with oscillators perform very well - some find imbalances in the market, while others indicate the exact entry point.
Another disadvantage of oscillators is the lack of ideal settings. Yes, there are standard (recommended) settings, but for the indicator to work better, it very often needs to be reconfigured to suit the current situation. This process allows you to weed out some of the false signals in some cases, but also increase their number in other situations. Also, changing the oscillator settings can lead to its “sensitivity” - some profitable signals may pass by.
Where to buy?
An oscillator is a device that can be bought in specialized stores or made with your own hands. Making it yourself requires knowledge of connecting electrical circuits and the correct selection of components, the main one of which is a high-voltage transformer.
You can make a homemade model using the simplest scheme. The kit includes a voltage-regulating transformer (from 220 to 3,000 V) and a spark gap that can withstand the passage of a powerful electric spark.
The device is controlled using a button that simultaneously activates the spark gap and the supply of shielding gas to the welding area. The high-frequency pulses that ensure the efficiency of the process are directly generated by a spark gap and a high-voltage transformer. At the output, such a device has positive and negative contacts. The first supplies currents from the transformer and is connected to the torch of the welding unit, the second - directly to the elements being processed.
Oscillator-Based Strategies: Oscillators in Technical Analysis
There are many strategies based on oscillators, but to consolidate the material, it is worth considering at least a few of them. Some strategies are quite interesting, so it is worth trying them out in your trading. Of course, we should not forget that there are no 100% trading strategies, so risk management has not been canceled!
Strategy based on RSI and Bollinger Bands oscillators
It is noteworthy that in this strategy, Bollinger bands are added to the RSI oscillator window. Now in more detail. We will need:
- RSI oscillator with period “9”
- Bollinger Bands with period "20", deviation "2.5", added to the RSI window
In order to add BB to the RSI window, you need to specify in the settings where exactly the indicator should be added in “Apply to”:
The strategy’s signals are very simple and are suitable for any time frame:
- If the RSI oscillator line breaks through the upper boundary of the Bollinger Bands, then on the next candle you should open a bear trade
- If the RSI oscillator line breaks through the lower border of the Bollinger Bands, then on the next candle you should open a bullish trade
Strategy for binary options based on the RSI oscillator – 95-5
The strategy based on the RSI oscillator “95-5” implies that the levels “5” and “95” will be used instead of the standard ones. The indicator period should be set to “4”. The signals are very simple:
- The RSI indicator line has entered the zone below level “5” - open a trade for an increase
- The RSI indicator line has entered the zone above the level of “95” - open a bearish trade
Strategy based on three RSI oscillators
The “Three RSI” strategy is based on three RSI oscillators with different settings. We will need:
- RSI with period "5"
- RSI with period "14"
- RSI with period "21"
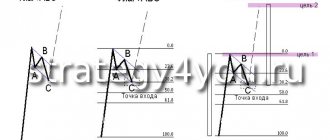
A trade can be entered only after all three RSIs enter the overbought or oversold zone:
The strategy is very popular, although, in fact, only RSI “21” would be enough, because all other indicators do not filter it in any way.
Strategy “Intersection of moving averages and MACD”
The strategy will require the following indicators:
- EMA with period "10"
- EMA with a period of “20”
- MACD
Strategy signals:
- We are waiting for the MACD signal line to leave the histogram area
- We are waiting for the moving averages to cross
- The deal should be opened 3-5 candles in the direction of the trend
Strategy for catching reversals based on the RSI oscillator and Bollinger Bands
The strategy is based on standard RSI and Bollinger Bends - these indicators combine very well and allow you to find good entry points. We will need:
- RSI with period "14"
- Bollinger Bands with period "20" and deviation "2"
The strategy’s signals are very simple:
- We wait until the candle closes beyond the Bollinger Band border
- The RSI indicator line must be above the “70” level or below the “30” level
- Entering a trade at the beginning of the formation of the next candle
- Expiration time is equal to one candle
The strategy is very effective. The only negative is the long wait for signals.
Practice working correctly with oscillators
Oscillators, like any other technical chart analysis tools, will work correctly only in one case - if the trader spends hundreds of hours developing his skills and understands in which situations the indicator works and in which it will be useless.
Many aspiring traders, in an effort to improve their trading skills and improve their results, take thousands of screenshots of their trading for further analysis. Many people record videos that show how and in what situations the oscillator works. Everyone learns from their mistakes.
Yes, it is difficult and long, but the result is worth it! By combining various oscillators, changing their settings, combining them with support and resistance levels or candlestick patterns, the trader gains experience, and he will not go anywhere. On the contrary, the knowledge gained will greatly affect trading results - where many will lose money, experienced traders will make money.
It would seem that the market is the same for everyone, but traders see it from the top of their experience. Those who chose to neglect a long and persistent study of trading will have a “hole” instead of the top, into which more experienced traders will spit from high, taking the money of lazy people.
- Previous lesson: Best indicators for binary options: technical analysis indicators + top 10 best indicators for binary options
- Next Lesson: Divergence and Convergence in Trading: How to Use Divergence and Convergence in Binary Options Trading
Peculiarities
In order to independently produce this equipment, which greatly facilitates the welding of parts made of non-ferrous metals and stainless steel, it is enough to have minimal knowledge of electrical engineering and skills in assembling electrical devices.
The main thing to consider when assembling and using a homemade oscillator is strict adherence to safety precautions when operating electrical appliances. It is important to adhere to the correct assembly of electrical circuits, and also to use only those elements that have optimal characteristics.