Any analysis of Japanese candlesticks contains doji candles or, as it is also called, doji. The Dodge candlestick is very popular and even those traders who do not use candlestick analysis in their strategy know about it. A classic Dodge (Doji star) is a Japanese candlestick in which the opening and closing prices are equal or almost equal to each other, while the shadows are relatively short. Depending on the presence of a lower or upper shadow, as well as on their length, the doji has four varieties: “Tombstone” and “Dragonfly”, “Long-legged Doji” and “Dodge Rickshaw”, we will consider them below.
The appearance of a doji candle means that the strength of the bulls and bears is equal, and during this period of time the market was in a state of indecision. And if there has been a long trend, then the appearance of a doge signals its completion and a possible reversal.
In an active market, the Doji is a strong signal, especially if it was formed with a gap and has a large tick volume, but at the same time, in a sluggish market, it is absolutely useless. Use these candles only in conjunction with other technical analysis tools, such as trend lines or indicators. It will be especially effective to use a doge with overbought and oversold indicators; the formation of a doge in the overbought or oversold zone is a good signal for a trend reversal. Dodge can also be part of some candlestick patterns, and the pattern becomes strong and significant.
Doji meaning
The opening and closing prices of the Doji are the same. If the difference between them is only a few ticks, then the candle can also be considered a doji.
The likelihood of a reversal after the appearance of a doji increases if the following trend rises. Dojis can only be perceived in markets where they are rare. Therefore, it is not recommended to use the Doji signal in weak markets such as stocks.
However, it is quite possible to use them in Forex. However, it is not recommended to work with Doji on the chart with an interval of less than 30 minutes. There is a high probability of having a large number of them.
Candle Surroundings
One of the most important aspects of assessing and predicting the movement after the appearance of the Doji is the candles adjacent to it. That is, it is important to understand what happened to the market in general and how our model affects it. There are two main options that are most often found on the charts of various instruments:
- Doji pattern within a horizontal movement. This is the most common option - there is a sideways movement of the market, the price fluctuates up and down, the range is usually very small. The price remains approximately at the same level, while not always drawing exactly the Doji, but sometimes leaving a small body, which, however, is also incomparable with the general range of the candle. And there can be several such Dojis in a row. Accordingly, if we see several being formed, it means that uncertainty will persist and such a chart does not offer any trading ideas. Maybe switch to small frames and start trading this consolidation from border to border, but this is completely unreasonable, since all this could stop at any moment.
Doji pattern within a horizontal movement - Doji pattern on a trend. Usually appears when the trend develops very evenly. There is an opinion that this is how large volumes work, pouring into the market quite quickly, that is, without placing an asset in consolidation. In this case, you can see approximately the following sequence: trend candles periodically stop in the form of a Doji, after which the movement continues in the same direction. That is, Doji in this case will be like a short-term horizontally directed correction. When moving to small periods, this may well turn out to be one of the patterns of graphical analysis - a flag or a pennant. In general, the situation is quite common in a trending market, but it all depends on the time frame of the candles in question.
Doji pattern on a trend
Doji pattern – Doji candle on tops
Doji on top
Dojis can indicate a top in the market. This is especially true for those dojis that may appear after a long bullish candle in an upward market. This property is explained simply. The Doji appears in the market at a moment of indecision.
The interesting thing is that in a declining market, the appearance of a doji may not signal a reversal (read: trend reversal patterns).
This is due to the fact that the Doji pattern represents an equality of strength between bulls and bears (read: bull or bear on the stock exchange). When such uncertainty arises in a down market, the chart may continue to move down “under its own weight .”
This means that if you notice a doji in an upward market, the trend will most likely change, but in a downward market it may continue. Therefore, a doji at the bottom of the market requires stronger confirmation than a doji at the top.
Important points
- It is highly desirable to have support in the form of a support/resistance level, as for any Price Action setup
- The Doji High is a level that, if broken, will mean that the trend is still in force.
- Don't overlook other timeframes
- On small scales (less than H1) doji means NOTHING
- We always wait for confirmation
- If the market moves horizontally, simply ignore the doji
- Only the FIRST doji is important
- Short shadows are desirable for reversal
Long-legged doji and rickshaw
Rickshaw
Long Legged Doji plays a very important role (Read - application of candlestick analysis) if it is observed at the top. This Doji has very long upper and lower shadows - this is evidence of market indecision.
On such days, the market rises and then falls, after which the closing price is equal to or close to the opening price. If the opening and closing prices are in the center of the range, then this candle is called a “rickshaw”.
If a candle does not form a doji, but has a very long upper or lower shadow and a small body, then it is called a “high wave.”
This forex signal is also a sign of a reversal. The Japanese say that candles with long shadows seem to have “lost their way.”
Here, I advise you to read all the articles about Japanese candlestick patterns:
- Continuation models
- Hartley models
- forex absorption patterns
- Forex candle shadows
- Rising wedge forex
- Double Top Figure
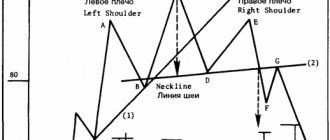
- Head and shoulders pattern
- 1 2 3 pattern mtf
- Price action patterns
- Pennant pattern
- Forex Renko charts and patterns based on them
- Forex candlestick patterns
Basic structure and characteristics
There are thirteen varieties of Japanese candles. They all consist of several main parts. These include the opening and closing price, high and low.
Doji candles are considered one of the most significant. Their peculiarity is the fact that the opening price is equal to the closing price. This option is considered classic. For example, if at the beginning of the day the price was 1.8860, rose throughout the day, and in the evening dropped again to 1.8860 - this is a classic correct variation that allows you to figure out what Doji is.
However, as practice shows, this option is extremely rare. Most often, the Doji category includes a candle that is characterized by a short body and fairly noticeable shadows. She usually has a small range.
Another name for this pattern is Doji Star. It is no coincidence: in its shape, this candle is indeed visually similar to a star.
Tombstone Dodge
Gravestone Doji
Another striking example of a doji is the Gravestone doji. This signal appears when the opening closing prices are at the level of the daily minimum.
Sometimes a tombstone doji may appear at the bottom of the market. Its main purpose is to signal the formation of a peak.
The appearance of the doji tombstone corresponds to its name. It should be noted that there are many Japanese technical terms. analyzes that are associated with war.
Tombstone Doji supports this trend. This means that the tombstone was erected on the graves of bulls and bears who laid down their heads while defending their territories.
If you see a tombstone doji during an uptrend, then it is a clear bearish signal. This is understandable, the market opened at the low of the trading session.
Then it went up sharply and may even set a new high, which strengthens the signal. After this, everyone who opened bullish positions begins to have problems. Because by the end of the session prices fall to a minimum (read - Forex indicator of trading sessions). The higher the shadow above and the higher the price level, the stronger the bearish potential of the doji.
Some may notice that the Tombstone doji is very similar in appearance to a shooting star . The Tombstone Doji seen at the summit is a type of shooting star. A shooting star has a small body, while a doji has no body at all.
The Tombstone Doji has bearish potential that is more pronounced.
What does the gravestone doji tell you?
The Tombstone Doji pattern implies that a bearish reversal is approaching. Although the open, low, and close prices do not need to be equal for the pattern to be valid, there must be a relatively small tail, otherwise the pattern may be classified as an inverted hammer, shooting star, or spinning top. The market story is that the bulls are trying to push to new highs for the session, but the bears are pushing the price action from the open to the close of the session. Thus, the long upper shadow represents bulls losing momentum.
While tombstone dojis can be found at the end of a downtrend, they are most often found at the end of an uptrend. Although the tombstone doji is popular, it suffers from the same reliability problems as many visual patterns. Typically, traders will not act on a tombstone doji unless the next candle confirms the reversal.
Doji – support and resistance level
A Doji at an important top or bottom can act as support and resistance.
Doji - three stars
Doji three stars
Three stars is a very rare signal. But this is one of the most important reversal patterns. The “three stars” pattern contains three dojis.
Various versions of this model, which differ from the classic one, play an important role. Usually this model is classified specifically as a Doji model, and not as a star, since the most important sign of this model is the presence of three Doji or candles close to Doji.
Content
- Bullish Japanese Candlestick Patterns
- Abandoned baby - bull model (abandoned baby)
- Morning doji star
- Three inside up
- Three outside up
- Three white soldiers
- Breakaway candle
- Doji star
- Dragonfly doji
- Engulfing
- Three stars in the south
- Hammer
- Ladder bottom
- Morning star
- Piercing line
- Three stars
- Belt hold
- Gravestone doji
- Inverted hammer
- Tweezers bottom
- Abandoned baby – bear model (abandoned baby)
- Dark cloud cover
- Evening doji star
- Evening star
- Three inside down
- Three outside down
- Advance block
- Breakaway candlestick
- Deliberation
- Downside tasuki gap
- Dragonfly doji
- Engulfing
- Meeting lines
- Three stars
- Gravestone doji
- hanging man
- Belt hold
- Harami
- Shooting star
- Harami cross
- Tweezers top
Morning and evening doji stars
Doji - Evening and Morning Star
Dojis are called " Doji stars " when they form a gap up with the body of the previous candle in an uptrend or fall with a gap below the body of the previous candle in a downtrend. These stars foretell a change in trend.
The market after the doji should confirm the reversal signal. Thus, confirmation of a reversal at the top in an ascending market can be considered a doji, after which there is a long bearish body, which covers a significant part of the white body. This is the Evening Star Doji model. This pattern is more important than a simple doji star because it contains a doji.
When a doji appears after a black body candle in a downtrend, the confirmation of a reversal at the bottom is a white candle. Her body should cover a significant portion of the black body. This pattern of three candles is the “morning star doji.”
If, during an upward or downward trend, a gap forms and is followed by a doji, then this is one of the strongest signals, which is called “ abandoned baby ”.
Logical interpretation
FIGURE 3 Doji pattern as an indicator of market sentiment
This pattern, depending on market conditions, can be either a reversal or a signal to continue the trend. If you already know a little about chart patterns and other Price Action models, you may have guessed that Doji denotes some kind of price uncertainty, implying market calm, or a temporary agreement between sellers and buyers, or the absence of major players. This model may also be the result of testing the price level. If we take the analogy of a traffic light, then the doji is its yellow light.
FIGURE 4 Types of shadows of the Doji pattern
A more detailed interpretation of the doji can be based on the shadows that reflect what is happening in the market:
- Symmetrical shadows indicate uncertainty in the market caused by equal forces of sellers and buyers
- Short shadows indicate a small range of price fluctuations caused by low market activity
- The difference between the shadows indicates a failed attempt by the market to move the price in the direction with which the shadow is longer
The types of shadows are clearly depicted in Figure 4.
Japanese candlestick patterns: summary
Candlestick patterns are not a 100% trading strategy.
Moreover, they must be used wisely - filtered by support and resistance levels, oscillators, Fibonacci levels, trend lines, etc. If you take and open a blank price chart and start finding Japanese candlestick patterns on it, the result may be will be positive, but far from the best! There are many models - you should study them gradually. To begin, select 3-4 clear candlestick patterns and try to find them on the emerging charts and open trades on them. Once you are sure that these models are deposited in your memory, begin to study new formations and their practical use.
- Previous lesson: Japanese candlesticks for beginners and professionals: graphical analysis of financial markets using Japanese candlesticks
- Next lesson: Lines, levels and zones of support and resistance (support & resistance) in trading: support and resistance levels in binary options
Bearish candlestick patterns
Bearish Japanese candlestick patterns are patterns, after the formation of which, the price falls. They should also be filtered by resistance levels or Fibonacci retracement levels, and you can also use indicators that predict price reversals.
Abandoned baby – bear model (abandoned baby)
The abandoned baby (bearish pattern) is a complete mirror image of the bullish pattern. The first candle is bullish, the second candle is a doji with small shadows, the third candle is a reversal (bearish). The pattern is formed at strong resistance levels. Entry after the formation of the third candle.
Dark cloud cover
A dark curtain (in Price Action - bearish CPR) is a candlestick pattern in which the second candle breaks the high of the first candle, but closes well below its opening level. The candle indicates the strength of the bears and the continuation (or beginning) of a downward trend. Login immediately after the model is formed.
Evening doji star
Evening Doji Star is a candlestick pattern that forms only at the tops of trending movements. The price moves up, after which it encounters a strong resistance level, from which a reversal occurs. Enter down immediately after the formation of a pattern of three candles.
Evening star
The evening star is exactly the same pattern as the “evening star-doji”, with one difference - instead of a doji, there is a small candle with a shadow on top (or just a small candle). Formed at the tops of upward trends.
Three inside down
Three inside down – a reversal candlestick pattern, consisting of an inside bar and breaking through the boundaries of the mother candle against the current trend (breakdown downwards). Enter a bearish trade immediately after the formation of the third (confirming) candle.
Three outside down
Three outside down is a variant of a reversal candlestick pattern with engulfing. The second candle engulfs the first bullish candle, and the third candle only confirms the price reversal. The model is quite strong and is formed at the tops of trend impulses. Entry immediately after the confirmation candle closes.
Advance block
The repulsed offensive is three ascending candles, the last of which has a long shadow at the top. The fourth candle should be a reversal candle. It’s not bad at all if it forms a bearish CPR (breaks the high of the previous candle and closes below the opening price – as in the example above). Entry immediately after the formed reversal candle.
Breakaway candlestick
A breakout candle is a formation of five candles. The first four candles are moving upward, the fifth candle is bearish. It should absorb the last three candles - a signal to open a downward trade.
Deliberation
Reflection – reversal pattern or trend continuation candlestick pattern. A distinctive feature of the formation is that the second candle, most of its body, is located within the first candle, and the third candle is a doji candle or a candle with a small body. The fourth candle is a reversal candle - entry down after its formation.
Downside tasuki gap
The lower tasuki gap is a candlestick pattern of three candles. The first and second candles are downward, the third candle is upward. The second candle is formed with a gap (the gap between the candles), the third candle begins to form approximately from the middle of the second candle. Enter a bearish position after the formation of the third candle.
Dragonfly doji
Dragonfly Doji is a reversal pattern with a dragonfly Doji (a Doji candle whose shadow is directed against the uptrend). Before opening a trade, be sure to wait for the reversal candle!
Engulfing
Absorption is a candlestick pattern (in this case, bearish), in which the first candle is completely contained within the second candle (the second candle formed above the high of the first and closed below the low of the first candle). Enter immediately after the formation of the pattern - expect a strong downward price movement.
Meeting lines
Colliding candles are an interesting candlestick pattern in which the first upward candle collides with a second downward candle. It is interesting that the second candle begins its formation significantly higher than the high of the first candle, and the closing of the second candle very often occurs at the high of the first candle. Enter immediately after the formation of the second candle.
Three stars
Three stars are three dojis formed at the top of a trend and at the same horizontal level. A signal for a further price decrease, although first it is better to wait for a confirming candle - a candle with a downward movement, which should form immediately after the third doji candle.
Gravestone doji
A Tombstone Doji is a pin bar formed at a strong resistance level after a strong upward move. The pin bar should have no body and no shadow below (or a very small shadow). The longer the shadow above, the stronger the reversal pattern. You can enter a bear market immediately after the pin bar appears, or after a confirmation candle.
hanging man
A hanging man is a small candlestick with a long shadow at the bottom at the top of a trend. The color of the candle does not matter - only the shape matters. After the hanging man there should be a candle confirming the reversal - entry into a decline only after it.
Belt hold
Belt grab is a candlestick pattern where one downward candle engulfs three previous upward candles. It is formed both at the tops of trend movements and during price corrections. Entry immediately after the engulfing candle.
Harami
Harami is a pattern where the first second candle closes approximately in the middle of the first candle. At the same time, their maximums are the same. This formation is worth considering. Like a reversal, but it is better to wait for confirmation in the form of breaking the low of the first candle.
Shooting star
A shooting star is a pin bar that formed at the top of a trend or a local maximum. The pattern must be confirmed by the resistance level at which the pin bar was formed. The color of the candle does not matter, the main thing is that the body of the candle is three times (or more) smaller than the shadow above. Enter a trade immediately after the formation of a pin bar or after a confirmation candle.
Harami cross
A harami cross is a pattern consisting of a full-bodied candle followed by doji candles (uncertainty candles). The model is formed at local highs, but to enter you should wait for confirmation of the reversal.
Tweezers top
The top of the tweezers is a formation of one full-bodied rising candle and a candle with a small bearish body and a long shadow below. This pattern is considered a reversal pattern, but it is better to wait until the low of the first candle is broken and only then open a downward trade.