What is the essence and how the theory of wave analysis works in trading in financial markets. Elliott waves and Fibonacci levels, indicators and methods.
Elliott wave theory was developed almost 100 years ago. It allows you to see the general pattern in price movements in the market. Graphically, they represent waves: the main trend is replaced by short-term pullbacks, after which the cycle repeats.
Elliott waves can be found on the chart of any asset. But in order to learn how to really make money on this concept, you should adapt it to your trading system using additional methods (indicators, levels, fundamental analysis).
Brief historical background
Ralph Nelson Elliott proposed that market movements have a wave nature in the 1930s. He carefully studied the charts, which allowed him to notice certain patterns in the development of prices in the stock markets. Each pattern corresponded to a specific model. The author laid a mathematical basis for his theory in the form of Fibonacci numbers - a numerical sequence that was discovered back in the 18th century.
The patterns that Elliott was able to substantiate were repeatable in form, but could differ in time and amplitude characteristics. The author identified 13 similar patterns, called waves, that constantly appeared in market price data. He was able not only to identify them, but also to present them graphically with full justification:
- illustration of each model
- the relationship between all waves;
- the formation of larger-scale similar models, each of which can form even larger waves of the same size.
Thus, the theory was called the wave principle, and in 1938, Ralph Elliott published his own book with the same title, “The Wave Principle.”
Subsequently, a significant contribution to the popularization of this theory was made by financier Robert Prechter, who also contributed to the development and relevance of this approach as one of the methods of market analysis.
Robert Prechter
Of course, Robert Prechter did the most work here. It was thanks to him, when he took up the banner from Frost, that Elliott waves gained widespread popularity, almost 50 years after the accountant Elliott wrote a book on them.
Many technical systems have a similar fate. They are forgotten, not appreciated during their lifetime, and then suddenly they become popular when they are promoted by a fanatical follower. To this day, Prechter is considered the leading expert on Elliott waves, and his website elliottwave.com is the world's premier resource on this topic. There are a lot of cool forecasts, for example, experts from Prechter’s website predicted the 2008 crisis without any problems several years before it appeared. In fact, the modern Elliott is Prechter and his school.
It is the books of Robert Prechter (including those co-authored with Frost) that need to be read to understand this topic.
Elliott waves, at their core, have a fractal basis and the task of their practitioner is to decompose the waves into understandable elements. We will look at them now.
What are Elliot waves and their features
Elliott waves can be interpreted as a graphical method of technical analysis, thanks to which it is possible to assess the behavior of market participants by directly studying price movement waves.
Each trend has its own structural sections, called waves, and they often repeat themselves. It is customary to distinguish two types of waves – impulse and correctional.
Impulse models are characterized by movement along the main trend, while correctional ones reflect the adaptation of the movement to them. The key analytical figure is presented as a combination of an impulse and a corrective wave. Schematically this is indicated as 1-2-3-4-5/ABC. Next, division into lower-order waves occurs.
All impulse waves are designated by numbers from 1 to 5, and corrective ones are assigned the letter value A, B and C. As Ralph Elliott stated in his theory, in every trend there can be seen a combination of fives and threes, that is, a combination of impulse and corrective patterns .
Setting the EWP indicator
In the archive, which can be downloaded from the link above, there is an Elliott Wave Prophet folder, and inside it there is an Indicators directory containing an indicator file. To add it to mt4, open a terminal, click “File” at the top left and select “Open data directory”. In the window that appears, find the MQL4 folder, where they copy the Indicators directory from the downloaded archive, after unpacking it.
After this, mt4 needs to be restarted, and then at the top of the toolbar select Insert - Indicators - Custom - Elliott Wave Prophet.
Five-wave model
Market price movement is displayed as a 5-wave form. The first, third and fifth are waves of directional movement, that is, impulse ones. The second and fourth are waves of the opposite movement, that is, correctional, or pullback.
The author of the theory attributes three immutable properties to the five-wave model:
- the second wave never crosses the starting point of the first wave;
- the third wave is never characterized by the shortest length of all five;
- the fourth wave can never enter the price territory of the first wave.
Moving models have a five-wave structure, while correctional models have a three-wave structure with various variations. In one complete cycle you can count two phases and eight waves:
- a five-wave driving phase is formed (numerical designation);
- then a three-wave correction phase appears (letter designation);
- provided that the second wave corrects the first, then the sequence A-B-C will correct the sequence 1-2-3-4-5.
Each trend will last such a time during which all five waves are formed, and then a correction or reversal may follow. In the second case, two pulse-type waves will be observed, the structure of which is represented by ten segments.
As noted above, the 1st, 3rd and 5th waves are characterized as impulse waves because they follow a trend movement. But the 2nd and 4th waves will be of a correctional type. Analyzing the A-B-C structure, the situation will change as follows:
- this structure is part of the downward wave;
- A and C become impulse waves;
- B is a wave that is directed upward and is corrective in nature.
Types of correction waves
Elliott described 21 ABC type correction patterns. Before you grab your head, let us reassure you that you don’t need to memorize them at all, since they are all extremely primitive and consist of only three models.
- Zig Zag.
- Outset.
- Triangle.
Zig Zag
As you can see, this is a very inclined price drop against the main trend. In this case, wave b is usually the shortest. Such waves occur 2-3 times during correction. Like all other waves, each wave in a zig-zag can be decomposed, in turn, into a 5-wave structure.
Outset
These are correctional waves that go in the side channel. In this case, the wavelengths are usually identical, although wave B will sometimes be longer than A.
Triangles
A very familiar situation, because figures in technical analysis
we have already studied.
A triangle is a corrective pattern between trend lines, consisting of 5 waves that go against the trend in a sloping sideways channel.
Advantages of Elliott Wave Theory
The main advantage, which is also a unique characteristic, of this method of technical analysis is that such structures are formed both during an increasing and decreasing trend.
If we consider the second case, when the market belongs to bears, then the market situation will be a mirror image of the bullish structure:
- impulse waves 1-3-5 become downward;
- waves 2-4 are upward correctional waves;
- A and C become upward corrective, and B becomes downward corrective.
It is important to take into account the fact that the trend structure is not tied to a time frame, so intervals cannot in any way affect the formation of waves.
Corrective waves
Then the fun begins. After the 5-wave impulse structure there is a 3-wave pullback. To avoid confusion, letters are used to designate these waves - a, b, c, etc.
And here is the opposite example, for a downward trend:
Elliott Wave Theory Rules
In fact, it is not so difficult by eye or just visually to see the five-wave pattern. If you can count to ten, then you are welcome - just look at the graph and indicate the cycle. However, there is a catch - and it lies in subjective judgments. Two traders, analyzing the same chart at the same time, can express completely different variations and opinions about the structure of the waves that are formed in the trend.
It is in order to ensure that the subjectivity factor does not interfere, that the key rules for the formation of Elliott waves were developed. The author himself partially introduced them, and the remaining principles were added by other theorists and experts over time.
The basic rules of Ralph Elliott wave theory are as follows:
- the second impulse wave cannot fall to the level of the starting point of the first wave. If such a phenomenon occurs, then there is no point in asserting the formation of a trend;
- the third impulse wave cannot be higher than the maximum point of the first wave, and it cannot be the shortest among all three, unless we are talking about long time intervals;
- the fourth impulse wave cannot be below the low point of the first wave. Sometimes this rule can be circumvented, but the following principle written below cannot be ignored;
- the fifth impulse wave should always be higher than the maximum point of the third.
Additional rules that determine the correct and correct definition of waves include the following postulates:
- intra-pulse corrections must be of varying complexity, and also have their own unique parameter of nominal size or creation time. If the values of at least one parameter coincide, then it is impossible to assert that a trend has formed. There is always a possibility that a complex correction model is being formed at the current moment in time;
- if the structure follows all the rules of construction, then one of the driving waves will always be stretched, thus its nominal size will be larger than the other two impulse waves;
- three waves in a row that form a wave structure must appear at different times.
Taking into account all the listed rules, a trader can analyze the chart and identify where there is an impulse structure and where there is a correctional structure. If all the rules are followed, then the chart now displays an impulse type wave. If one or more rules are not met, we can assume that the situation is characterized as a correction or an impulse wave that has not yet fully formed.
Using Fibonacci ratios
Elliott waves are interconnected by certain relationships. This was noted by the author using the example of not only rollbacks, but the relationships between driving waves. The surprising thing is that these proportions are based on the “ golden ratio ”, the same value can be obtained if we take the limit of the ratio between the subsequent member of the Fibonacci sequence of numbers and the previous one with infinite extension. This gives a value of 0.618 or 61.8%. All the rest from the series of basic ones are obtained by taking this ratio sequentially from itself, dividing the resulting parts by itself, and so on. The main possible dimensions of the Elliott wave include: 23.6; 38.2; 61.8; 76.4; 78.6; 161.8; 261.8. These are the basic values that can be used as a guide when calculating the possible size of a rollback, as well as the potential target of the current impulse movement. The second wave is characterized by pullbacks ranging from 23.6% to 76.4%; there are also deeper ones, but this happens rarely. The fourth wave is usually guided by a rollback to the third , so the relationship needs to be looked at specifically between them, and not the entire movement, starting from the first. In the fourth wave, the rollback usually does not exceed 38.2% of the third. The first and fifth waves of Elliott are usually approximately equal, while the third is often extended and can range from 127% to 261% of the first wave, in rare cases 361% and even 423%. Since Elliott wave structure , these methods are applicable on absolutely any scale, up to a five-minute chart.
An example of a correction using Fibonacci levels.
How to correctly identify Elliott waves on a price chart?
Follow the following recommendations to correctly and effectively identify wave structures on a chart during analysis:
- in the case when the third wave is larger compared to the first and fifth, then they will be equal in length - this technique is useful when you analyze the state of the market at the end of the fifth wave. If the length of the fifth wave turns out to be greater than the third, and the length of the third is greater than the first, it means that the fifth wave is fully formed and now we are focusing on the top of the fourth;
- When studying the structures, experts identified the following pattern - correctional waves the second and fourth can be of different sizes, while alternation at certain intervals is acceptable. For example, the strength of the correction in the second wave could be quite noticeable, therefore, in the fourth it will be much weaker, and vice versa. This recommendation is useful to calculate the time of the onset of correction by the time the fourth wave appears;
- if the correctional wave A-B-C ends, then this process should occur only at the minimum point of the fourth wave.
Content
- Elliott Wave Analysis Theory - Impulse Wave Pattern
- Elliott Corrective Waves
- Types of Elliott Corrective Waves
- Elliott wave labeling
- Practical advice on Elliott waves
Elliot waves and their graphical interpretation
It all starts with charts, so to apply wave theory you will need to use indicators. It is best to display a chart in the form of Japanese candlesticks, which combines information content and objectivity.
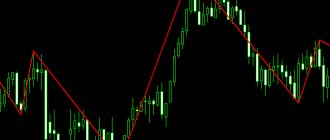
On the chart, the wave structure looks like this:
It is important to perform the following sequence of actions:
- We determine a significant turning point, most often this is implemented using the “Signal Line” tool. When it intersects, a new period will begin - this will be our object of analysis;
- When we have decided on the turning point, it is necessary to identify each wave in the structure. This process is considered the most complex and the quality of the subsequent analysis depends on its literacy. Always remember that the assigned structural designation cannot be revised or changed in the future unless there are compelling reasons for doing so. You determine the time scale yourself, but it is better to use an interval that is no longer than 30 microwaves. Now you can place all motion markers;
- the final stage is characterized by compaction of the wave, when it will be assigned the corresponding number of a structural element in a larger scale system. The graph will be assembled from several entire structures into one large one - microwaves will form a complex model.
In this way, we can see the market structure and make predictions about its further development.
Prerequisites for the emergence of the theory
Elliott wave theory is the first serious work in the field of price chart analysis since the Dow theory. The basis is the statement that all history repeats itself in one form or another and so-called Elliott waves are formed. Just as any social or economic events have the same development scenario, in the same way one can identify structures on a graph that are like two peas in a pod, similar to each other. “History repeats itself” is one of the foundations of Dow's work, which Elliott developed into a full-fledged analytical system . The developer himself never managed to make a fortune from his brainchild, but there is indisputable evidence that Ralph Elliott predicted events with amazing accuracy, and he did this not only regarding the price, but also the possible start and end times of market movements.
Elliott waves are an ordered system of rules that describe the behavior of the main object of study - wave motion . It means some directional shift of the graph up or down. The relationship between individual movements leads to a complication of the structure of the model, and then the same rules begin to apply, but only in relation to a larger wave. Thus, something that is not entirely obvious at first glance becomes clear - the entire chart is highly fractal, self-similar, it can be decomposed into components that are similar to each other, from weekly movements to every second tick fluctuations.
Click the button to go through a step-by-step guide to Elliott Wave Theory and master it in a few simple steps Explore »
Practical interpretation of Elliott waves
Most often, traders resort to the Elliott wave theory to implement their trading strategy when an impulse wave appears from a trend reversal point. All trades are opened within the first three driving waves, and it is extremely important to be careful, since there is always a risk that the chosen structure may turn out to be an element of a correctional model.
If an impulse wave has formed, we wait for the moment when the first correction occurs. At the moment of its completion, you can receive a signal to enter the market. Next we will look at methods of trading using waves.
Why is the EWP indicator useful?
In daily work, the tool will be useful in the following ways:
- helps to visually display already formed waves;
- allows you to roughly outline goals;
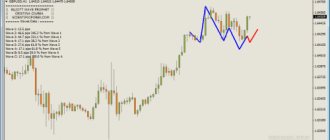
- makes it possible to determine corrections.
If you pay attention to the left side of the chart, you can see how the indicator displays data on all waves found on Forex, noting their value in points based on Fibonacci levels. This allows you to understand that, on the one hand, the marking is not built at random, but, on the other hand, the trader who makes adjustments will always be able to track the key relationships in it between individual bottoms and peaks.
We open trades using the conservative method
When the movement in the direction of the original impulse resumes, we draw a signal line through the reversal point and the point of the expected end of the correction.
It is appropriate to open a long position at the high of the first wave of movement. If the price chart has not reached the order level and begins to reverse with a breakdown of the signal line, then you monitor its behavior so that the fall does not reach the reversal point and below. When growth resumes, the line will adjust relative to the new minimum level.
If you placed an order immediately, you continue to monitor the behavior of the signal line. When the price reaches and touches this level, it is necessary to close the deal and place a new order, the level of which will correspond to the extreme maximum.
If, after touching the signal, the price chart moves again in the direction of the trend, there is no need to despair and panic. Such work moments happen often, so take such phenomena from a philosophical point of view. You can always compensate for your losses if you open a new contract.
Application in practice
Using Elliott Wave Theory
When Elliott Wave Theory is used to find entry points into trades, the clearest signal is the formation of an impulse movement from the point where a trend reversal occurs.
If we are talking about an upward movement, entry into positions is carried out in one of three impulse waves.
☝️
It is best to wait until the first correction is completed after identifying the impulse wave and then open a trade along the trend.
In this case, two methods can be used:
- Conservative
- a buy order is opened after the completion of the corrective movement at the end of wave 5. A signal line is drawn through the beginning of the first and the end of the second wave, in case the rate returns to which the transaction is closed. Re-opening is done at the top of the new high after the signal line has been adjusted.
Conservative method of entering trades using the Elliott wave theory
- Moderate
- the initial conditions for opening a deal are similar to the conservative method, but a buy order is placed at the end of wave B. Further actions are similar - if necessary, the deal is closed and the signal line is adjusted.
Moderate method of entering positions
An aggressive method of entering a position is also sometimes used, which consists of opening a transaction after the signal line is broken. It is believed that such an event indicates the beginning of the formation of a new impulse pattern.
Opening trades using a moderate or aggressive method
The initial stage of trading when using a moderate strategy remains the same as with a conservative technique. However, the significant difference is that placing an order occurs at the end point of corrective wave B. Remember that the expected correction may last longer than you expect. We adjust the signal line according to the principle of a conservative approach, and similarly close the trading position. This option is relevant in trading if you are a beginner.
If you are trading aggressively, this assumes that the order will only be placed after the signal line has been broken. The very fact of intersection is a signal of the completion of the structure and the beginning of the construction of a new wave.
Driving forces of wave formations
Elliott created his theory based on the analysis of stock market indices, more precisely, the Dow Jones index. He tried to find connections between the economy and the “mood of the masses.” The market is the result of the social and economic activity of human society, which is the driving force behind market changes. The wave theory quite accurately reflects the processes occurring in the stock market.
The more confidently stock prices rise, the more buyers appear, and when prices fall, more and more people want to get rid of them. Since the movement is determined by the behavior of a large number of players, the joining of a mass of players to the main movement causes an increase in the corresponding intensity. And when the price reaches a certain (fair) level, a correction process appears.
The behavior and composition of market participants can explain the intensity of movement and the length of waves. This is clearly seen in the growth of the share price of the famous company Tesla Motors. Here the picture emerges from $17, the share price at the time of market entry. On the chart we see that five waves of growth have been formed, then three waves of correction and the beginning of a new rise:
The main buyers of the first wave were large funds that could afford to take a chance on a new company, and investors who appreciated the potential of new technologies and growth opportunities.
Then a corrective second wave began, when shares were sold by investors who were unsure of a further rise. When it became clear that the company was developing steadily, the flow of buyers, including speculators, increased, creating the effect of increasing traffic intensity. In three years, Tesla Motors shares rose to $265. The third wave, exactly according to theory, turned out to be the longest and with gaps.
At this stage, primary investors and speculators began to take profits. The fourth corrective wave lasted to $180. By this time, the company had become widely known, and the stability of its work and prospects were not in doubt. Massive buying of shares began and the fifth wave grew to the level of $290.
After reaching the ceiling (fair price), a natural correction began, consisting of three waves. The situation on the daily chart shows that the correction is ending, since the price has risen above the bottom of wave A.
How are indicators used when trading Elliott waves?
There is no ideal indicator that can be used to quickly and effectively form a wave cycle. Now it offers a large selection of different modifications, and traders can choose instruments that suit their strategy and financial goals.
The most popular indicators for technical analysis and identification of wave structures are the following:
- Elliot Wave Oscillator;
- Elliot Wave Prophet;
- Watl.
Let's look at each of them in detail.
Studying the operation of indicators
There are several such tools, most are freely available, so you can simply download the wave indicator and install it in your trading terminal. We will look at 2 good options - WATI and Elliott Wave Oscillator.
WATL indicator
The following settings are available:
- High/Low_Period – default values are 70 and 13, respectively. The first is responsible for searching for waves on higher time intervals, the second works with smaller time frames;
- Trigger_Sens – Forex indicator sensitivity;
- StayLinesAfterDelete – if you activate this parameter, the indicator will not clean up the plots after it is deleted from the chart;
- DrawHighPivotSemafor – when activated, constructions from a higher timeframe are displayed on the current time frame;
- DrawLowPivotSemafor – should be activated only for lower time intervals;
- DrawHighTrendLine – if activated, the Elliott Wave indicator will draw trend lines from higher timeframes;
- HighTrendLineInMemory – indicates the number of trend lines that will be saved on the chart. If you set the value to 0, then all constructions will be saved.
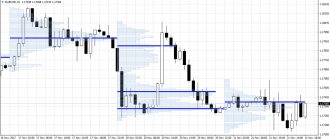
WATL indicator settings.
This Elliott Wave indicator has a much larger number of settings, but some of them are responsible only for the visual component, without affecting the operation of the indicator as a whole.
WATL at work.
The indicator places wave numbers along the extreme points of the chart and draws trend lines. But the trader will have to do more detailed markings on his own. So WATL won't do all the work for you.
Elliot Wave Oscillator
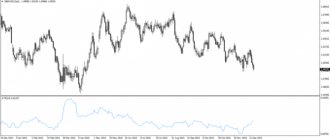
This indicator displays a histogram, reminiscent of MACD. The highest peaks will correspond to the third driving wave. Can be used to analyze any time frame, but it is better not to use it if you trade on too short time intervals.
When the histogram crosses the zero mark in the direction from below or from above, divergence will appear, which signals the end of the next wave structure.
When, during the first corrective movement, the oscillator breaks through the zero level in the opposite direction, then the creation of the third wave should be confirmed by a new divergence. If it does not occur, it means that the calculation of the starting point of the model occurred incorrectly.
When the histogram falls by 30-50 percent relative to the local extremum, this is evidence that the third wave has ended and the second corrective segment is beginning to form. The completion of the creation of the fifth wave should be accompanied by divergence, that is, the ascent or decline of the price chart is supported by a corresponding decrease or increase in the histogram bars.
Referring to the first trading rule, the trader must wait for the moment when the zero level is crossed with confirmation of this action. When we have a growing trend, the histogram will be displayed above the middle level, if there is a falling trend, then below the middle level. You can open a trade after the first divergence. Rising prices and falling oscillator values will indicate a favorable moment to open a short position, and if the opposite divergence occurs, then a long position is relevant.
If the corrective movement falls or rises by about a third relative to the first impulse wave, you can enter the market after that. The stop loss is placed at the extremum level and the signal to complete the trading operation will be the moment after the appearance of a new divergence.
Nature of vibrations
At first glance, the trading process is absolutely chaotic, especially if you watch it on a one-minute time frame. However, even on it one can distinguish Elliott waves. They are made up of a constantly shifting balance of supply and demand , and this happens cyclically, not necessarily due to changes in market conditions, but at least because someone takes profit without having any idea what will happen next and thus creates a movement in the opposite direction side. This entire process of forming new Elliott waves can take from minutes to months, depending on the scale of the money involved in the formation of the movement. The author has introduced a special system for marking, which provides a variety of notations for separating fluctuations by their magnitude and length - from a global supercycle of two Elliott waves to hourly ones. For smaller periods, there is no particular point in marking, since the effect of market noise is too strong, which some attribute to automated algorithmic systems.
So, Elliott waves consist of two types - impulse waves and corrections . They differ as follows: an impulse wave has five components, a correctional wave has only three. The logical question of why exactly 5 and 3 can be answered if you try to select the simplest combination of identical components so as to distinguish one from the other and none of them was an integral part of the other. So it turns out that this number pair is the simplest solution. The following picture shows the decomposition of such a 5-3 cycle into its component parts with a sequential decrease in scale.
Fractality of wave structures.
Click the button to go through a step-by-step guide to Elliott Wave Theory and master it in a few simple steps Explore »
Why are Elliot waves criticized?
The theory put forward by Ralph Elliott has often been criticized and many opponents have argued that it is useless for practical application because it is characterized by a subjective approach. Some traders claim that this method of analysis results in losses rather than profits in most cases.
According to Benoit Mandelbrot, the predictions obtained using the wave theory are not unique. This art is subjective, but the priority should be an objective assessment based on calculations and combined characteristics.
When criticizing Elliott’s original methodology, the following aspects are most often raised:
- it is impossible to predict the price movement, since the chart may have significant discrepancies with the formed waves;
- wave analysis is accompanied by many nuances that not every trader can understand. For example, it is not always possible to determine the beginning and end of a wave;
- the best waves are visible only on historical charts, and their practical application is too difficult due to the influence of various factors.
Criticism of wave analysis
Elliott's concept is often criticized: some economists believe that in practice there is little benefit from it: it is quite subjective. It is impossible to make accurate forecasts regarding changes in value, and the price risks differing greatly from the drawn positions. Often in this case, a subjective factor (on the part of the participants themselves) also plays a role.
Leading economists emphasize that the best-executed examples are only present in historical versions of the charts. But in practice, it is impossible to apply this law due to 2 factors: the speed of data dissemination and the way of thinking.
Wave analysis of the Forex market through theory reflects the natural behavioral cycle through the standard actions of most traders:
- 10% of participants receive new information about the jump in the near future, and the first wave is formed, preceding the trend in the future;
- 90% - see growth as an opportunity to sell goods at a favorable price, but the schedule temporarily decreases and creates a second correctional wave;
- the price increases and goes against a larger number, when the majority of clients leave the sites with a loss, and at the end of the third wave they return again and enter into an increase agreement;
- at the fourth correction stage, about 10% of informed participants close their own positions;
- about 75% of players have identified an upward trend and agreed to enter into a deal with an increase, and in parallel with this, a short-term fifth wave is developing;
- a series of corrective impulses appears that repeatedly take away financial investments from 90% of contract members;
- at the final stage, new information arises, after which the entire cycle repeats from the very beginning.
In theory, wave analysis is a complex forecasting scheme that experienced traders try to master. But newcomers to the market are advised to start with the basics and move on to more intricate patterns without haste.