Absolutely every trader must know what a sideways trend is in Forex, be able to identify it on a chart, and also have at least one proven strategy for a sideways trend. A sideways trend can be called a market situation when the price of the asset in question moves up and down within a certain price range.
In other words, a sideways trend in technical analysis is a neutral trend. This is explained by the fact that bulls and bears do not have enough strength to push the price higher or lower.
Schematically, a sideways trend looks like this:
Figure 1. Sideways trend schematically.
Often such fluctuations do not exceed 3 points. This is when the price moves in a horizontal direction. That is, there is no clear upward or downward trend visible in the market.
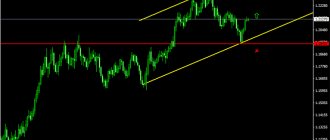
Many Forex traders call a sideways trend a flat. There is no trading at such moments. This is why many market participants prefer to wait for a specific market movement. On a Forex chart, a “sideways” pattern looks like this:
Figure 2. Example of a sideways trend on a chart.
But don’t think that absolutely no one trades in the market during a sideways movement. There are such craftsmen who skillfully apply scalping strategies. They manage to make money even on small fluctuations . Since the sideways trend in Forex occurs in all currencies, it would be a sin not to use this trading situation to your advantage.
Scalping during a sideways trend (flat) is actually not difficult. The whole point of trading analysis is to wait until the price reaches a local maximum or minimum, and then open an order in the opposite direction from this level (for a rebound). But before opening trading orders in any direction, it is recommended to connect the highs and lows with horizontal lines in order to see the boundaries of price fluctuations.
For example, the price can fluctuate up or down by no more than 15 points. During a flat, a scalper trader should wait until the price reaches a certain border (upper or lower), and then open an order in the opposite direction. With this kind of scalping, you won’t be able to take many points. Optimally – up to 5 points . To understand what we are talking about, we suggest you look at the graph below:
Figure 3. Scalping during a sideways trend.
To optimize losses, it would be better if the scalper selects pairs with a minimum spread value. It is important to note that trading will be more efficient if you use pending orders. They need to be set 15-20 points above the horizontal boundaries, which are drawn at the highs and lows . After all, sooner or later the sidewall will be hit in one of the directions, followed by a strong movement.
What is a bullish trend
A “trend” in the market occurs when impulse and corrective waves appear in the price. Impulses are strong price movements up or down, and corrections are small “pullbacks” in the opposite direction.
A bullish trend will be observed only if the chart shows several strong upward impulses, between which there are small corrective pullbacks downwards. For example, like here.
For clarity, let me mark upward impulses with red arrows, and downward corrections with blue arrows.
I want you to understand that a bullish trend is all about impulses and pullbacks.
This is not a bullish trend.
This was some serious news that caused a sharp stir and an increase in prices on the market. After such news, price rollbacks almost always begin, which is what we see in the screenshot above.
Difficulties of trend trading
It is difficult to confuse which trend is in front of you, but not all traders can follow its instructions. Most often they are hindered by psychological reasons. Traders are haunted by the following prejudices and fears :
— the system of working according to trends seems to them too simple and therefore ineffective; — the effectiveness of trends is difficult to calculate using statistical methods; — it is unknown at what time the entry/exit into the position will take place; — it is difficult to measure stop losses (loss limiters); — constant monitoring of the price chart is necessary; — on small chart scales, it is difficult for a novice speculator to draw a trend in time to correctly open a trade.
Some of these problems can only be solved by practice and experience, but some can be solved now, armed with a calculator, an Excel sheet, or a “ruler” in a trading terminal. Using these tools, you can calculate the effectiveness of trend strategies .
What is another name for bullish trends?
Instead of the word “trend”, its synonym “tendency” can be used. And instead of the adjective “bullish” - “rising” or “increasing”.
An uptrend, an upward trend, a bullish trend are all the same thing.
Analysts on television may also say the following: “The bulls in the market have strengthened their position” - this phrase can mean three things.
First. The criteria for an uptrend have appeared. For example, there was a strong upward impulse, a small downward correction, and again a strong impulse that broke through the level of the previous price top.
Second. An upward trend has indeed formed. There are two peaks and two troughs, each higher than the previous one.
Here I have marked on the chart two peaks (with an orange rectangle) and two troughs (with a green rectangle).
Third. The price moved sideways, and then broke through its upper level and began to grow.
Most often, such a breakout begins a new upward trend in the market. But sometimes it is false.
Who are the bulls and bears on the stock exchange?
This professional stock exchange slang has been used since the appearance of the first stock exchanges in the United States. Bulls in financial markets are buyers, i.e. those who open buying positions. When there are more buyers than sellers in a market, prices rise. It’s as if a bull is pushing the price up with its horns - that’s where this expression comes from.
But bears are sellers, those who open selling positions. When there are more sellers than buyers in the market, the price falls. It looks like the bear is knocking down the price with its paw and forcing the chart to move down.
Why do upward trends occur?
If you see a bullish trend on the chart, it means traders, investors and other major stock market players are optimistic about the future. That is, the positive in the market clearly outweighs the negative.
For example, official information appears that a number of countries are lifting restrictions due to Covid and airlines are resuming flights. What trend is most likely to emerge in the stock market of these companies? Bullish. Because business is “reviving”, everything is getting better.
Sometimes upward trends can literally arise from one piece of news. For example, news appeared that the Suez Canal was blocked by a container ship - a bullish trend immediately began in the oil market.
A bullish trend can also be the result of unfounded “hopes”. For example, why is Bitcoin constantly rising in price? Because everyone is talking about it, an increasing number of people are interested in it, and the “hype” around Bitcoin is only gaining momentum. It turns out to be a “bubble” that will burst sooner or later, but for now it is only expanding.
Advantages and disadvantages of trend trading
The concept of trend is one of the key ones in technical analysis on Forex and the stock market, where price behavior is graphically reflected and forecasts are made on its basis. The first thing a trader learns is to look for and follow a trend, because... this is his main income in the future.
Trend trading is the most common type of Forex trading. A well-known proverb among traders says trend is your friend, which means the trend is your friend. Trading in the direction of the current trend allows the trader to clearly determine entry and exit points from the market, extract maximum profit from price movements and minimize trading risks.
The disadvantage of trend trading is the individual perception of each trader. For example, lines of the same trend drawn by two traders may differ. As a result, one trader will observe a breakout of the trend line, the second trader will only see a touch.
The reliability of a trend depends on the size of the timeframe - the older the timeframe, the more reliable it is, but, accordingly, it takes much longer to form.
The popularity of trend trading has led to the emergence of a huge number of trend trading strategies and trend indicators.
Can an uptrend be considered part of a downward correction?
Yes, sure. Trends at different time intervals are “nested” into each other, like nesting dolls. And an upward trend on the hourly chart may look like a correction in a downward trend on the daily chart.
How should we feel about this? No way. If you trade according to trends, then you need to choose one time interval and work with it.
On the other hand, there are trading strategies that require taking into account several time frames simultaneously. For example, it will be possible to enter the market using such strategies only when the upward trend is on three time intervals at once - hourly, daily, weekly.
Rules for constructing a trend line
The use of a price trend is available to a trader only if he knows how to correctly draw a trend line. This is not difficult to do. It's all about practice and knowledge of the rules of such construction.
So, the trend line is drawn through significant extreme points. Lows are important for an upward trend. For the downward trend there are correspondingly highs.
There must be at least two such extrema. However, it is better if there are more minimums or maximums through which the trend line will pass.
What does the phrase “the bullish trend is broken” mean?
Analysts say the upward trend breaks in two cases:
- The momentum did not update the previous high.
- The correction broke through the level of the previous low.
That is, like this:
Or like this:
What could this mean? In the classical sense, such a “break” means the end of a bullish trend. After the break, either a flat trend or a downward trend begins.
But in reality, the market can calmly continue to go up, that is, the trend will “recover” after a break. Here the trend survived three breaks, but still went up:
Is it possible to make money on upward trends?
People who try to make money from trends and price fluctuations in general are called traders. Most trading strategies are based on trends - you need to find the main trend in the market and trade with it.
Every correction in a bullish trend is an opportunity to buy. Every impulse is an opportunity to make a sale and earn money.
For example, here I show with arrows where you can buy and sell a currency within a bullish trend.
To find the most accurate moments to enter the market, traders use various auxiliary technical analysis tools. For example, I used support and resistance levels, and besides them there are also indicators, Elliott waves, Gann fan, Fibonacci grid and much more.
But the problem here is that the bullish trend can end at any moment. A correction within a trend may turn out to be deeper than the trader expected, and the momentum may not be as strong. As a result, it becomes very difficult to determine where to enter the market and where to exit it. It turns out to be “guessing”.
For example, the price is going up. A correction begins, I open a bullish trade.
And the market is collapsing.
Similar situation. A neat and even trend. I'm opening up for a raise.
Collapse.
To make money on bullish trends, you need to be able to predict the future. It is necessary to predict when the impulse will end and a correction will begin, when a correction will turn into an impulse, or when an upward trend will change to a downward one.
Nobody knows how to do this. Therefore, none of the traders have become billionaires yet.
Application.
A trend can be used as an independent phenomenon, without relying on additional tools, or you can try to reveal hidden potential using a variety of techniques and methods.
The most popular is to use the trend as a fundamental part of graphical analysis. You can use simpler (in terms of logic) methods, such as trading from support and resistance levels, or go deeper into studying the variety of graphic models and patterns. The use of these techniques requires certain skills, such as: photographic memory, the ability to identify organized price patterns from many individual movements, and perseverance. Skillful use of your abilities, as well as the advantages of graphical analysis, can lead to amazing success.
Read: “What is support?”
The second option for using a trend is trading using technical indicators. There is even an item in the Meta Trader terminal that contains some of the instruments of this group. To insert them, you need to follow the path “Insert – Indicators – Trend”. But, despite its apparent simplicity, this method requires no less effort and skill.
You can often hear about various combinations of elements of graphical analysis with indicator analysis. And this has the right to life. As already mentioned, one of the most important factors for success is the ability to improvise and look at things outside the box. It is not possible to consider even in general terms all methods of trading using a trend within the framework of this material, but now you have the basis, and it is up to you to decide which direction to go deeper into.
What else to read and watch
I became disillusioned with trading. I used to believe in it and thought that you could make money from it, but now I don’t think so. I recently published an article “Is it possible to make money from trading” - please read it and think carefully before transferring money to an account for stock trading.
If my article doesn't convince you, let's do this. Here is a link to an article with trading courses, where free but high-quality materials are described at the beginning. Study them and try trading on a demo account. If you get a profit within a year, then I’m wrong and trading is a great way to get rich.
Here is an example of one of the lessons on trading in the foreign exchange market. You will find several more of these (not only for Forex, but also for the stock market) in my article.
Go ahead. I advise you to switch your focus from trading to investing. In this regard, I can also recommend you several useful things.
The first is free webinars on investments from Ak Bars. They are very interesting, fascinating and understandable.
There are also cool materials on the City of Investors project. Start studying them with these three books:
- How to become financially independent in 1 year. The book is about what steps every person should take to become financially free and independent in a year.
- 5 ways to effectively invest 1000+ rubles. Interesting material about investments that start with small amounts. The authors tell you what you can invest 500 or 1000 rubles in, what mistakes you should avoid and what income you can expect.
- 6 steps to financial security. What should you do to feel more confident financially and not be afraid of economic crises or unemployment.
And here are a few more courses:
- Passive income incubator. Course about investing in shares. Suitable for beginners. Teachers tell you how to generate stable passive income from stocks.
- Passive income automatically in 2021. This is a marathon that lasts for 10 days. It is practice-oriented, so you will not only study investments, but also invest money yourself under the guidance of a curator.
Something like that. I hope some of these materials are of interest to you.