Every trading day in Forex is a struggle between buyers (bulls) and sellers (bears).
Bulls are interested in rising prices, and bears are interested in falling prices. The end of the day depends on whose positions are stronger: buyers or sellers. But intraday fluctuations, high and low prices during the day also show how strong the position of market participants is. Bulls Power and Bears Power are two oscillators developed by Dr. Alexander Elder, a renowned stock trader who described these indicators in his book How to Play and Win in the Stock Market.
These indicators indicate the balance of power between bulls and bears. Accordingly, the strength of the bulls illustrates the behavior of an upward impulse, and the strength of the bears illustrates the behavior of a downward impulse.
Description of the indicator operation
The Bears and Bulls Power indicators are presented separately from each other in trading platforms, but are used only together. Bulls – shows the strength of the bulls (Buyers), Bears – bears (Sellers) on the period selected by the trader.
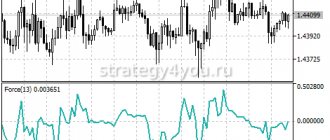
Alexander Elder determined crowd sentiment only on daily charts using an exponential moving average line calculated over a period of 13 days. The author explained the choice of indicator type by the presence in the formula of weighting coefficients that increase the contribution of current candles when calculating the average value of the period:
- The Bulls Power histogram column is calculated Bulls = High candles – EMA (13);
- The Bears Power histogram column is calculated Bears = Low candle – EMA (13).
Using the example of a falling daily candle, you can observe that positive values of the Bulls Power histogram are obtained when the High closes above the moving EMA, negative Bears Power values are obtained when the Low closes below the EMA.
A strong growing trend will “direct” the histogram bars above zero, and the closing of the High/Low candle above the EMA curve will correspond to positive values of both indicators. The end of the trend, that is, the moment the moving average crosses in any direction, will be equal to the zero value of Bears and Bulls Power.
Strength indicator of bulls and bears
Any financial market has a cyclical structure. The price movement constantly increases, after which it falls and the procedure is repeated again. Based on this feature in the movement of value in financial markets, 2 categories of users were identified:
- Those who open orders to purchase currency are bulls. Their impact pulls the price line up;
- Those who open orders to sell currencies are bears. Their impact pulls the price line down.
At its core, the cost graph clearly displays the confrontation between these two categories of users. These indicators are the basis for many working algorithms that generate ready-made signals. The popular T3MA Alarm tool works based specifically on confrontation between buyers and sellers.
Knowing who exactly is the strongest at the current moment in time, the user will be able to effectively enter trade in the direction of the prevailing group and make a profit on strong price movements. However, how can you determine who exactly dominates the market - buyers or sellers? For this purpose, many special technical algorithms have been created, one of which is the tool in question.
At its core, the program in question represents two opposing tools. They were developed by a very famous speculator in the trading community, Alexander Elder. The main function of both indicators is to analyze the currently available ratio of orders to buy and sell a currency. This information will allow the trader to accurately determine the moments of reversal of the main price trend, with the help of which it is possible to enter into trading profitably.
The functionality of these algorithms is based on two main principles:
- The first of them is that the price constantly reflects the current balance of power of all market participants, which can be visually represented on the chart in the form of a regular moving average line;
- The minimum value of the value within a trading day reflects the maximum strength of users trading to sell the currency.
The indicators under consideration belong to the oscillatory type. They are purely technical tools: this means that “Bulls Power” and “Bears Power” differ from the usual algorithms for finding the trading volume of certain orders in the market. An example of a typical tick algorithm for finding volumes is the MFI indicator, which is also designed to work with the strength of market participants. The main difference between these instruments is that the indicator in question calculates its readings only based on the historical dynamics of price changes.
An important aspect of working with indicators is that they are used only in combination with other technical analysis algorithms. When used standalone, Bulls Power and Bears Power are not as effective as when combined with any tools that determine the current market trend. The most obvious example is the moving average line, which perfectly complements these tools.
With the help of moving moving averages, the user will be able to conduct financial transactions in the direction of the current market trend and exit trading as late as possible, right before the next trend reversal. In this case, the trader will be able to receive the highest possible profit due to a very early entry into the trade and a very late exit from it at the moment the price has passed the distance of the maximum number of profit points.
Using the indicator in trading
Alexander Elder strongly recommended using the Bears and Bulls Power indicators as part of trading systems, as well as trading only according to the trend determined using the “Three Screens” method.
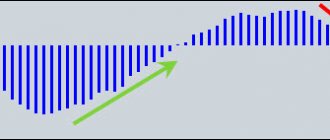
As an example of a separate application of indicators, we can take the early entry detection system. It is based on the divergence of strength between bulls and bears, which often occurs when a trend changes, when one of these groups makes an unexpectedly large effort to reverse the previous movement.
In the chart below you can see a downward trend, which ends with a sharp growth impulse that caused the Bulls bar to move into the positive area. Despite the increase in the strength of the bulls, the histogram bars of the bears also continue to grow.
The resulting divergence gives a Buy signal on a currency pair because important conditions are met:
- Both indicator bars were in the negative zone before the divergence;
- The Bulls histogram crossed zero from bottom to top.
Below are implicit divergence signals for a Short position. Both histograms were in the positive zone for a short time before the divergence occurred; the two Bulls bars have equal values when they diverge.
Classic entry signals based on Bears and Bulls Power signals are a set of rules from the author of the indicators described in the book “How to Play and Win on the Stock Exchange”.
A Long position is opened at the market price provided:
- Positive slope angle of the moving EMA (the larger the better);
- Bears are in negative territory but rising consistently;
- The bullish histogram has made two consecutive highs in the positive zone.
A Short position is opened at the market price if the following conditions are met:
- Negative slope angle of the moving EMA (the larger the better);
- Bulls are in positive territory and falling;
- The bears' histogram has established two consecutive lows in the negative zone.
During the period of protracted trends in the market, Alexander Elder proposed building a pyramid of transactions, increasing the position along the trend:
- By adding Buy orders whenever Bears Power returns to the positive zone after a series of negative histograms;
- By adding Short orders each time the Bulls indicator crosses the zero line from top to bottom after a series of histograms in the positive zone.
The indicator of the strength of bulls and bears is an oscillator, which implies the presence of divergences - discrepancies with the quotes of currency pairs. They are interpreted as a possible end of a trend or appear before flat zones.
If there is a downward trend on the chart, then a search for discrepancies is carried out using Bears Power, comparing the new exchange rate lows with the histogram readings. This means that the bears are “exhausted” and give bullish speculators a chance to profit from an upward correction by reducing the volume of shorts.
Divergences for a growing trend can only be confirmed on the Bulls Power indicator. The bulls do not have enough volume to continue the movement, which affects the decrease in the range of the candles. This is the moment for a downward correction or a full trend reversal if the bulls do not want to buy out the local “drain”.
Money management strategy consists of the traditional placement of protective orders slightly above the nearest highs or lows for all strategies, the only difference is in position management. Entering on divergences of two indicators between each other or between quotes implies short-term transactions lasting one or two candles.
If the trader continues to hold the position in profit, the stop loss should be placed at breakeven at the first positive close of the candle or look for the opportunity to close the position at the entry price if the current loss occurs after two working time frames.
Conclusion
The Elder ray indicator measures buying and selling pressure in the market. Using its two components - bullish and bearish force - you can put into practice a system for generating trading signals.
When using indicators, you should ensure that their frequency is set equal to each other so that data can be compared between bull and bear components.
Likewise, if an exponential moving average is used to enter trades in the direction of the overall trend, the frequency of the EMA should match the frequency of the indicators.
The Elder Ray tool performs much better on a daily time frame or higher since it is based on daily highs and lows.
Happy trading, dear readers of 1-consult.net!
Bears power indicator
Directly on the trading chart, these instruments are displayed in the form of histograms placed in separate windows for maximum clarity of display of trading data. Histogram data columns are calculated by finding the difference between the moving average line constructed by the exponential method and the value of the current time candle: its minimum point for a bearish indicator or its maximum for a bullish one.
The resulting indicators are divided by 100 and, in the resulting form, are plotted directly on the histogram. An example of the finished construction of both histograms is shown in the image below. For clarity, both tools have different column colors:
- The red histogram is responsible for the readings of the sellers indicator;
- The blue histogram is responsible for the buyer indicator readings.
Let's sum it up
These are pretty good indicators, but when trading using them, be sure to take into account that in the market volumes, not the number of traders, are responsible for price movements in one direction or another. You have probably already heard the expression that only 5% of all participants in the market constantly win, and as a result, the remaining 95% lose.
Based on this, we can assume that the crowd is often wrong, so if you see an excessive preponderance of the indicator readings, then think carefully before opening a trade. Check whether there is a level below or above the price, whether the price has a “Move”, that is, whether it can move somewhere or whether it has hit resistance. In general, weigh all the pros and cons and, of course, do not forget about ordinary human logic.