Hello, gentlemen, traders and subscribers of our Forex portal! Today we will look at the classic trading system “Elder’s Three Screens”, developed by the famous trader Alexander Elder back in 1985. This strategy remains relevant today. It can be used as an additional filter to determine the trend in your strategy, or as an independent trading system. As practice shows, the “Elder’s Three Screens” strategy works in the stock, foreign exchange and commodity markets. This strategy is based on filtering trades on a higher timeframe and determining accurate entries on a lower timeframe, which provides an excellent opportunity to take high goals with minimal risks for your deposit. The advantage of this strategy is that it is easy to learn, easy to use, and versatile in application. See also which Russian Forex brokers are considered the most reliable.
The principle of operation of the stable trading strategy Elder's three screens
Elder's stable three-screen trading strategy was first proposed by the author himself back in 1986 in the Futures magazine. Alexander Elder claimed and continues to claim that he has never seen a more stable strategy than his brainchild, not on the Forex market, not on the stock market.
The foundation on which the system is based is filtering trading signals on three different screens. Those cases in which all three screens give a positive answer will be the strongest moments in the market for making a trade transaction.
The strategy uses three different timeframes, where the senior timeframe is used to determine the dominant trend, the second screen works to identify a correction, and the third screen is used to enter at the best price. The stability of the strategy is achieved by filtering signals and entering a position at moments when the price chart on all three screens is directed towards the dominant trend.
Analyzing various markets, Alexander Elder came to one important conclusion:
Within a large global trend, rollbacks in the opposite direction are inevitable, which contradict the main trend, but they will inevitably steer in the direction of the main trend.
In other words, Elder's three screen method suggests:
- Identify the main (global) trend.
- Find confirmation on the working timeframe in the direction of the main trend.
- Try to enter a trade on a lower timeframe in the direction of the main trend.
Setting up the low interval
The lower interval is used to catch the price impulse at which a deal can be opened. The signal will be an impulse directed in favor of the main priority trend, which we have identified on larger time intervals. Experienced traders often do not set indicators for this interval, determining the impulse by eye. For clarity, a beginner can use some kind of trend indicator, for example, Parabolic Sar?
Elder's algorithm for choosing a suitable timeframe
The age-old question: “Which time frame is best to trade on?”
Elder approached this issue in a unique way. If many people suggest choosing a specific time frame depending on your trading preferences and working only on it, then Elder says, choose a working time frame and two additional ones that will help you make the right decision.
In his books, Elder repeatedly mentioned his personal trading style. As you know, he is a long-term planner and uses charts W1, D1 and H4, but does not make a strict connection to his decision. For this reason, he quite clearly explains the principle of choosing time frames.
One of the tips is: “When choosing time frames, a stable strategy should adhere to the “rule of five”,” in some publications called “factor 5.” In practice, the choice of time frames for a three-screen system looks like this:
- Based on our trading principles, we choose a base timeframe.
- The chart with the higher timeframe should be five times larger than the base one.
- A chart with a lower timeframe should be five times smaller than the base one.
Let's sum it up
This strategy itself is not a complex system; it is easy to understand and easily customizable for a trader of any rank. The trader makes the choice of instruments independently, taking into account the specifics of their functions - the strategy does not have a strict framework.
The most difficult thing when working with three screens is to identify in time on the first two screens the conditions necessary to move to the third screen. It is even more difficult to have time to open a position and place the necessary orders in conditions of constantly changing prices.
You also have to understand that this strategy was invented 30 years ago. It may not be able to compete with newer, more modern and stable systems. Whether to use it further or not is an individual matter. If we remember once again about the “safe with a lot of money”, then “there is no trick against scrap.”
Interpretation of signals from indicators by Alexander Elder
Depending on the circumstances, A. Elder suggests using several indicators that can help in trading. In one of the sections of my website, I describe how to use this or that indicator, but Elder has his own vision. In this section of the article, we will quickly look at exactly how Elder uses indicators: MACD, MA, Stochastic, RSI.
MACD function in Elder's three screen strategy
The MACD indicator performs one of the most important functions in Elder's Three Screens strategy. The standard interpretation of MACD signals was outlined here, these are divergence, convergence, crossing the zero mark, etc., but Elder did not take into account the well-known principles, but used his own signals.
The default settings are:
- Fast EMA - 12;
- Slow EMA – 26;
- MACD SMA - 9.
But the signal line is not used as a current line, so you can set the parameter to 1 or make the line color similar to the screen background so that it is not visible.
Alexander Elder draws attention to the histogram bars. The strongest signal that indicates the presence of a bullish movement is:
- The location of the histogram bars is below the zero mark.
- The current bar has a higher value than the previous one.
The strongest signal that indicates the presence of a bearish movement is:
- The location of the histogram bars is above the zero mark.
- The current bar has a value lower than the previous one.
Using the standard MACD, available in the MT4 arsenal, makes the task a little more difficult, especially if the chart is significantly reduced. It’s trite, it’s not possible to see the location of the columns, but there is a way out.
I found the MACD Color indicator on the Internet, which paints the bars with different colors. If the current bar has a value greater than the previous one, the bar color turns green. If the current bar has a value less than the previous one, the bar color turns red.
Using MACD Color, you can immediately determine if the histogram is red, then a bearish trend prevails, if green, then a bullish trend prevails. Also, you should pay attention to the green bars above the zero line and the red bars below the zero line. Elder says these signals can also be used to classify a trend.
In a three-screen trading strategy, the MACD indicator provides a preliminary signal that requires further confirmation.
MA function in Elder trading system three screens
The moving average is used in a standard way. It is used as a trend indicator that shows the presence of a trend using the following algorithm:
- When the moving average is directed upward, it is considered that there is a bullish trend in the market.
- When the moving average is pointing down, it is considered that there is a bearish trend in the market.
You can use absolutely any settings. It doesn’t matter what type of moving average is used here, the main idea is to trade in the direction indicated by the indicator. You can choose a period from 28 and above, but not too long, because the longer the period, the less likely it is to catch a trend reversal.
Elder suggests using the MA in conjunction with the MACD. When the signals of two indicators converge, the signal strengthens, but in practice, this happens extremely rarely and you still have to trust the signals of one of the two indicators. More details about MA are described in the article Moving average | The best indicator for trading on the Forex market.
In a three-screen trading strategy, the MA indicator provides a preliminary signal that requires further confirmation.
Stochastic function in Elder's three-screen strategy
The Stochastic indicator belongs to the category of oscillators that can indicate the best trend reversal points. A common method used in trading is used, trading from oversold and overbought zones.
The indicator settings should be used as default:
- Period %K - 5;
- Period %D - 3;
- Slowdown - 3.
In addition, the indicator contains: an oversold zone (the area below 20%) and an overbought zone (the area above 80%).
From the description of the indicator, we should know that if the signal lines are in the oversold zone and turn upward, this signal can be interpreted as a bullish moment, if the signal lines are in the oversold zone and turn downward, this signal is bearish. You can read more about the indicator here.
Force Index function in Elder's three screen strategy
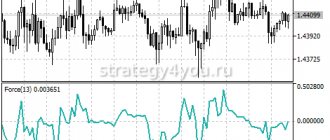
The Force Index (FRC) indicator was developed by Alexander Elder himself and indicates the strength of bears or bulls at the corresponding points. For the indicator, you should use the default settings, namely a period of 13 and the MA Simple method. These settings help the index identify changing trends.
- If in a bull market the Force Index falls into the negative zone (falls below the zero line), we receive a buy signal.
- If in a bearish market the Force Index rises into the positive zone (rises above the zero line), we receive a sell signal.
It is logical to assume that if during a bullish trend, the indicator shows maximum values, this means that the bulls are extremely strong. But does this mean that you should buy at any price? Of course not, most likely the market is already overbought and there is a high probability of running into a correction. The same goes for a bear market.
According to the logic of Alexander Elder, each of the indicators is quite strong, but only at a certain point in time. The use of all indicators in combination filters out the maximum number of unprofitable transactions, which elevates the three-screen system to the rank of stable strategies used in Forex.
Setting up terminal windows for working on the Elder three-screen trading strategy
It would be quite funny if Dr. Alexander Elder suggested using all the indicators listed above on a specific chart. I hope you remember the picture where traders push the maximum number of indicators, behind which the price is not really visible. I always have a question: “What do you see there? Where is the price?
Elder did not make traders laugh and gave each indicator a specific task, on a specific timeframe.
As you remember from what was described above, we needed to select three windows with different timeframes: senior, working and junior timeframes. If you have done this, now you need to correctly place the indicators. In my case, I will use D1, H4 and H1, see how you need to arrange the indicators.
Setting up the first screen
The first screen will be the screen where we will place the chart with the higher timeframe. This work area will serve the most important purpose, to determine the prevailing trend.
Open the daily chart and add indicators: MACD and MA.
The best opportunity to enter a trade is at points where the trend changes from downward to upward and vice versa. We need to track the moments where the indicator changes the color of the histogram from green to red to try to catch a downward movement and from red to green to catch the beginning of an upward movement.
After the signal of interest has been received, go to the next screen.
Setting up a second screen
The second screen is our working timeframe. At this stage I'm a little confused with the indicators. Elder suggests using Force Index and Stochastic, just on the second screen. Here you need to get a second signal to enter a position, but using two indicators at the same time personally confuses me.
Based on this, I decided to use one of the indicators, namely Stochastic, since its signals personally seem more reliable to me.
Setting up the third screen
The third screen is used to select the ideal point to enter a trade. A stable strategy is distinguished by one important point: short stops and entries in the direction of the prevailing trend.
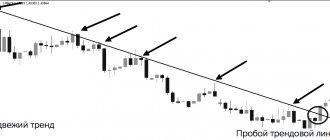
Elder's three-screen system suggests monitoring levels on a lower timeframe and working on their breakout. It is for this reason that the third screen should be left without indicators so that it is clean and nothing distracts our attention from the main one.
Trading signals for a stable strategy Three Elder screens
Now that most of the stable strategy should be clear, when you have chosen the time frames of interest, dealt with the signals from the indicators and configured the window in accordance with the requirements of Alexander Elder, it is time to move on to the most interesting part, the entries and exits, or rather, profiting from the received knowledge.
Using the example of the EURUSD currency pair, I want to show one of the last moments in the market, in which a buy transaction is clearly worked out.
Conditions for opening a Buy order
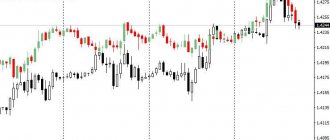
Market analysis when using any system begins with the senior chart. In the three-screen method, Elder also insists on examining the senior chart to identify the trend. In the screenshot below, the chart is divided into areas, where green indicates purchase areas, and red indicates sales areas.
You need to act as follows: after a trend is detected on the senior chart, you need to work only in its direction, ignoring opposite signals. In our case, the market is in the green area, which signals the presence of an upward movement, which means we will only consider purchases.
In the next window, we are interested in signals from the oscillator and Force Index. Based on the fact that an upward trend has been determined, you need to wait for the moment when either the Force Index drops below the zero line, or the Stochastic oscillator is in the oversold zone and begins to rise upward.
In the screenshot below you can see that a signal was received from Force Index. The indicator line has dropped below the zero line, which signals the best area to open a buy, but it is too early to enter into a trade.
As for the oscillator, this time it did not give a buy signal. Most likely, it is for this reason that Elder suggests using these two indicators in conjunction, focusing either on the signal of one or on the signal of the other indicator.
When you receive confirmation of a purchase from the second screen, you can go to the third, where we will look for the best point to open a Buy order.
In most cases, we will work with pending orders (read more about them here). On this chart you need to focus on local maxima and minima.
There are known systems where breaking a local maximum or minimum already gives a signal to enter a position. It is believed that since the last local level did not hold, it means the market mood has changed and transactions should be opened in the opposite direction.
Apparently impulse trading is well known to A. Elder and he adheres to the same principle, and precisely for this reason, the breakdown of the last local level in the direction of the dominant trend is the best place to enter a trade. This is exactly the situation shown in the screenshot below.
Conditions for opening a Sell order
The conditions for opening a Sell order using the three-screen strategy are similar to the conditions just discussed for opening a Buy order, only in a mirror image.
- On a higher timeframe, using the MACD or MA indicators, we find areas with bearish priority.
- On the second screen, we wait for the Force Index indicator to be in the positive zone (above zero) or for the Stochastic oscillator to start going down from the oversold zone.
- On the third screen, you need to find the last local minimum and set a SellStop breakout order.
Optimal StopLoss setting level
Once again I am convinced that stoploss is very important, but often, even by professionals, the place for its installation is chosen in an extremely predictable manner. One could write a whole poem why this is so, but the main idea would only be that when the stoploss level is broken, the picture of interest changes. Since the picture has changed, this means that the balance of power could well have changed, therefore, such a deal should be exited as quickly as possible.
Alexander Elder, like many traders, adheres to the rule of setting a stop behind the nearest minimum for buying and the nearest maximum for selling.
How to take profit using the Elder system
If everything is very clear with the stop, then TakeProfit is an extremely unpredictable thing. You can use one of the following methods proposed by the author:
- Set takeprofit from the ratio to stoploss as 1 to 3, 1 to 4 is also allowed.
- Use a trailing stop and tighten the stop until the market itself reaches it.
- Use the working window, namely Stochastic: when buying, close the deal when the oversold level is reached; when selling, close the deal when the overbought level is reached.
In addition, you can resort to one of the proven methods that I described in the article The best methods for maintaining positions in the Forex market.
Examples of transactions using the Alexander Elder Three Screen system
In conclusion, I would like to show two examples of how the three-screen Forex strategy is practiced in the Forex market. For ease of perception, I tried to compress all three screens as much as possible and display them in one screen. In the first case, an example of a buy transaction is presented, in the second case, an example of a sell transaction.
Finally, let's collect all the information received into one. So, for the three-screen strategy to consistently generate profit, you need to:
- Using the rule of five method, select three time frames for one trading instrument.
- Set MACD and MA on the first screen (higher timeframe). Install Force Index and Stochastic on the second screen. On the third screen (lower timeframe) leave a blank chart.
- Using MACD or MA, determine the dominant trend on the older time frame.
- In accordance with the main trend, receive a confirmation signal in the same direction from the second screen from the Force Index or Stochastic indicators.
- On a junior time frame, place a breakout pending order in the direction of the main trend.
- Set StopLoss and TakeProfit.
Would you say everything is simple in history? I will answer, everything ingenious is simple, the main thing is to know what to look for and be able to take advantage of the earned experience gained in trading. It was not for nothing that Elden called his brainchild the stable trading strategy Three Screens of Elder, because he himself has been trading and making money using it for several years now. According to the author, the strategy considered is the most stable trading system.
I think I presented the information on the three-screen system in the most comprehensive form possible. I admit that some points remain unclear, but I’m not against communication. Ask. Ask your questions in the comments, we’ll figure it out.
What is important to know
The main task of a trader is to determine or predict where the price is moving . It depends on this whether he will be profitable or remain at a loss. There is no great trade secret “closed sealed”. Many books on trading have been written about how to trade correctly and track the direction of the market. All trading instruments are described, and many trading strategies, simple and complex, have been developed for traders.
The simplest modern systems include, for example, the “Sniper” trading strategy. It is so easy to understand that even a beginner can use it to increase their deposit by at least 57%. You can get it for free from Forex Academy using the link:
Get the complete Sniper special course for free using the link
One of the trading classics is the trading strategy proposed in 1986 by the famous financial exchange guru, Alexander Elder . The strategy, known in the world as “Elder’s Three Screens”, according to those who use it, can bring 250 points of profit from one transaction. I think we should talk about it to figure out whether it is really as good in practice as it is described?