The strength of an asset's movement is characterized not only by its price, but also by the actual volume of completed transactions. A new generation technical indicator, the Force Index, allows you to take into account both price dynamics and trading volume when researching. The indicator identifies favorable entry points and potential targets for opening positions.
Description of the indicator
The three components of the Force Index are the main components of market information: direction of price change, size of price movement and trading volume. According to the author, when the Power Index is smoothed by moving averages (MA), the result of these measurements can accurately determine significant changes in the balance of power between bulls and bears. It is believed that the Force Index is one of the best indicators that combine price and volume indicators into a single value.
The combination of all three values is presented in numerical and graphical forms and allows you to determine the strength of the bulls during an upward movement and the strength of the bears during a downward movement. The greater the difference in prices and the greater the number of transactions, the more significant the power. If the current bar closes at a price higher than the previous one, then the force is positive. If it is lower, then the force is negative. In fact, the difference between the current price and the previous close is determined to identify the predominance of a group of buyers or sellers. For more accurate information, trading volume is used.
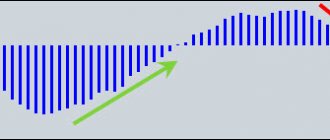
Typically, truly powerful trends begin not only with a breakout of the previous price range, but also with increased volume, confirming the determination of professionals to act in the direction of the trend. Confirmation of the upward trend is the growth of the 13-period moving indicator to a new high. If the Force Index indicator has reached a new high, then this most likely indicates a continuation of the upward trend. If there are lower highs on the 13-period moving force index that soon cross the center line from top to bottom, this indicates a weaker uptrend and less intense price growth. In this case, buyers give way to sellers.
If the trading volume is small, that is, prices change by inertia, without the injection of funds by professionals, and such a trend will not last long. At the same time, the strength index changes slightly, showing that the group of participants who formed the current close is not that strong.
How to use force index
For optimal trading results, use fast and slow indicators simultaneously. The slow force index allows you to assess the overall dynamics of an uptrend. Quick indicator readings reveal profitable entry points into the market.
The patterns are as follows:
- If the indicator from the negative area makes a reversal towards the trend, it makes sense to open long positions.
- If the indicator forms a peak above the center line, this serves as a signal to start selling.
Current Trend Definitions
To determine the tendencies of the current trend, indicators of the Force Index Trend Direction indicator are used.
Its continued presence above the zero line indicates optimism in the market regarding the upward trend and the predominance of buyers. On the contrary, its fall into the negative area indicates a downward trend and the dominance of sellers.
Fluctuations in index readings around zero demonstrate uncertainty in the market. At this time, it is recommended to refrain from both purchases and sales.
Determining the strength of a trend and the likelihood of its completion
The nature of the dynamics of the slow index allows us to draw conclusions about the strength of the movement.
If the EFI indicator forms highs while being in the positive area, this indicates the stability of the upward trend and an increase in the strength of the movement. This trend is assessed as stable and further price increases are expected with growing trading volumes.
A decrease in Force Index indicators against the backdrop of rising prices demonstrates a decline in interest in the asset from market participants. At the same time, the probability of a reversal in the trend dynamics or its consolidation increases.
The farther the chart is from the zero line, the stronger the trend and the clearer the current trend.
Signals for transactions
Local retracement points are the most favorable moments to enter the market. To find them, both fast and slow force indexes are used.
Short-term index trading
A decline in the fast index in an uptrend marks favorable moments for buying, and a rise in the upward trend in a downtrend marks favorable moments for selling. When the indicator moves down and goes below the zero line, you can buy additionally. Every time he overcomes it, moving upward, it is profitable to make additional sales.
Reaching monthly peaks by the indicator, whether minimum or maximum, indicates the stability of the trend and the strength of the position of any of the market parties: buyers or sellers.
Trading with a medium-term index
A slow index demonstrates long-term trend prospects.
If the indicator grows, updating daily highs, it means that the dynamics of the uptrend are stable. This is a signal to buy. Making decisions on any type of index corresponds to the trader’s chosen trading strategy. With a short-term strategy, sales and purchases occur immediately when the indicator crosses the zero line. A long-term trader closes positions only when there is an obvious reversal or when there is a clear divergence between the index and the trend.
Defining local rollbacks to add to an existing position
Local pullbacks are the most favorable entry points into the market. A quick index helps identify them.
You should start buying if you have the following indicators:
- If the trend indicator confirms an upward trend.
- The indicator goes down, crossing the zero line.
- The indicator creates a local minimum, indicating the completion of the rollback.
The same patterns apply to short positions. You need to enter the market if the fast index marks a maximum in the positive area and turns towards the global trend.
Signals to close a position
Local peaks in the fast index also allow you to determine the optimal time to close positions.
The formation of a peak in the positive area in an uptrend demonstrates a short-term drop in market participants’ interest in buying. This is the right time to close a long position. On the contrary, a peak at a low in the negative area and a subsequent reversal of the fast index warns of a correction in the future. This means that it is time to close sales transactions.
Divergence signals
Divergence (divergence in indicators) occurs when price dynamics drop to another low, but the indicator continues to move up. This indicates an imminent reversal and termination of the current trend. It makes sense to start buying if the data is confirmed by other technical analysis tools. On the contrary, an increase in price, accompanied by a decrease in index indicators, is a signal to start selling.
- An example of another strategy - Calm Market:
Indicator history
Russian emigrant to the USA Dr. Alexander Elder, one of the most respected traders in the world, is a fairly famous creator of a new generation of technical indicators. One of its indicators is the Strength Index.
He described his ideas in a book that became a bestseller - “How to Play and Win on the Stock Exchange.” The indicator is considered relatively new, not entirely classic, since the book was published in 1993.
Calculation and formula of the indicator
The strength of each market movement is determined by its direction, magnitude and volume. If the closing price of the current bar is higher than the previous one, then the force is positive. If the current closing price is lower than the previous one, then the force is negative. The greater the price difference, the greater the power. The greater the volume of transactions, the greater the power.
FORCE INDEX (i) = VOLUME (i) * ((MA (ApPRICE, N, i) – MA (ApPRICE, N, i-1)), where:
FORCE INDEX (i) — Force Index of the current bar; VOLUME (i) — volume of the current bar; MA (ApPRICE, N, i) — any moving average of the current bar for N periods: simple, exponential, weighted or averaged (smoothed); ApPRICE — applied price; N—smoothing period; MA (ApPRICE, N, i-1) — any previous bar.
Thus, the Force Index is calculated by subtracting the previous closing price from the current one and multiplying the result by the volume (in forex this is tick volume). If the closing price of the current period is higher than the closing price of the previous period, then the market strength is positive. If the closing price of the current period is less than the closing price of the previous period, then market strength is negative. It turns out that the magnitude of market strength is determined not only by the direction and magnitude of the movement, but also by volume.
The greater the volume with the same difference between the current and previous prices, the greater this force in absolute value. It turns out that both a strong change in price on small volumes and small changes in prices on large volumes can lead to the same change in the value of the Force Index.
Limitations of using the Force Index
The Force Index is a lagging indicator. It uses previous price and volume data and then this data is used to calculate an average (EMA). Since the data is usually averaged, it can sometimes be slow to provide trading signals. For example, it may take a couple of periods before the Force Index begins to rise after a breakout to the upside, but by this time the price may have already moved significantly beyond the breakout point and thus can no longer justify an entry.
The short-term Force Index (such as 10, 13, and 20) creates a lot of variance because even a moderate price movement or increase in volume can cause large swings in the indicator. A long-term force index (such as 50, 100, or 150) will not fluctuate as much, but it will be slower to respond to price changes and will be more retarded in providing trading signals.
Disadvantages of the indicator
Before we begin to analyze the use of the indicator for real trading, it is necessary to discuss the main disadvantage of the Force Index. Since the Elder Strength Index uses transaction volumes in its formula, the Force Index should be used with caution when applied to currency pairs. The fact is that in the original the force index uses trading volumes in its calculations, which for the Forex market are replaced by tick volumes.
Due to the decentralized nature of the Forex market, each trading platform has its own trading volumes and, naturally, no one collects these volumes together. The only thing we can know for sure is the number of transactions themselves, that is, tick volume. But the number of transactions and the actual volume are two different things, because 10 completed transactions with a lot of 0.01 are not at all the same as 10 transactions with a volume of 100 lots. Therefore, there are often situations when tick volumes do not coincide with real ones and therefore the Force Index “fibs” a little relative to the Forex market.
Money management
As one of the main tools for trading on the stock exchange, which directly affects the success of your work, money management helps you quickly and easily achieve the best results in options trading. It is this concept that trading beginners should first become familiar with. He is also an indispensable assistant to professional players, helping them realize a stable income.
Minimum capital : when trading options on the stock exchange, it is recommended to bet on the acquisition of an asset with a minimum capital; in this case, the value of the asset does not exceed 5% of the account size; It is worth trading inexpensive options, the purchase of which does not significantly affect the size of the deposit in case of a losing trade. By trading options using these rules, you will save your money as much as possible.
Minimum deposit : when trading options on the exchange, it is recommended to trade such transactions that maintain a positive deposit status; when buying a specific asset, do not transfer the entire deposit to it; on the contrary, try to work with your deposit so that it lasts for a long time, allowing you to trade and earn even more. By trading options using these rules, you will save your deposit for a long time.
Minimum options : when trading options on the stock exchange, it is recommended to first buy a minimum of assets, for example, 3; this applies more to new exchange players who have no trading experience; later, having become more experienced, you can easily increase the number of transactions, but then you will be more confident and experienced. By trading options using these rules, you will become more productive.
Minimum of emotions : when trading options on the stock exchange, it is recommended to always start work with a serious positive attitude; It is worth remembering that successful options are your clear, informed decisions based on analytics; Here, only successful trading experience will not be enough; it is the emotional part that can bring good income or, conversely, deprive you of it. By trading options using these rules, you will achieve much more in trading.
Using the indicator
As for the use of the Power Index indicator, it is quite multifaceted. In this case, two indicators with different periods are mainly used for analysis:
The two-day exponential moving average of the Force Index is used to determine the strength of buyers and sellers in the short term, while the 13-day exponential moving average is used to analyze the medium-term trend.
Force Index Settings
The indicator itself is preinstalled in the MetaTrader terminal and is located in the “Indicators -> Oscillators” menu tab.
When you open it, the settings window looks like this:
That is, you can choose the calculation period, the averaging method for the moving average, the price on the basis of which the calculation will be made, and the design style of the indicator.
Signals for determining the current trend
We can determine long-term changes in the strength of buyers and sellers using the 13-period moving average of the Strength Index. The Long Period Strength Index indicates buyer dominance when above the center line. When it is below zero, sellers are stronger.
If the 13-period indicator fluctuates around zero, then most likely the market is not trending, so you should not rely on trend indicators, which, as a rule, give false signals in such a situation.
MFI indicator in the MT4 trading terminal
In order to attach an indicator to the chart of a financial instrument in the Metatrader4 trading terminal, just select this chart and then go through the menu tabs: “Insert” – “Indicators” – “Volumes” – “Money Flow Index”.
After this, you will see the following settings window in front of you:
As a matter of fact, from the settings of the indicator itself, you can only set its period. In addition, you can, if desired, change the parameters of the line displaying it on the graph (namely: color, thickness and type).
In most cases, when using the cash flow index in practice, the oversold and overbought levels are used - 20 and 80. They are set by default in the “Levels” tab of the settings window.
If you want to change them, you just need to double-click on them with the mouse and enter new values. And if you need to add a new level, then click the “Add” button and set its value (in the range from 0 to 100).
And finally, you can set the indicator to be displayed only on certain chart timeframes. To do this, go to the “Display” tab. For example, by default there is a checkmark in the “All timeframes” section. In this case, the indicator will be displayed on each of the selected time periods of the chart of the specified financial instrument.
And if you uncheck this box and put it, say, in the box next to item D1, then the indicator will be drawn only for the daily chart.
Signals for determining the strength of a trend and the likelihood of its completion
The Force Index can indicate the end of a trend:
- The end of an upward trend when the indicator sign changes from positive to negative and the price and indicator directions diverge;
- The end of a downward trend when the indicator sign changes from negative to positive and the directions of price and indicator converge.
If the Force Index indicator shows a sideways movement, this indicates that the price change on the chart of the period under study is not confirmed by a fall or increase in trading volume, which can be interpreted as the likelihood of a reversal of the current price trend. Also, a trend reversal can be indicated by a sideways movement of the indicator, during which there is a high trading volume and a slight change in prices.
When the 13-period moving average of the Force Index reaches a new high, the uptrend can be considered confirmed. This behavior of the indicator means that the current movement is strong, and prices will continue to rise on large volume. When an uptrend begins to lose momentum, prices either rise at a slower pace or the rise occurs on much thinner volume. In this case, the 13-period moving force index makes lower and lower highs and eventually crosses the center line from top to bottom. This will be the final signal that the upward trend has exhausted itself.
In general, we can say that the further the indicator readings are from the zero mark, the stronger the current trend.
Options and setup
In addition to the color scheme, the standard Force Index configuration option offers you to select the number of bars for calculation, price type and averaging strategy method; The indicator is located in an additional window under the price chart.
Parameters and general view of the Force Index indicator.
Click the button to go through the step-by-step guide to “Force Index” and master the indicator in a few simple steps Explore »
The traditional representation is in the form of an oscillator with a zero line, although Elder proposed the original in the form of a histogram.
The author's version of the Force Index in the form of a histogram.
Elder's recommendations for the parameters of the EMA indicator are still considered optimal: parameter 13 (“long”) allows you to use the Force Index as a trend trading instrument, parameter 2 (“short”) exhibits impulse properties in it. Smoothing periods greater than 20 allow you to track a long-term trend; decreasing the smoothing parameter makes the indicator more “sensitive”.
Examples of Force Index with different parameters.
Signals for transactions
When used in conjunction with the short Force Index and other trend-following indicators, its effectiveness can be significantly increased. For example, when using any other trend-following indicator to identify an uptrend, the best buying points can be found when the two-day moving average from the Force Index is falling. When another trend indicator shows a downward trend, the rising two-day moving average from the Force Index will indicate the best time to decide to sell.
To find a short-term pullback within a rising trend, wait for the Force Index's two-day exponential moving average to move into negative territory. This point, which is likely to be a local minimum of the medium-term trend, is ideal for buying.
You can place a pending buy order just above the high of the candle, at which the 2-day moving average from the Force Index went into the negative zone in the presence of a strong uptrend. In this case, you will be protected in case prices fall because your order will not be filled, on the other hand, if, as expected, the uptrend continues, the order will be filled and you will have a position in the direction of the strong uptrend.
Practical use
In real systems, the Force Index indicator is used with trend additions, which must necessarily confirm the entry point along the trend and the closing point during a quick reversal.
Scheme of trading signals Alligator + Force Index.
When using oscillators with different types of calculations, stable systems are also obtained, but then the Force Index performs the task of a trend indicator.
Scheme of trading signals Force Index + Stochastic.
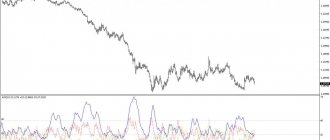
If you follow the trend using classic moving averages, then the Force Index does an excellent job of controlling volumes, and the entry point is confirmed by a standard oscillator. This scheme works only on medium-term timeframes, from H4 and higher, so that the indicators have time to compensate for mutual lag and correctly use tick volumes.
An example of using Force Index complete with EMA and Stochastic.
Signals to close an existing position
For deciding when to exit a long or short position, the two-day moving average from the Force Index is critical. If a short-term speculator buys when the two-day moving average from the Force Index is in negative territory, he should accordingly sell when it turns positive. If a trader enters a short position when the indicator is in the positive zone, he should close the position when the moving average turns negative. Thus, it is possible to catch local extremes for the most profitable exits from an existing position.
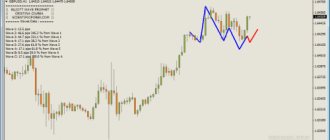
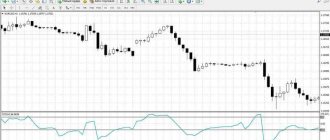
The figure above demonstrates just such trading. We have determined that the long-term trend in the market is bullish. We then use the intersections of the 13 and 21 EMA to identify periods of short-term upward trend. And the entry signals themselves are generated when the Force Index at the close of the daily candle falls below the zero line. Exit is carried out at the close of the daily candle if the Force Index is above zero.
In the selected immediate period from March 23, 2021, 16 transactions were made using this system on the GBPUSD currency pair. Five of them turned out to be unprofitable, bringing 347 points of loss, one was closed with zero profit, the remaining 10 brought 666 points. A total of 319 points were earned. Of course, this system is far from perfect, but it is simple and completely mechanical - the trader is only required to log into the terminal once a day to search for signals, which are also clearly defined. Moreover, it is worth remembering that there is more than one currency pair, and the system works quite well on any currency pair. Here, for example, USDCAD:
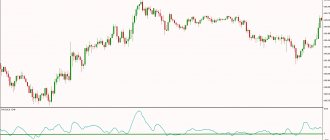
During the same period, 17 transactions were made, 13 of them were closed with a total profit of 1261 points and 4 unprofitable ones with a loss of 624 points. In general, for the pair we are in the black by 637 points. You may notice some pretty big losses here. These could be avoided or minimized by using a stop loss setting just behind the exponential moving averages. Additionally, the system would be improved by tightening the stop following the slower EMA21, as well as moving to breakeven after being in the market for 5 days. The strategy works approximately the same on all currency pairs with the same settings, so here is a summary test of randomly selected currency pairs:
The main trend was determined based on the price being above or below EMA100, the short-term trend - based on the relative position of EMA21 and EMA13. And, of course, the basic rule for entering and exiting a position, described above, applied. Entry was carried out with two orders. For both of them, the stop loss was determined based on 3xATR, the take profit of the first order was equal to 60% of the stop value, the second order was without take profit. In this case, both orders were closed according to the rule described above. If the conditions for exit did not occur, after closing the first Take Profit order, a trailing stop was activated, pulling up the stop loss at EMA21 at a short distance from it (3-5 points). You can study an improved version of this trading idea on the forum.
The system is quite suitable for both manual and automated trading. At the same time, it is very simple and has quite a lot of potential for modernization by experienced traders. For example, you can replace a simple long-term trend filter with a more effective one, you can also use top-ups as profit accumulates on intraday charts (on hourly charts, for example). Here is a simple example of adding on the Stochastic Oscillator indicator to the initial trade on the USDCAD pair discussed earlier:
You can also experiment with the short-term trend filter. For example, use the method proposed above, based on Force Index(13) being above or below the zero line.
Signals from two indicators
Using 13 and 2-day force index indicators, you can receive full-fledged trading signals to enter the market.
If a 13-period FRC is needed to determine a global trend, then using a 2-period FRC you can track corrections in this trend and enter on these pullbacks.
For example, if the 13th FRC shows an upward trend, then you need to wait until the FRC with a period of 2 enters the negative zone, and then begins to grow again. If at this time there is any support level on the chart in the form of a level, moving average, Fibonacci or other trend indicator, then you can safely enter.
For sales, everything is mirrored. You can sell when FRC 13 shows a downward trend, and FRC 2 entered the positive zone, but then turned down again. But it is highly recommended that such an entry comes from a good resistance level.
It is possible, of course, that the signal will turn out to be false and the rollback will drag on, driving the price against such a transaction. To reduce the number of such unwanted entries, you can place a pending order for a breakout behind the candle where FRC 2 entered against the global trend.
You can exit a trade in different ways, using historical levels, divergence and convergence with FRC(13), signals from other indicators, or focusing on the ATR of the instrument being traded.
But you can also exit according to the Force Index readings with a period of 2. If you enter it on price rollbacks according to the trend, that is, buy when FRC 2 becomes below zero, and sell when it becomes above 0, then you should exit when FRC changes its sign. With this approach, it is possible to take impulse movements, trying to take maximum profit.
Divergence signals
Divergence is a discrepancy in the dynamics of the indicator and price. It is typical for most oscillators (indicators that fluctuate in a range) and is considered a sign of a movement reversal. Bullish divergence occurs when the nearest price lows fall and the corresponding local lows of the indicator rise. Bullish divergence indicates the presence of prerequisites for a reversal of the upward movement.
Bearish divergence occurs when price highs rise and corresponding indicator highs fall. Bearish divergence indicates the presence of prerequisites for a reversal of the downward movement.
While a higher histogram high on the Force Index's 13-period moving average indicates a strong likelihood of a continuation of the current upward move, then a bullish divergence between the Index's 13-period moving average and price is a strong signal to go short. Thus, if prices make another higher high and the 13-period moving Force Index makes a lower high, it means that buyers are losing control of the market and sellers are ready to step in and take over.
When using divergences as signals to open a trade, additional confirmation is required. During a strong trend in the market, despite divergences, the price may continue to move in the direction of the main movement for a long time.
Expiration
Expiration (from English Expiration, “end”) is the end of trading in a specific asset, when exchange participants have made their forecasts based on strategies and tools, and now learn about the result of their decisions. This is also the main concept of working in the market, the correct use of which can make trading more productive.
Types of options:
- Ultra-short options - 30 seconds - 5 minutes.
- Short-term options – 10 minutes – several hours.
- Medium-term options – one day – several weeks.
- Long-term options – month – six months.
Is expiration extension allowed?
Allowed, but well, for all platforms. This is a convenient function that allows you to extend the expiration time during trading if the forecast is incorrect and thereby reduce your losses.
Expiration rules:
- If you are just learning the possibilities of trading and have no trading experience, choose long-term transactions for trading, the most stable ones, with minimal risks of loss.
- If you already consider yourself a professional in trading, choose the expiration date for trading that is most comfortable for you and gives you the necessary income.
- If instant income from trading on the stock exchange is important to you, choose short-term expiration for work, which will bring your first real money in 30 seconds.
- If a stable income from the exchange is important to you, choose long-term expiration for work, which will bring you reliability during trading and decent money.
Expiration in strategies with EFI
Expiration on a trend
Short-term trading : possible; Despite the fact that turbo trading is characterized by increased risks, using EFI with additional tools, you can achieve good results. Medium-term expiration : recommended; EFI works better and demonstrates trend signals precisely on this time period, allowing you to study the trend and make profitable bets; You should always double-check the indicator signals using other tools. Long-term expiration : possible; in this case, EFI signals should be checked using additional tools, technical and fundamental analyses.
Expiration on trend confirmation signal
Short-term trading : possible; Express trading is characterized by increased risks, so only using EFI with additional tools can you achieve a good result. Medium-term expiration : recommended; EFI works better and demonstrates high-quality trend confirmation signals on such a time period, allowing you to study the market and make profitable bets; You should always double-check the indicator signals using other tools. Long-term expiration : possible; in this case, EFI trend confirmation signals should be checked using additional tools, technical and fundamental analyses.
Expiration when EFI diverges from the price signal
Short-term trading : allowed; EFI is capable of producing high-quality price divergence signals; It is recommended to supplement it with other tools. Medium-term expiration : recommended; EFI is capable of producing good signals at a given interval and determines moments of divergence and convergence; It is recommended to supplement it with other tools. Long-term expiration : allowed; EFI shows price discrepancies well; it gives productive trading; It is worth double-checking its data with additional indicators and strategies, materials of technical and fundamental analysis.
When starting to work in the binary options market, separately study the features of expiration, which can improve trading results. To do this, we recommend choosing a convenient terminal from one of the popular brokers Olymp Trade, which offers expiration from 1 minute to 1 hour. Go to the official website of the broker olymptrade.com right now and start working more productively.