- Types of Japanese candles
- Uncertainty Candles
- Reversal candles
- Takuri: shadow down
- Shooting Star: Shadow Up
- Candlestick combinations
- Bullish Engulfing
- Bearish engulfing
- Tweezers
- Tweezers, reverse version
- morning Star
- Evening Star
- Triple turn up
- Three candles
Surprisingly, it is true that Japanese candlesticks are more than 250 years old, but Western traders learned about them only in the 90s of the last century. Before them, traders used bars, and the progenitor of technical analysis, Charles Dow, even used a now exotic option, such as a point-and-point chart.
In those distant times, when Godzilla was just a tiny lizard, Japanese traders actively traded rice. Like all stock speculators, they needed a method of technical analysis.
The price we see on the chart is just a set of numbers. The price can change several times per second, so we need:
- a method to organize and display price movements in graphical form;
- a method of analyzing prices for different timeframes (time periods).
That's how the beauty was born - the Japanese candle. This is a method that displays price movement for the period we select. It looks like this:
Wherein:
- Max. – maximum price value;
- min. – minimum price value;
- closed – closing price;
- open – opening price.
The essence of the candle is very simple:
- the body of the candle is formed by the initial and final prices for the selected time period (timeframe);
- The shadow is the maximum and minimum value of the candle for this time frame.
I remember very well my first date with a Japanese candle. Then I didn’t immediately understand what it was. To understand its essence, you need to loosen up your abstract thinking a little.
Fortunately, I had a wonderful book “Breakthroughs in Technical Analysis”, where in one of the chapters the Japanese Yosuke Shimizu presented very clear examples that immediately put everything in its place.
Let's say that we have chosen a time frame of 5 minutes on the chart. During these 5 minutes, 1 Japanese candlestick will be drawn on the chart.
This is how a green (or white on b/w charts) Japanese candlestick is formed. Imagine that the screenshot below is a 5-minute TF. The price travel over these 5 minutes forms a candle.
If the price has gone lower, it is a red candle (it is also black on some charts).
It is clearly visible that the shadow of the candle is its maximum value, and the body is formed by the opening and closing prices for the selected period of time.
The Japanese candlestick itself is a powerful indicator. There is an opinion that American traders were introduced to candlesticks by Steve Nison, to whom a Japanese trader described them.
Indeed, Steve, whose books are on the forum, was one of the pioneers. However, it was not he who was the first, but Seiki Shimizu. This is a relative of Yosuke Shimizu, whose charts are in this article. Seiki published the first English-language book about candles, called “The Japanese Chart of Charts”. Then Neeson made a fuss and took all the credit for himself. It happens to Americans.
However, it doesn’t matter who first showed the candles to a Western trader, what matters is what to do with them. Nowadays, a whole technical analysis industry has been built around candlesticks.
Non-indicator analysis, such as price action, is usually based on naked Dow theory and Japanese candlesticks.
The following is a description of the candles and several drawings from a chapter written by Yosuke Shimizu, a relative of that same Seika. It is always interesting to get acquainted with the Japanese view of their national product.
The history of Japanese candlesticks
This type of market analysis was first discussed in Japan four centuries ago. It all started with the reform of the rice grain trade market. For the first time, a trader named Homma depicted the graphical construction: he depicted the volatility of the price of his own product in order to determine its max and min values. Gradually, more and more traders realized that such charts were an excellent basis for fairly accurate forecasting. Then the analytical candlestick method was born - a description of a large number of combinations in order to predict potential fluctuations.
What do Japanese candlesticks say and show?
Regardless of the duration of the exchange transaction, Chinese candles on the exchange always show the same information:
- Low — prices for the current period.
- Hi — prices for the current period.
- The cost of opening a transaction on the market and closing it.
Due to their clarity, Japanese candlesticks are used to search for patterns that affect the conclusion of transactions when trading. Their structure also reflects the psychological state of the market: for example, behavioral patterns characteristic of certain trading participants. This helps to quickly and with great reliability predict how the market will react to certain circumstances.
Technical analysis in stock trading helps to determine the level of resistance and the level of support, and at any time interval.
How Japanese candlesticks are formed
The structure of the nuclear system shows the behavior of all players on the exchange. This allows the trader to predict the intentions of other players. There are three aspects that directly affect the structure of each Japanese candlestick.
Mood candle
The Candle Mood of a Japanese candle can be:
- Bullish (when the trade completed above the previous high).
- Bearish (when the transaction was completed below the previous Low indicator).
- Neutral (when the gradation of mood has not yet begun).
Each type of mood also includes 3 subtypes - low mood, medium and high. The definition of "mood" was coined by Lance Beggs.
Candle body
The body is the most important parameter that is looked at first. The longer the body of the Japanese candlestick is, the more significant the pressure exerted by bears or bulls on the market.
An equally important aspect is body color. If it is white and quite long, this means that at the moment the market is dominated by “bulls”, that is, buyers. If the body is black, the situation is reversed and the sellers control the market. In the MT4 terminal, the color indication is slightly different - the bearish LE is red, the bullish LE is green.
A short body indicates the imminent formation of a rollback from the trend or a flat. This happens when Ask and Bid are approximately equal. The market at such a moment is indecisive regarding the further quotation direction.
Tail of the candle
The tail is the same as the shadow of a Japanese candlestick. The tail is also called a wick. A long tail on the upper or lower side (otherwise known as a pin bar) characterizes a change in market sentiment.
Types of Japanese candles
There are the following types of candles:
- "Doji." One of the most common types of nuclear weapons. It is formed when the closing and opening levels are equal, which gives a clear signal about the upcoming trend change. If the Doji has a long wick, it is a Rickshaw model. If the "Doji" has a closing or opening level at the minimum o, if vice versa - "Dragonfly Doji".
- "Top". It comes in both black and white. The “Top” is characterized by a narrow body and short tails (equal both above and below). As an independent nuclear system, it provides little information, but is valuable as part of a combination.
- "Hammer". A powerful YA with a small body and a shadow below that is twice as large. There is either no tail on top, or it is very tiny. The “hammer” is formed at the bottom, so it is perceived as an indicator of an upward reversal. A similar but mirror image of the Hammer is the Inverted Hammer.
- “The Hanged Man” (or in other words “The Hanged Man”). It is similar to the previous one, but is created at the peak of an upward movement. Indicates an upcoming reversal and price movement in a negative direction.
- "Shooting Star" Externally, it is similar to the Japanese “Inverted Hummer” pattern, only it forms at the top and reports an upcoming reversal of the trend line.
candle shadow
The shadow (tail, wick) gives the trader a lot of important information, including displaying the price Low and Hi. A small wick at the bottom of a Japanese bearish candle and a larger wick at the top signal that the bulls were actively trying to push the price up. However, the bears were able to resist this tendency and brought the price back down to its previous place.
During trading, the opposite situation also occurs: at the bottom the bullish shadow is large, at the top it is small. This shows that the bears made attempts to push the price down, but the bulls did not let them do this and successfully raised it back up.
Uncertainty Candles
Such Japanese candles are created when Ask and Bid are equal and it is impossible to predict who will “take the upper hand” and in which direction the price will move. With Japanese candlesticks of uncertainty, the trader needs to wait for a more clear market indicator.
Bullish candles
Bullish SA is an indicator of the dominance of buyers (“bulls”). And as long as their number is greater than the number of sellers, it will remain bullish.
The larger the bullish body, the stronger it is. Accordingly, the thinner it is, the weaker it is.
For successful trading, it is not recommended to short if a bullish JS has formed. The best thing is to wait until the number of acquirers increases.
Bearish candles
By analogy with bullish ones, bearish ones indicate that at this moment the market is under the control of sellers. Accordingly, as long as their number outweighs, it will remain bearish.
For successful trading, it is not recommended to open a long position if a bearish JS has formed.
Stars
This candlestick pattern reflects a gradual change in market sentiment : dominance of one side, a reversal, seizure of initiative and movement in the opposite direction.
Model features
- The pattern is always formed by three candles;
- The second candle consists of a short body and small shadows;
- The color of the second candle is not taken into account during combination analysis;
- The trailing candle should cover most of the body of the first candle.
Factors that enhance the formation
- The second candle has a “ Dodge ” shape, that is, its opening and closing occurred at the same level;
- The second candle was not located at the same level as the first and third, but formed a price gap up or down;
- The third candle covered almost the entire body of the first.
My recommendation
I only pay attention to " Stars " when all three enhancing factors come together. The resulting formation is called " Abandoned Baby ". If you combine it with strong horizontal levels, then the probability of signal processing increases to 70%.
“ Abandoned Baby ” is an enhanced version of the “ Morning Star ” and “ Evening Star ” patterns.
Combinations of Japanese candles
Let's look at common Japanese combinations in trading:
- "Doji." This is an example of a pattern consisting of one Chinese candlestick. It reflects the indecision of the trading parties to take active steps to reduce or increase prices. “Doji” has no body, “long-legged Doji” has long tails at the top and bottom, and if the closing and opening prices meet in the middle of “Doji,” then it is “Rickshaw.”
- "Hammer" ("Hammer"). This is the so-called reversal combination, which is formed at the support level. This indicator signals that the downward price decline is ending. The body of such a nuclear weapon can be both black and white. The shadow below is 2 times longer than the body itself. And the shadow above is most often simply absent, or very short. It is important to remember that the Hammer and the Hangman (this is a mirror hammer) always require confirmation (in a subsequent pattern). Because it is never known for certain whether a further reversal will occur.
- "Absorption". The model consists of two Chinese candles of different colors. The body of the second nuclear system completely absorbs the body of the first. If the cost of opening the 2nd YES is less than the cost of closing the 1st, then the pattern is called “bullish engulfing”. If the situation is the opposite, then “bearish engulfing”. It is important to remember that during “absorption” it is the bodies that are eaten (i.e., the body of one nuclear unit is within the boundaries of the body of another).
- "Stars". The pattern is a powerful signal for a market reversal. With this combination, EAs appear at the top of an uptrend, or at the bottom of a downtrend, but in any case, it opens with a gap. The body of such a JS is short. The YA located next to the “Star” is as follows: on the left – long and white, on the right – short and black (in an upward trend). When descending, everything is exactly the opposite.
- "Morning Star" This Japanese model is also a reversal model. It is more complicated than the previous ones, because it consists of three nuclear systems. The Morning Star is created at a support level and signals an upcoming market reversal to the upside. The main parameters of the model are as follows: it is preceded by a bearish YA, after which a quote gap occurs and a small YA with a small body and the same shadow is formed. After the Morning Star, a bullish JS is formed (also with a gap).
- "Evening Star". This is a mirror image of the Japanese “Morning Star” model, also consisting of three nuclear weapons. "Evening Star" gives a signal of an upcoming market reversal downward.
- "Shooting Star" Again, a reversal combination formed at the resistance level. “Shooting Star” indicates the end of an uptrend. It doesn’t matter whether it’s bullish or bearish: the signal given is always the same - it’s a downward reversal. Graphically, the model is depicted with a tiny body and a very long upper wick.
- "Harami." Translated from Japanese into Russian, “harami” means pregnant. The model is formed from nuclear weapons with a long body (“mother”) and a short one (“child”). The first appears before the second is formed (otherwise it is already a “bullish engulfing” pattern). “Harami” shows that the current trend is ending and a market reversal in the opposite direction will soon occur.
- "The Abandoned Child" A pattern similar to "Morning Star" and "Evening Star". Based on the name, it becomes clear that the model implies a single nuclear system. It is created with a gap relative to the previous and subsequent candle.
- "Three Crows" A combination of nuclear symbols indicating a potential market reversal after an increase in value. The peculiarity of the model is that the closing cost decreases sequentially, and the opening cost is within the boundaries of the previous aggregate.
- "Upside-Gap 2 Crows" Quite an interesting Japanese model, externally reminiscent of the “Absorption”. The only difference is that both YAS are bearish. “Two Crows” is a signal for an imminent drop in value. Despite the price gap, buyers are not able to hold its level for a long time and push it higher. Therefore, a decline inevitably begins.
- "Mat Hold" This set of Chinese candlesticks is considered to continue the current trend. Outwardly, it is very similar to a flag or pennant.
Candlestick patterns formed from one or two nuclear symbols are characterized by a number of features:
- Such a set loses its own significance if it appeared during the current market movement.
- The model itself is not an indicator that says that you need to open a deal now. It only reflects the current market sentiment and its potential changes.
- Japanese trading literature supports the argument that a number of bearish patterns are much stronger than their bullish counterparts. However, for example, for Forex, such a statement is irrelevant, which is confirmed in practice.
Confirmation of the Harami pattern
Analysis of the chart should not only give an entry point, but also confirm it, preferably several times. In the case of Harami, 3 types of confirmations are used:
- presence of a strong level nearby. The first candle of the pattern touches support/resistance, followed by a slight stop and reversal. Without a level, we recommend that you do not hire a formation at all;
- Harami is a candlestick pattern that can “mutate” into a 3-day pattern from inside up/down. In this case, we wait for the formation of the 3rd candle of the structure. For bullish patterns, the Close price of the 3rd candle should be above the High Harami, for bearish patterns the 3rd candle closes below the Low Harami. Also, when three candles are formed, the Close price should consistently increase or decrease.
No one guarantees 100% completion. Analysis of the chart gave an excellent entry point to buy, but the pattern did not work out, although it was formed with confirmation
Harami has formed, the candlestick pattern has performed weakly
The option with the third candle is good as a filter. Helps to reject poorly performing patterns or structures that would immediately result in a stop loss.
The Harami candlestick pattern can also be confirmed by indicators:
- on the second candle the volume should increase compared to the readings on the 1st candle;
- When this pattern is formed, oscillators often leave the oversold/overbought zone. You can also use the Money Flow Index indicator.
An example of using indicators for Harami filtering. If you work with volumes, a regular tick volume indicator will do.
Of the listed confirmations of the pattern, only the presence of a level is mandatory. The rest are optional.
Japanese candles: all the secrets and nuances
Working with candles in trading:
- Japanese analysis is most effective when trading with the D1 (daily) time frame. If the candlestick timeframe is less than H1 (hourly), it is unreliable.
- A reversal pattern does not always indicate a market reversal. Rather, it is an indicator of a changing situation.
- To identify long-term trends in the market, trading uses analysis with the W1 (one week) and MN (one month) time frame.
- Combinations with gaps are much more reliable. Of course, this does not apply to the Forex currency market, since gaps are very rare there.
- It is necessary that each candlestick pattern be confirmed. That is, after a specific combination is formed, the subsequent Japanese candlestick should reflect the market's intention.
Japanese analysis is based on a number of basic principles that everyone who is engaged or planning to engage in trading should know about:
- If there is a short wick and a long body, YAS builds a trend. This is an indicator of strong superiority of either sellers or buyers in the market (depending on color). The longest bodies, as a rule, are located at the beginning of a trend wave or at its end. An important nuance: if, after a long upward impulse, EAs with long bodies have formed, the trader needs to close the deal.
- A small body and a long wick in most cases are formed at a reversal of the trend line. This refers to situations where one of the YS's tails dominates to a significant extent over her body and the other tail. Roughly speaking, this is an “unfinished” large body. The appearance of such elements suggests that during trading the market was dominated by players who preferred to trade in the same direction, and then the course of trading was refracted by players who adhered to the opposite side.
- A small body and small tails are characteristic of nuclear units formed in a sideways trend. Such elements allow you to open a position with a short stop loss.
Selecting a time frame
Time frame is extremely important in trading. For example, if we want to determine the priority direction for the month ahead, then in this case five- or fifteen-minute candles will not tell us anything, since they simply cannot cover a sufficient range for analysis. In this regard, it is customary to divide Japanese candlestick charts into the following categories:
- Short term . This includes candles M1, M5 and M15. Usually these are scalping strategies, where the goals are quite small - from 3 to 15 points. These could be news fluctuations or simply movements within a flat in a calm market. In general, they are not suitable for candlestick analysis, as they are very unreliable.
- Intraday . M30 and H1. The hourly period is used by a large number of traders; it is quite informative and allows you to determine movements within up to 100 points. Many indicators are already working quite well on this time frame, and the accuracy of the signals is increasing.
- Medium term . Candles H4 and D1 are presented here; they allow you to evaluate trends within a week, quite convenient for medium-term strategies. The reliability of all signals increases significantly; most of the classic indicators are designed specifically for H4 and higher. Japanese candlesticks in graphical analysis also become relevant starting from D1.
- Long-term . These are weekly and monthly charts, from which you can determine very long-term trends, and also use models to understand what will happen in the relatively near future. That is, the correction that has begun in the weeks will make it possible to determine the elements of this correction already on H4, and to catch the reversals of these waves already on H1. In general, all time frames are used in trading in one way or another.
How to trade Japanese candlesticks?
Japanese candlesticks are not a full-fledged trading tactic, but an analytical tool that must be used wisely. It is not enough to simply find the combination of nuclear symbols on the chart. Exchange trading involves the use of a large number of other analysis methods in combination.
To start trading on the market using Japanese candlesticks, a trader needs to know at least their basic patterns. As soon as a beginner has mastered three or four models of nuclear language, he proceeds to consolidate the following patterns. Theory is always reinforced in practice - this rule is relevant not only for exchanges.
Summary
Friends, you have studied the 10 strongest candlestick combinations that can help you make money today. Unfortunately, until you put this knowledge into practice, it will not be useful. To prevent this from happening, I recommend that you do the following:
- Review the article again;
- Make your own rating in which you rank all the patterns on a scale from 1 to 10 ;
- Leave the first three positions and cross out the rest;
- Open a demo account and test the selected patterns. The best broker for stock trading is Just2trade, an excellent broker for forex trading is Amarkets ;
- Evaluate the result and leave for work only one candlestick formation that showed the maximum result ;
- Proceed to trading on a real account;
- Share examples of several successful transactions in the reviews below this article.
Thanks to all. I hope that the proposed material contained only information that was useful to you. Don't act like the hero of this meme
As always, it's all up to you . See you in new articles!
If you find an error in the text, please select a piece of text and press Ctrl+Enter. Thanks for helping my blog get better!
Japanese candlestick trading strategy
In trading, the main element of working with Japanese candlesticks is themselves. And the Japanese candlestick trading strategy is based on several methods:
- Search for combinations. When studying the chart, you need to identify a combination of 3-4 Chinese candles, colored in the same color and moving in the same direction. Having found such a pattern, the trader takes a contract opposite to the current situation, since such trends allow one to anticipate a rebound or reversal.
- Determining the trend. This is necessary so that no contradictions arise between it and the reversal found by the trader.
- Determining the level of resistance and support. You can only visualize them, or you can draw them. This helps the player, when trading, to react in a timely manner when the price approaches Low or Hi, and based on this, enter into profitable contracts.
How to correctly read Japanese candlesticks on the stock exchange and chart
Japanese price chart analysis always pursues the same goal - searching for similar combinations (patterns) that periodically appear on charts. Patterns consist of 1-2 candles or more. Combinations in trading are divided into reversal patterns (the vast majority) and trend continuation patterns.
Initially, all candles are presented on stock charts as a horizontal line, i.e. Candle Mood is neutral. And depending on which Japanese candlestick is formed - bullish or bearish, the trader will understand who currently dominates the market.
If the price rises, the market is dominated by bulls, i.e. buyers. If the price falls, then bears – sellers – predominate in the market.
The formed Japanese candlestick shows who won the confrontation - buyers or sellers.
Step-by-step steps on how to interpret nuclear symbols when trading:
- The first step is completely analytical. First you need to see whether the body is growing or, conversely, shrinking. The questions need to be answered: “Which of the two sides of the market is currently dominant? And is it strong enough to set conditions for the creation of even more nuclear systems, in particular the next one? You should also pay attention to shadows, since they are an equally important source of information. Next, it is necessary to establish whether the YAS is based on the resistance (or support) level.
- The second step is retrospective analysis. It is necessary to study previous Yas. Understand whether there is currently growth or decline. It is necessary to analyze past nuclear weapons, their number and embedded information. You need to understand whether they can confirm the current price direction or not.
- The third step is predictive. It is necessary to predict the color of the subsequent nuclear weapon.
- The fourth step is also predictive. Once the trader has been able to establish the type of pattern on the chart, it is necessary to predict the direction of the market.
An important trading rule is to wait patiently for closed candles. After all, the market is unpredictable, so nuclear weapons can suddenly change their color and shape.
Japanese candlesticks and market analysis
Having summarized all the theoretical material, we can formulate the main positions necessary for market analysis and trading using Japanese candlesticks:
- Coloring a Japanese candle. This will allow you to understand whether the bulls or bears are currently in control of the situation.
- Accounting for tail length. This is an indicator of how much the price bounced from a specific level.
- Taking into account body size. This is an indicator of the strength of sellers and buyers.
- Taking into account the length of the shadow. The longer it is, the greater the price rebound and the more powerful the pressure from sellers will be.
Relatively speaking, market price volatility is a battle between buyers and sellers. If there are more of the former, the cost decreases. If there are more of the latter, it grows.
Counterattack
These are two contrasting candles, whose closing points are at the same price level, called the “ balance line ”.
Model features
- Two oppositely colored candles with approximately the same body sizes were formed;
- The trailing candle always opens with a price gap that matches the main trend;
- The bodies of the candles participating in the combination do not overlap each other and always close at the same level point.
Factors that enhance the formation
- On the path of the price movement, a round level with a double or triple zero (1.1000, 1.2500) was formed;
- After the appearance of a new candle, the “ Counterattack ” pattern moved into the “ Tweezers ” formation;
- The next candle that occurred after the " Bearish Counterattack " closed below the " balance line ". For a Bullish Counterattack , the new candle must settle above the Balance Line .
Pros and cons of candlestick analysis
Each method of market analysis in trading, including Japanese candlestick, has its own advantages and disadvantages.
The advantages of Japanese candlesticks are the following:
- Versatility. The Japanese tool is suitable for analyzing all types of markets (this includes the stock market, foreign exchange market, commodity market, etc.).
- Credibility. Unlike other technical trading tools, EAs analyze the direct behavior of the value itself.
- Ubiquitous. Japanese candlestick analysis is available in every modern trading terminal.
In fact, no other method of chart analysis in quote trading can properly compete with the Japanese method. Even extreme simplicity in visual design puts the method in an advantageous position. Japanese traders have developed a truly optimal tool for identifying current market sentiment and its changes. And this is the essence of trading itself.
If we talk about the disadvantages of nuclear systems, then this is the difficulty in mastering. This Japanese method of analysis is quite complex, so novice traders often spend considerable time studying it and further practical application.
Among the shortcomings there is one more - the Japanese method is not suitable for trading with short time frames on Forex (less than M30 - thirty minutes).
Clouds
These are trend reversal candlestick patterns that reflect a sharp change in market sentiment. A very strong signal that is worth taking a closer look at.
Model features
- This pattern is always formed by two candles;
- Candlestick bodies must have different colors;
- The second candle should close part of the body of the first candle.
Factors that enhance the formation
- The second candle covered more than 50% of the body of the first;
- With an upward trend, the second candle opened without an upward shadow, and with a downward trend, without a downward shadow;
- With an upward trend, the second candle closed below the resistance level, and with a downward trend, it closed above the support.
My recommendation
Cloud pattern has sufficient strength and can be used as a separate trading strategy. To improve signal accuracy , do the following:
- Wait for this candle combination to appear;
- In the middle of the second candle of the “Clouds” pattern, draw a horizontal level;
- Place a pending buy or sell order in the marked area.
This maneuver will somewhat reduce the number of transactions carried out, but will significantly improve their quality. The best way to raise your own level of trading is practice, and here you can’t do without registering with a good, proven broker company. The list of such options is in the table.
| Company | Just2trade | United Traders | BKS | Tinkoff investments |
| Minimum deposit | From $100 | $300 | from 50,000 rub. | Unlimited, you can even buy 1 share, they recommend starting from RUB 30,000. |
| Commission per cycle (buy + sell trade) | 0.006 USD per share (min. 1.5 USD), 0.25 USD for each application. that is, per lap – $3.50 | “Beginner” tariff – $0.02 per share Average $4 per round | At the “Investor” tariff – 0.1% of the transaction amount, at the “Trader” tariff it is reduced to 0.015% | 0.3% for the “Investor” tariff |
| Additional charges | The ROX platform will cost at least $39/month. (for the American market), for an additional $34.50 they connect Canada/TSE, Level II On the over-the-counter market, the additional fee is 0.75% of the transaction volume (minimum $30), in the case of dividends - 3% from the issuer (minimum $3) | On the Day Trader tariff, they charge $60/month for the Aurora platform, free on other plans | If the account has less than 30,000 rubles - 300 rubles/month. for access to QUIK and 200 rub./month. for access to the mobile version of QUIK, | — |
| Account maintenance cost | $5/€5/350 rub. reduced by the amount of the commission paid | — | 0 RUR/ month on the “Investor” tariff. On other tariffs, funds are debited only if there was activity on the account this month | Free for the "Investor" tariff |
| Leverage | for Forex Up to 1 to 500 for stocks up to 1 to 20 (day) to 1 to 5 (night) | 1 to 20 on the Day Trader tariff, this is the maximum leverage (daily) | Calculated for each share, within the range of 1 to 2 – 1 to 5 | Calculated for different instruments, the calculation is linked to the risk rate |
| Margin call | -90% | Standard -30% of the deposit, in technical terms. support can be set -80% | Calculated based on the risk for each security | Depends on the asset |
| Trading terminals | MetaTrader5, ROX | Aurora, Sterling Trader, Fusion, Laser Trader, Volfix.Net, Pair Trader | My broker, QUIK, WebQUIK, mobile QUIK, MetaTrader5 | The purchase of shares is implemented like an online store, professional software is not used |
| Available markets for trading | Forex, American, European and other stock markets, cryptocurrency | American and other stock markets, more than 10,000 assets in total, cryptocurrency | Foreign exchange, stock, commodity markets, there is access to foreign exchanges | American and Russian stock markets |
| License | CySEC | Lightweight license from the Central Bank of the Russian Federation | TSB RF | TSB RF |
| Open an account | Open an account | Open an account | Open an account |
Examples of trading on the stock exchange
As soon as a trader masters the theoretical foundations of nuclear symbols in trading, studies their models and learns to distinguish between them, then he can start trading. We must remember that a candlestick combination is not an independent trading tool. The player must take into account the context of the entire stock chart. Don’t forget about the tools for fixing losses and controlling risks.
An example of trading on the Forex currency exchange using a concrete example:
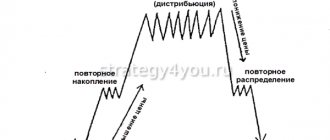
- Let's say a trader decides to use a strategy called "Three Candles". As part of this strategy, you need to find this figure on the chart.
- The model looks like this on the graph: two nuclear units on the sides are located higher than the one in the middle. Knowing that a similar pattern is formed after a price correction, the trader finds the right combination.
- If the trend is upward, the player bets on an increase in price. If the trend is downward, then downward.
Tweezers
These are two or more candles that formed equal price highs or lows within the same market period.
Model features
- The tweezers must consist of at least two candles;
- The group of candles participating in the combination must follow one after another;
- Each candle must exactly repeat the minimum/maximum of the previous one.
Factors that enhance the formation
Tweezers pattern becomes more significant if it is part of another reversal candlestick combination. Below you can see some examples of how this can happen.
My observations
Tweezers is an excellent pattern that tells traders the location of a significant horizontal level . I check this combination with indicator readings, and if the value is confirmed, I place pending limit orders at the minimum/maximum.
Summarizing
Japanese candlesticks are an advanced and effective trader’s tool. But you need to understand that you can trade with it only in combination with other analytical tools. It is not so important to thoroughly memorize all the candlestick combinations, the main thing is to learn to think outside the box.
Summary of the main points in the article:
- This is an analytical trading tool that allows you to reflect the real movement of market prices and trade more profitably. If the price rises, the market is dominated by bulls, i.e. buyers. If the price falls, then bears – sellers – predominate in the market.
- This is not a full-fledged trading strategy, but an analytical tool that must be used wisely. It is not enough to simply find the combination of nuclear symbols on the chart. Trading involves the use of a large number of other analysis methods in combination.
- If there is a bullish YS on the trading chart, then the opening price in all cases is less than the closing price. If it is bearish, on the contrary, the opening price is higher than the closing price.