17 October 00:11 2017
Author's rating
Author of the article
Inga Romanova
I specialize in Forex, namely automated trading.
Articles written
908
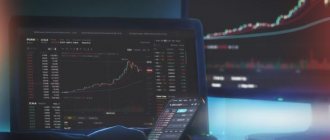
Any participant in the financial market uses various methods of analyzing market sentiment to find the necessary point to enter the market. After all, at the very beginning of getting acquainted with the basics of trading, the player must learn to correctly determine the most optimal place for entering and exiting an operation.
Today we will talk about one of the systems that allows you to analyze orders for purchase and sale on the market, presented in the order book - Level 2.
How does a glass work?
In addition to the term “glass”, this tool can be called Level II , Open Book , market depth . Available by default in most terminals for working on the stock market. There is Level II on cryptocurrency exchanges in online platforms, the principle of operation does not change.
As for how to view the order book, in Kwik all you need to do is double-click on the corresponding instrument in the “ Current Trading ” window. To edit settings, use the combination Ctrl+E .
The order book looks like a small table that shows prices and volumes for buy/sell offers:
- Ask prices are indicated in red , at which other trading participants are ready to sell you an asset. Opposite each level the volume in lots is indicated.
- Green color (bottom left) – buyer prices. If you need to sell securities, then the asset will be purchased at this price.
The totality of all prices is called offers . The most profitable quotes, in the example for the figure above, 183.20 and 183.22 are called the best Bid/Ask. Gazprom's securities are highly liquid (the company is included in the list of blue chips on the Russian market), so the spread is small.
For those who are just starting to explore the world of speculation, the article “What is a spread in trading” will be useful.
Depth settings
For highly liquid assets, purchase/sale orders are placed in small increments. There are no gaps in the glass, like Gazprom, Sberbank and other blue chips. That is, there are no price levels at which there would be no people willing to sell or buy shares.
On low-liquidity instruments there may be levels at which there are no orders. Because of this, prices in the order book have gaps. But for convenience, quotes for which there are no offers are not displayed.
In the settings (opened with the combination Ctrl+E ), you can then display those levels at which traders are not interested. It is impossible to stop the price on them.
You can also change the appearance of the glass in the settings window. For example, make sure that the prices of sellers and buyers are displayed without a vertical shift relative to each other.
When sparse mode is activated, the low density of orders in the order book becomes visible. The display of additional information is also activated through the settings.
The listed settings are optional. Most traders work with a standard order book; it contains enough information for trading.
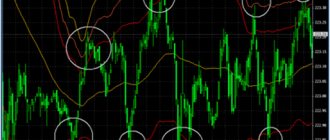
For clarity, this information can be displayed directly on the chart in the form of vertical histogram (in Quik you need to execute the commands Actions - Draw - Market Depth ). This is the same data as in the order book, but they are shown as lines on the chart itself and act as support/resistance levels.
In the example with Akron shares, it is clear that the bulls defended the level of 6094 rubles . With the usual number of applications up to 40-50 at around 6094 rubles . buyers placed orders to purchase 427 lots. With this information, it was possible to conclude transactions to buy from support. This is the simplest method of using the glass in trading, we will talk about this in more detail below.
Passive and Aggressive Sentences
Among financiers, it is customary to distinguish passive applications from active ones. In the first case, prices are located close to each other. Passive orders act as protection for the price line, preventing it from breaking through. In this case, the analysis of the order book should be supplemented with support and resistance levels.
Orders that require instant execution are called aggressive. They stimulate a sharp change in the value of an asset in the desired direction. Thus, monitoring such orders allows you to find a change in trend and determine the desired entry point into the market. Among the aggressive orders there are limit ones.
What types of orders go into the order book?
There are different types of orders, not all of them are displayed in the order book:
- If an order is given to conclude a transaction at a market price , then on a liquid instrument the order, at best, will appear in the general list for a split second. The execution is instantaneous, this information is of no use.
- Pending orders . They are visible in the general list . They are used to navigate levels that are significant for other traders.
- Orders with different conditions - are not in the general list . The conditions specified by the trader are stored on the broker’s server, and only when they are met will a market or limit order be automatically created.
Please note - large buyers/sellers know that based on their orders, trading can be built on the order book of other traders. With large volumes, large players hide their intentions through iceberg orders. In this case, only part of the real volume that the trader is going to buy/sell is used in the order book.
It is impossible before an iceberg request is satisfied ; only a small part is visible in the general list. When it is implemented, a certain volume for buying/selling will begin to appear in the order book and list of transactions and be immediately satisfied. If the level can be protected, then the price will not be allowed for it. It will not be possible to manually place orders with such frequency as when implementing a hidden order.
Classification of orders by volume and purpose
Depending on the volume, all orders are conditionally divided into 3 types:
- Small – the bulk comes from ordinary traders, their volume is about 20-100 lots .
- Medium - up to 1000 .
- Large - from several thousand for securities belonging to the second echelon. If you work with blue chips, then we are talking about tens of thousands of lots.
The classification is conditional and may change depending, for example, on the price of shares. Please also take into account that some large orders are invisible , since they are issued in the iceberg order .
Purposes of placing orders
Online you can watch how the composition of the glass is constantly changing. But orders placed in it are not always used only for the purchase of securities. Traders have different goals:
- Buying or selling securities - the trader just needs to open a position.
- To stimulate stock movement. These are limit orders, but they do not remain at the same level, but constantly move following the price. At the slightest attempt to reverse, the order may be partially satisfied and prevent a corrective movement from beginning. There is also a psychological effect – there is a confident movement in one direction, and more and more traders are joining it. Work in this style is carried out both manually and with the help of robots. Ordinary trader with small volumes not able to influence the market according to this scheme.
- To protect a significant level , so-called passive orders. As for how this tool works, its purpose is literally to protect levels that are significant for bulls or bears. These orders may not be visible in the order book due to the fact that they are located at a significant distance from the current price. But when the chart approaches a significant horizontal level, you can see how orders with abnormal volumes appear in the general list. This is evidence that the bears/bulls are about to stop the movement at the support or resistance area, respectively.
The fact that a trader has sent an order does not mean that he will definitely execute it. This can be a trap for the crowd of ordinary speculators. It is more profitable for a large player to use an iceberg order to hide his intentions from other trading participants. If a trader places a large volume regular order, that's something to think about: he might want you to think he's about to enter the market at that level. Trading is primarily about psychology , and the glass is an excellent tool for manipulating other people’s opinions .
Iceberg orders
This type of order includes 2 parts: open and hidden. For example, the open part (visible) if there are 100 lots for sale at a price of $95. When the declared volume is realized, a similar order appears and this continues until the entire volume is purchased. That is, this entire volume is a hidden part.
This ordering scheme is used to hide very large orders to prevent price fluctuations. At the Moscow Exchange, it is allowed to use a ratio of visible and hidden parts in the ratio of 1:100. And yet, traders resort to personal algorithms to place iceberg orders with different parameters. They can be seen in the order book when one order is repeated several times.
To track orders, a trader can use an order feed called Level 1. The order book itself is Level 2. The feed makes it easier to visually perceive orders that are repeated in iceberg orders.
In the figure, the quote book is located on the left side, and the order tape is on the right.
Methods for using a glass at work
Information on orders from other traders can help in trading. You will have to monitor the actions of large players; ordinary speculators with volumes of a couple of lots are ignored. Below is a small instruction explaining how to use the stock order book.
Determining the price at which the order will be executed
This is relevant for low-liquidity instruments for which supply and demand are limited. If you enter with a large volume, then the real execution price differs from the best Bid/Ask displayed in the trading terminal.
In the example with ordinary Avangard shares, when selling 80 lots, there is not enough demand at one price level. Based on current orders, you can determine the real price of order execution. In the terminal at the time the transaction is concluded, the exchange rate of 935 rubles will be visible, but due to the large volume, demand is satisfied at several levels.
In reality, the execution price will not be equal to 935 rubles, but (5 x 935 + 46 x 930 + 12 x 925 + 8 x 920 + 5 x 915 + 1 x 910 + 2 x 905 + 1 x 890)/80 = 926, 25 rub.
For blue chips, only large players may encounter such a problem. Volumes typical for ordinary speculators are satisfied almost instantly without deterioration in price.
Large offer
It all depends on where this offer appeared:
- Intraday traders fix profits on High/Low sessions. If a large offer to sell or buy appears in the afternoon, and it is in the area of the daily high/low, there is a high probability that the major player is going to take a profit. You can try to catch a rebound or close the profit a little earlier than the “big man” does, by setting your Bid a little higher than the market maker did. Due to this, your order guaranteed will come true.
- Big Bid or Ask directly at historically significant levels. This can be either a desire to protect important support/resistance or profit fixation. This is an ideal guideline when setting your own stop loss. If you place SL behind the “slab” (high volume offer), then the large player will protect both the important level and your stop. This reduces the size of the SL and gives additional stability to the position.
- When moving in a horizontal corridor, abnormal offers can form at its borders not far from the best Bid/Ask. Depending on the situation, this may be a provocation or an attempt to provoke the chart to leave the range.
The basic principles of working with “big money” offers come down to using it as a guide when taking profits or setting a stop. If you see such an order in the order book, do not rush to immediately enter into a deal in the same direction. This may turn out to be a common provocation .
Profitable trading in AMarkets
Channel
Sometimes on the chart you can see the price movement in the channel. A trader can use this movement of quotes in his work. When a large number of sell orders accumulate near the upper limit of the channel, there is a high probability that the asset is overbought by market participants near the lower limit of its price. In this case, they will try to sell the purchased volumes at the upper limit of the range. This indicates a price rebound from top to bottom after it reaches the upper boundary of the channel. This rebound will be caused by active selling.
The deal feed as an important addition to the order book
Above we have already understood the principle of operation of the glass. Its main drawback is the inability to understand when and what transactions were actually concluded. A trader can manually or with the help of advisors place any offers and then remove them, misleading others. To get a real picture of what is happening, you will have to work with a table of impersonal transactions (that’s what the tool is called in Quik).
If Level II shows at what prices the offers are placed by traders, then Level I (the table of transactions) allows you to understand which of the orders were implemented . It is advisable to evaluate both tools together.
The table got its name due to the fact that it indicates completed transactions, but all of them remain anonymous. impersonal appears in the title .
Looking at the table of deals, you can see how big offers are “eaten up”. This tool also allows you to identify the presence of iceberg orders . If there are no large offers at Level II, and in the table of impersonal transactions you see a series of simultaneous trades at the same price, then most likely the hidden order has begun to be absorbed.
Trading by Density
For profitable trading, a trader must first of all clearly define for himself what density he is looking for, how it should be eaten to enter a trade profitably and other factors. When trading on a rebound, the density must completely correspond to the strong line. An exception may be if the density is too high.
But first, the trader must find out that it is not fake and they want to fulfill it. If they approach it and then eat it, you can enter into a deal. Sometimes market makers scare other traders to move the market higher. This method requires a lot of attention from the trader and can be used on both securities and currency pairs.
To trade, you need to wait for the largest orders or icebergs that hold the value, and enter a trade in accordance with the density. Immediately after these indicators you need to set a stop, wait for a pullback and exit the trade.
Tricks from big traders
A classic deception is creating the illusion of the chart moving in one direction in order to force ordinary traders to enter the market. It happens something like this:
- A large Ask is issued (not an iceberg, but a regular offer). It seems that there is strong resistance to further growth. Some traders will not buy and will begin to look for opportunities to sell.
- Simultaneously with the Ask, a major player gains volume with a Bid , hiding it from others using an iceberg order. As an option, transactions are made according to the market, but the volume is divided into parts so as not to attract unnecessary attention.
- When the required number of lots has been purchased, the Ask is removed , and instead a large offer to buy is placed. The crowd believes that a downward movement is now excluded, and purchase transactions are made. Some traders who previously opened short positions get rid of them, also entering into buy transactions.
- Due to this scheme, a major player gains volume at a favorable price and leaves ordinary traders no choice. They are forced to move the price to where the big man originally planned.
As for how to understand the order book on the stock exchange, you can’t do without a transaction tape. In the example discussed above, an experienced trader could have suspected something was wrong when analyzing the positions being opened. Level II without data on real transactions does not allow this.
Other techniques are also used . For example, instead of setting a “slab” in the form of a large offer, traders manually or with the help of robots buy/sell at a certain level, protecting it. Level II is useless in such a scenario; you will not be able to understand through it exactly where the interest of a large trader is.
Overbought/oversold levels
Marks are set at levels where the number of profitable sellers (for Oversold) or profitable buyers (for Overbought) exceeds 80%.
Since at these levels the number of profitable buyers/sellers is off the charts, this is a signal of an upcoming reversal movement.
How to analyze:
- If the price approaches the overbought (OB) level, you should sell.
- If the price approaches the oversold level (OS), you should buy.
Since this is a reversal signal, it is convenient to use it in conjunction with the mid-volume level, setting take profit at this level.
On news, these levels should be used with caution.
Also, price doesn't have to actually touch this level, so analyze consciously.
Market book in MetaTrader4 and 5
MT4
MT4 has added a glass, but functionally it is inferior to its counterpart from Quik and other terminals. In MetaTrader4, this tool is called from the context menu or by pressing Alt + B. Through it, you can open market transactions, place pending orders and set alerts that are triggered when the chart reaches a certain price level.
When working with currency pairs and CFDs on shares and indices, you will not see real data on those wishing to buy or sell an asset. The standard order book in MT4 is not particularly useful for trading.
Much more significant custom indicators that show the distribution of buy and sell orders among broker clients. They are used as a guide when setting stops, takes, and searching for entry points. When working with such instruments, I recommend limiting yourself to majors and running crosses. If you don’t know what this is, an article about the main currency pairs will be useful.
Start trading with AMarkets
MT5
MetaTrader5 implements full-fledged glass. When working in exchange mode (some brokers provide access to the stock market through MT5), the same information will be displayed here as in Quik and other terminals.
When working on the Forex market, volumes in lots are also displayed, but the table of impersonal transactions is not available Despite the broadcast of information on volumes, it is useless in trading.
Even at night, offers for majors are constantly changing. There is no benefit from the fact that, for example, at a price of 1.33233 on GBPUSD there is a volume of 45 lots for sale. After a second, this proposal is absorbed, and new ones appear.
What is the DOM and why is it good to know how to work in it?
Translated from English, DOM (Depth of Market) is the depth of the market, or in the terminology of Russian-speaking traders - “depth of price”. Essentially, this is a list of orders placed for purchase and sale. The higher the price, the more requests for sale; the lower the price, the more people want to buy. Some traders prefer to work only with the order book, without turning to charts at all. They believe that the glass reflects the actual balance of supply and demand. And the behavior of orders and prices is used to judge the strength and weakness of the market.
Now we will use the example of a sign to explain what the depth of the DOM market is
.
Let’s say there are only two traders on the market – Vasya and Petya. Vasya has significantly more money than Petya.
In order for the price to move, one of the two traders must start buying with market orders. Let's say Vasya buys 50 contracts from Petya at 1100 and moves his bid higher (what are bids and asks). Since he has more money, he continues to buy contracts from Petit and moves his bids and price higher and higher. Petya begins to get nervous at 1150, at 1200 he is no longer just nervous, but feels acute pain due to losses.
So, Petya can no longer tolerate losses and begins to immediately close the contracts, selling them to Vasya, because there are only 2 players on the market. According to the results of the trade, Vasya is in profit, Petya is without money and with psychological trauma. This is how the market works, only there are not two players, but significantly more. But “smart money”, as a rule, is concentrated in the hands of a few.
The task of traders is to aggressively put pressure on opponents and force them to close positions. The situation we have described occurs in different variations every day in any market. The smart money puts pressure first and then takes profits. Therefore, the price moves up and back down.
In its simplest form, you will find the DOM in Kwik. There is only price and limit orders.
ATAS DOM is called Smart DOM for a reason; it is really very smart.
Watch the video on our channel about all the capabilities and settings of Smart Dom. Don't forget to subscribe!
Let's briefly look at the main details:
- at each price level you can see the volume actually traded – bid trades, ask trades
- the market profile of the current day, the previous day and the entire contract is visible – today, last day, contract
- you can see changes in limit orders at each price level - the last two colored columns
- there is a field for notes – notes (it is not visible in this picture because we did not activate it in the settings).
- You can trade directly from the order book in one click
- All fields, text sizes, colors are customizable
- you can create and store templates for your glasses
This is a really convenient Smart DOM with a full set of functions. It’s even awkward to compare it with a glass from QUIK.
Recommendations for using the glass in trading
When using this tool in your work, I recommend:
- Combine it with transaction data. Without this, you won’t know which offers were implemented.
- Use other methods of analysis and search for entry points. If a signal was identified, for example, using Fib levels, and later it was confirmed through Levels I and II, its value increases. For beginners, I recommend taking the educational program “How to use Fibonacci levels.”
- Be critical of the offers of major players. There are traps all the time, learn to avoid them.
In Forex, I recommend not trying to use the standard MetaTrader order book, it is useless. The exception is the exchange mode of operation when using MT5.
Where to start trading
If the stock market seems too complicated, you can start working with CFDs on shares. In terms of trading conditions and the number of available assets, I recommend AMarkets. In the tables I will give the main characteristics and tariffs of the broker.
| Company | AMarkets | ||
| Rates | Standard | Fixed | ECN |
| Minimum deposit | 100$/100€ or 5000₽ | 200$/200€ or 14,000₽ | |
| Recommended capital | 1000$ | 50 000$ | |
| Leverage | 1 in 1000 | 1 to 200 | |
| Spread, points | Floating, from 1.3 | Fixed, from 3 | Floating, from 0 |
| Commission | No | 2.5$, 2.5€ or 175₽ for 1 lot one way | |
| Minimum Margin | 1$ | 5$ | |
| Stop Out | 20% | 40% | |
| Exiting client transactions to the interbank market | No | Yes | |
| Ability to place pending orders inside the spread | No | Yes | |
| Requotes | Eat | Their absence is guaranteed | |
| Open an account | |||
| Criterion | AMarkets |
| Regulation | The Financial Commission |
| Minimum capital | From $100, €100, 5000 RUB for standard accounts |
| Number of assets | 100+ |
| Recommended capital | $1000 |
| Account currency | USD, EUR, RUB |
| Maximum leverage | 1 to 1000, on ECN – 1 to 200 |
| Spread in points | Floating, from 0 for ECN, fixed from 3 |
| Commission | $2.5, €2.5 or ₽175 for 1 lot one way for ECN |
| Execution speed, ms | 53,3 – 70,0 |
| Stop Out | 20-40% |
| Exiting client transactions to the interbank market | + |
| Number of positions | No limits |
| Pending orders inside the spread | + |
| Requotes | — |
| Limiting the number of transactions | Absent |
| Limit orders inside the spread | + |
| Availability quote | — |
| Own indicators | Cayman (market sentiment) and COT (provides information from the Commodity Futures Trading Commission) |
| Peculiarities | Welcome bonus up to $10,000. Cashback, there are tournaments and other incentives for traders |
If you decide to switch to Amarkets, I recommend taking a closer look at the welcome bonus . This is a real opportunity to get your first deposit with minimal effort. Previously, a separate post was published about a no deposit bonus on Forex. In it, this pleasant moment was examined in more detail.
Open a Forex account in AMarkets
Summary
In stock trading, the glass and deal tape are useful tools. They help to understand the true intentions of other traders, in particular large players who can influence the movement of the chart. For intraday work, the use of Level I and II is recommended for everyone without exception. If trading is carried out on higher timeframes (H4 and higher), you can do without studying the orders of other traders.
The effectiveness of using these tools directly depends on the experience of the trader. It will be difficult at first, but over time you will get used to it. I can’t guarantee that each of you will be able to predict the movements of the big man, but at least you will be able to see the traps and be able to correctly place stops and takes.
In the comments, you can not only leave questions about working with Level I and II, but also share your own experience. Perhaps there are suggestions or comments - I will also be happy to hear them.
This concludes my short overview of working with the stock order book. Don't forget to subscribe to my blog updates in telegram to be among the first to receive notifications about the release of new materials. All the best, success in trading and see you soon!
If you find an error in the text, please select a piece of text and press Ctrl+Enter. Thanks for helping my blog get better!
What does this have to do with the glass?
If we enter into the table all the information on glazed cheese curds from the example above, we will, as it were, fill the table with information about current supply and demand. That is, we will be able to evaluate the current tenders for cheese curds. The order book is a technical analysis tool. It's not of interest to fundamentalist traders, so Warren Buffett probably doesn't use it.