Greetings, colleagues. In this article, we will recall the graphical figures of technical analysis. As you should know, in the section Graphical figures of technical analysis, a sufficient number of patterns have already been collected, the study of which will have a positive impact on trading.
The Cup with a Handle pattern, which will be discussed now (by the way, it is also called a Glass with a Handle, a Mug with a Handle, etc.), refers to a bullish pattern of trend continuation, and not, as many people think, a reversal pattern and is perfectly used in trading not only stock exchange, but also on the Forex and futures markets. It is extremely rare, but it works just fine, and besides, considering that it is often built on higher timeframes, the stop-to-profit ratio is clearly in our favor.
Like many other graphic patterns, the Cup and Handle migrated to the Forex market from the stock exchange.
What does a cup and handle pattern look like in technical analysis?
The cup with handle pattern in technical analysis (from English cup with handle pattern, second name Mug, Glass ) is a classic trading pattern aimed at continuing the movement . It received its name for its strong resemblance to the piece of utensils of the same name. The famous trader William O'Neill first used it on the stock market and later described it in his research. It is noteworthy that William described an exclusively bullish pattern that should take seven weeks to form. Later, many speculators began to use technical analysis of a cup with a handle in the futures market, options market and the Forex exchange.
The formation is formed on all timeframes. The only thing worth considering is that the larger the timeframe, the better the design.
A long period of formation is a good prerequisite for the next strong price movement.
The pattern resembles dishes
Although a candlestick pattern is rarely formed, traders should know about the principles of constructing and trading a pattern.
In this article we will analyze the description, features of technical analysis of the design, options for entering the market and maintaining a position.
Technical analysis of a cup with a handle - formation conditions
Let's figure out in order what needs to happen in order for the mug to be identified:
- The presence of pronounced bullish trend .
- Care for correction . It is at this moment that the left side wall of our cup .
- The next stage is associated with the formation of the bottom . The bottom may look like a consolidation, sandwiched between support and resistance levels, or have a rounded shape, without obvious boundaries.
- Continuation of the upward movement and completion of the formation of the right wall of the cup . The maximum of this side wall can be located either at the level from which the left correction wall appeared, or be slightly lower or higher.
- Then we see again price departure for a tight correction.
It is important that it does not exceed 50% of the depth of the cup. Ideally it should be less than 30%. This is our pen .
- After the corrective movement, an impulse jump in quotes occurs , which breaks the resistance level . A price surge may occur after the release of macroeconomic news from fundamental analysis.
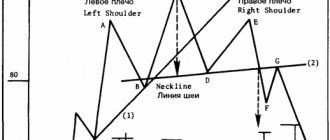
The diagram shows the main components of the technical analysis design:
- Uptrend
- Left side of the cup
- Bottom. Minimum design
- Right side of the cup.
- Pen. Definitely on the right side.
The lowest price point in a consolidation is often at 61.8 Fibonacci lines.
Cup shape options
The size of the formation cup should not exceed 80% of the previous upward movement. Otherwise, trading the pattern is prohibited.
The cup may look like the following bottom:
- Semicircle shape.
- Rectangular bottom.
- The bottom is like a triangle.
Whatever the bottom, the bowl itself is indicated in the shape of a large arc .
There is absolutely no difference in practicing different cup shapes.
Handle shape options
handle ideally be less than 30% of the total size.
If it exceeds 50% of the total size, then the technical analysis model is considered unsuitable for trading. Such variations cannot be traded.
If we consider the shapes of the pattern handles in more detail, we can distinguish the following varieties:
- Flag. If accompanied by a good flagpole, it enhances the upcoming strong price movement.
- Rectangle is the most dangerous type to enter. Too little time is given to make a decision (buy) and there is a high chance of getting a false breakout of the level.
- Wedge. In this case, the wedge becomes a continuation figure, although it is a reversal formation.
All these forms of handles act as independent models of technical analysis. Trade strictly for a breakout of the maximum border.
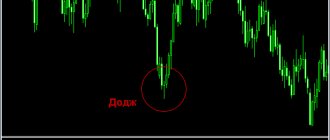
How does a reversal point form at the bottom?
Against the background of a rollback against the current trend, the first bar appears, which produces a stopping effect, forms a minimum with a subsequent price reversal. Next, big players make a hidden attack and push the correction to another bar, which forms the next extreme, allowing you to collect stop orders from weak asset holders.
As a rule, after the described combination with a small upward price gap against the background of increased demand, a bar is formed, the maximum of which is located slightly above the level of the first provocative bar. Naturally, its minimum was formed above the maximum value of the last bar, which made the bottom and led the asset to a reversal trend.
The last reversal bar is clear evidence of the aggressive action of sellers, who hastily bought up the stock in order to reduce current losses and go over to the side of the bulls. Surely you have a question, which, in fact, was the reason for describing the turning point: at what point should you open a position? The market is entered as soon as the close of the third bar is clearly above the high of the first reversal bar.
The turning point at the peak of the trend will not be considered in this educational program, because we are interested in purely upward trending tendencies. However, the picture format below allows you to track price behavior in both situations. The drawing will make the above description less confusing and more transparent, especially for young speculators.
Reversal saucer pattern in technical analysis
The saucer, by its name, represents a classic technical analysis pattern, but without a handle . The most important difference from the circle is the subsequent trend reversal after the formation appears.
The saucer has a number of features:
- Large stop loss value. Due to the possibility of a rollback to the middle of the figure, the stop is placed beyond the extremum.
- Appears at the top, bottom of the market. Found on all assets.
- The best work occurs with the use of volumes. There should be a surge in volume at the beginning, middle and end of the structure.
- Smooth acceleration of the graph curve upon exit.
Inverted formation
Like the classic form, the inverted “Bowl” is a local reversal pattern, which over a long period of time is a temporary correction of a more global movement. A visual image follows.
In fact, when implementing it, the same rules apply, but in the opposite direction. Profit targets are equal to the height of the “body”. We place a stop, depending on the strategy used, at the top of the right side, or at the support of the base of the “circle”. As can be seen from the graph shown above, the formation was played out in full. And even a little more. Then you can notice another similar situation, but in a somewhat truncated form, and a further continuation of the price decline. Which once again confirms the hypothesis that any technical analysis figure may not have a strictly defined form.
Do not forget that this position can be opened using a pending limit order, compiled taking into account potential market prices. If all the opening, closing and stop loss price values are correctly included in the order, the system can bring profit without the direct participation of the player.
How to trade the cup and handle chart pattern in Forex
There can always be several options for trading a mug.
It is noteworthy that it is impossible to determine the origin of a formation in advance; we can see this only at the stage of the emergence of a handle.
If we take into account the distribution of volumes in the circle , we can see the following picture of the MT4 indicator:
Forex market mt4 volume indicator
Aggressive way of trading
This strategy for entering a trade is suitable for the most leisurely ones. It consists of opening an order at the moment the handle is formed before the resistance level is broken.
The main problem of this method is the rebound from the level and the move down. In this case, the stop loss is set exclusively behind the bottom of the cup.
The trading technique uses the trader's luck factor and I highly recommend not using it . There is no point in entering ahead of the curve for the sake of a few points, especially since the pattern has not yet been fully formed.
Standard way of trading
The standard strategy for opening a trade is to enter at the moment the resistance line is broken after the cup handle has formed. It is also possible to install a pending breakout Buy stop order at the level.
The problem with this technique is the high probability of a false breakout. There is often a situation when a breakout Japanese candle forms a long spire and dives back under the level.
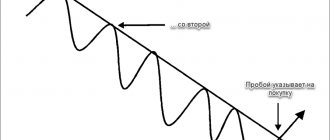
Conservative way of trading
In a conservative way , we wait for the price to retest to the handle after breaking through the resistance level.
A signal to buy can be immediately after a couple of Japanese candles, or after two (three) days. If we consider timeframes older than H1, then a return is possible in weeks.
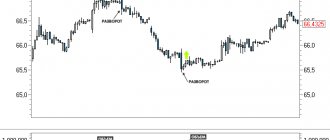
Let's consider a transaction that occurred using the False Breakout trading strategy . On the second day, after the impulse breaks through the flag, which is still a handle, we see the price return to the retest zone. The first rebound was just the size of our model. Next, we see a second signal to buy an asset, which is combined with a false breakout of the peak of the first touch. We make sure that all conditions for forming an entry pattern are met and open a buy deal. The final risk to reward ratio is 1 to 4.
TS False Breakout provided an excellent opportunity to join the formation.
Where to set a stop loss for a cup and handle pattern?
There are three options for setting a stop loss pattern in technical analysis:
- Stop loss for the bottom . SL often turns out to be large, with a small risk-to-reward ratio of 1 to 1.
- Stop by the handle . The ratio here is already better, but there is a risk of a false breakout and a further bullish trend.
- at a distance of 50% from the depth of the cup . The optimal ratio is 1 to 2, with a lower probability of hitting the SL.
There is another type of stop loss - for a breakout impulse candle. This method is suitable for timeframes from H1 and higher.
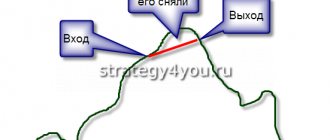
Profit planning
Fig.2 Determining the purpose of movement.
Where to set take profit? The answer to this question is very simple. We measure the height from the reaction bottom to the reaction peak of the “cup”. After breaking through the peak in the “handle” area, the price should increase by the same amount.
We recommend setting take profit a little lower. Just in case, since any figure does not always “work” perfectly.
After the price has approached our target, we can set a stop loss a little lower and move the take profit higher. If you're lucky, you can perform this operation several times. Then the profit will be much higher than initially planned.
However, there is a risk that the very first positive stop loss will be triggered, and you will personally limit your income.
Nevertheless, it is worth trying to get the most out of the deal. Let us remind you that a trend is not considered complete until a reversal pattern appears. Therefore, the real purchase potential is difficult to determine. It may turn out to be much higher than the originally set goal.
False figure
A false technical analysis figure is mainly obtained by violating the rules for forming a Cup with a handle.
The main mistake and falling into a false breakout is trading in a flat.
To avoid falling for false technical analysis, write down the rules and check each model according to the checklist.
Mistakes and difficulties when trading the cup and handle figure
Let's look at what traders stumble upon when trying to trade this pattern:
- Trading a technical analysis model at market peaks or flats without a clear market direction .
- Errors associated with the inability to discern a pattern on a chart . This problem is often associated with graphical models. There is only one way out here - training your eye to identify the formation on the chart.
- Too strong correction of the previous trend . If the size of the technical analysis pattern is huge and exceeds 70% of the previous bullish movement, then the formation is missed.
- Haste , namely premature entry into the inception stage of the structure.
- Inattention. It can manifest itself both in determining a trend and in not noticing the conditions for the formation of a pattern.
- Fastening far above the handle . This is called entering a departing train. This doesn't end well. The risk/reward ratio suffers.
- Speed of model formation. The cup with handle should take a long time to form. On timeframes M15-M30 – more than 12 hours (up to a day). On higher timeframes (H1 and higher), the formation time is many times longer.
- Time frame too low. You should not consider timeframes below M15.