Many technical indicators have already been created based on standard moving average lines Moving Average. Most of them are designed for trend trading, since moving averages are ineffective when prices move in a flat. The Kauffman Adaptive Moving Average is one of the modifications of the Moving Average; it is devoid of most of the disadvantages of classical moving averages and provides more accurate and effective signals.
The history of the moving average
According to Alexander Elder, anti-aircraft gunners were among the first to use moving averages during the Second World War - they used moving averages to aim their guns at aircraft. But who exactly is the author of the very first indicator is unknown. the first major moving average experts were Richard Donchian and JM Hurst .
Donchian (1905-1993) - American trader, analyst, businessman, was an employee at Merrill Lynch, where he created a strategy for working with multiple moving averages. Influenced by the book “Memoirs of a Stock Speculator,” he became interested in financial markets, and after the losses incurred in 1929 during the financial collapse, he became deeply involved in technical analysis.
Hirst was an engineer by training, and was also actively involved in the stock exchange business. The author of the famous book “The Profit Magic of Stock Transaction Timing” (the original in English can be found on the Internet without problems), which has become a stock exchange classic. Described the principles of using moving averages in stock trading.
Thus, it is quite possible to assume that the moving average indicator already existed in the middle of the last century and it is, without a doubt, one of the oldest technical indicators. The Moving Average indicator is very well known and popular, so it can be found in absolutely any platform designed for trading. In addition to the four types of MA (they are already discussed in detail on our website), there are many other options and modifications. The formula for calculating a simple moving average is “simple” to the point of disgrace:
A simple, or arithmetic, moving average is calculated by summing the closing prices of an instrument over a specified number of unit periods (for example, 20 days) and then dividing the sum by the number of periods.
SMA = SUM (CLOSE (i), N) / N
Where:
SUM - sum; CLOSE (i) — closing price of the current period; N is the number of calculation periods.
And then the picture (SMA 21):
To calculate the indicator, the elementary closing price of the candle (bar) is taken - it is in the numerator; then it is divided into the required number of days (in the denominator) - depending on the moving average of what period the trader requires (for example, 20, or 50, or 100, and so on). That's all. On the other hand, this simplicity has a downside - the indicator becomes slow and lags - the price has already made a reversal and is moving in the opposite direction, and the indicator has not yet signaled a change in trend:
An example with “Mashka” 200. Using levels and Price Action, it was possible to buy (and quite a few traders bought at this place), and only after more than 500 points and 66 daily candles, the price only broke through the daily reference – the two hundredth moving average. Moving average, like any technical indicator, is not ideal; one of the main drawbacks is its lag. Traders, analysts, and programmers have struggled, are struggling, and will continue to struggle with this problem. At the moment, many interesting and worthy variants of the moving average have been created, which we will get acquainted with below.
It is also worth mentioning that all indicators are installed according to standard instructions.
Trading strategies using filters
When using an adaptive moving average with a filter, analysts recommend following the following strategy[1][2]:
- Open a long position (close a short one) when \textit{AMA}_t - \textit{min}(\textit{AMA}) > \textit{filter}_{t}.
- Close a long position (open a short one) when \textit{max}(\textit{AMA}) - \textit{AMA}_t > \textit{filter}_{t}.
In these formulas, \textit{min}(\textit{AMA}) is the minimum AMA value at the bottom-up reversal point, \textit{max}(\textit{AMA}) is the maximum AMA value at the top-down reversal point, \textit{ filter} — filter value based on the standard deviation of indicator movements.
Adaptive Moving Average
Adaptive Moving Average (AMA, sometimes written KAMA - after the first letter of the creator) - adaptive moving average, author-developer - Perry Kaufman . He is one of the best trading specialists in the world, with more than 30 years of experience in the futures and Forex markets, among others. Author of several books.
He described his creation in the book “Smarter Trading” in 1995 (the book in English is easily found on the Internet). Comparison of AMA (14) with SMA (14) from MetaTrader 4:
As you can see from the picture, the AMA reacts much faster to strong price changes than a simple MA. However, it is immediately clear that during small (short-term) changes, the advantage remains with a simple moving average. This leads to a simple conclusion, voiced by the author of the indicator: for profitable work in the market there must be trend movements. When the market is in a channel, when there is no clearly defined trend, you need to use other trading strategies. That is, no one has canceled the trader’s work - simply and blindly trusting and relying on just one indicator is unacceptable. Practice and experience will help you carry out a competent analysis and determine a trend or flat - the more transactions, the easier it will be.
The formula for calculating the Kaufman moving average is as follows:
ER(i) = Signal(i)/Noise(i)
Where:
ER(i) — current value of the efficiency coefficient; Signal(i) = ABS(Price(i) – Price(i – N)) — current signal value, the absolute value of the difference between the current price and the price N periods ago; Noise(i) = Sum(ABS(Price(i) – Price(i-1)),N) - current noise value, the sum of the absolute values of the difference between the price of the current and the price of the previous period for N periods.
With a strong trend, the efficiency ratio (ER) will tend to 1; in the absence of directional movement, it will be slightly more than 0. The resulting ER value is used in the exponential smoothing formula:
EMA(i) = Price(i) * SC + EMA(i-1) * (1 – SC)
Where:
SC = 2/(n+1) — smoothing constant EMA (smoothing constant), n — period of exponential moving average; EMA(i—1) — previous EMA value.
It is necessary that the smoothing coefficient for a fast market be the same as for an EMA with a period of 2 (fast SC = 2/(2+1) = 0.6667), and for a period without a trend, the EMA period is equal to 30 (slow SC = 2/(30+1) = 0.06452). Thus, a new variable smoothing constant (scaled smoothing constant) SSC is introduced:
SSC(i) = (ER(i) * ( fast SC – slow SC) + slow SC
or
SSC(i) = ER(i) * 0.60215 + 0.06425
To more effectively influence the resulting changing smoothing constant on the averaging period, Kaufman recommends squaring it.
Final formula for calculation:
AMA(i) = Price(i) * (SSC(i)^2) + AMA(i-1)*(1-SSC(i)^2)
or (after conversion):
AMA(i) = AMA(i-1) + (SSC(i)^2) * (Price(i) – AMA(i-1))
Where:
AMA(i) — current AMA value; AMA(i—1) — previous AMA value; SSC(i) is the current value of the changing smoothing constant.
The indicator is designed to solve two contradictions: the problem of random price spikes - which can be interpreted as the beginning of a new trend; on the other hand, excessive smoothing leads to delayed readings. One of the author’s tips can be attributed not only to working with his indicator, but to trading in general: develop your own trading approach (rather than take something ready-made; moreover, the approach to work itself can be outrageously simple - one indicator and one oscillator ) and test it against history. It sounds outrageously banal and primitive, but it works. In addition, Mr. Kaufman uses Excel to test his approaches.
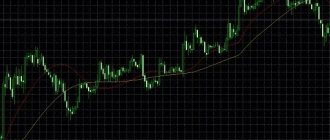
How to use? As for the practical application of the indicator in work, there will be nothing new here - this is a purchase when the indicator is directed upward and the price is above the indicator, and the mirror opposite conditions for sales. However, in practice, such trading will result in many small losing trades. The developer himself understood this, so he suggests using another technical indicator – StandardDeviation – as a filter. This is roughly what it should look like:
Signal to sell – AMA is directed downwards, price is below MA. The StdDev indicator is growing. As soon as it starts to decline, this is one of the signals that, most likely, the trend is ending - a good moment to exit the position. A stop order can be placed beyond the last local maximum, the take profit is twice as large. Agree - all this is very simple. And yet effective. By the way, Kaufman himself recommended experimenting with indicator settings for different markets and instruments. Well, there is no doubt that this tool is very effective.
conclusions
Try this tool!
Perhaps he is exactly what you need. This tool will probably be the starting point for you at the beginning of your journey. That's why I recommend trying it. Open a small or large account. And try to trade. You need to learn, you already know quite a lot and you know if you go through life with me. But this is not enough. We need to trade. You need to gain practical skills, and without them you will not be able to realize even the most modest requirements for yourself and your trading. What's the best way to start? Read and trade. These are two simple rules. Don't risk large amounts of money! Just let yourself feel that you are in the market. If you can risk a large amount without compromising your own budget. Then try to stretch this process out longer. Don't risk more than 2 percent of your deposit or even less. Try to get as much experience from the market as you need! It is very important! This is so important that you will notice it very quickly! Try it, may you be lucky in the entrances more often. Although, of course, you need to understand that luck has nothing to do with it! That's all, dear friends! Until new notes! May everything be fine with you!
Double Exponential Moving Average
Double Exponential Moving Average (DEMA) – double exponential moving average. Indicator developer: Patrick G. Mulloy , published in 1994 in his article “Smoothing Data with Faster Moving Averages” (in the February issue of the journal “Technical Analysis of Stocks & Commodities”). Here is what the author wrote about his development: “Moving averages have one drawback - the delay time, which increases with increasing period of the moving averages. As a solution, a modified version of exponential smoothing was created with less delay time...” The calculation formula is the difference between the doubled single EMA and the twice smoothed (same) EMA and has the following form:
DEMA(i) = EMA(Price, N, i) + EMA(err, N, i) = EMA(Price, N, i) + EMA(Price – EMA(Price, N, i), N, i) =
= 2 * EMA(Price, N, i) – EMA(Price – EMA(Price, N, i), N, i) = 2 * EMA(Price, N, i) – EMA2(Price, N, i)
Where:
EMA(err, N, i) — current value of the exponential average of the error err; EMA2(Price, N, i) — current value of double sequential price smoothing.
Here, from the double EMA value, an EMA with the same period is subtracted, but constructed not based on closing prices (as usual), but based on the values of the same EMA (i.e., using double smoothing). The delay ultimately turns out to be less than the delay of each average separately - this is the advantage of the indicator. The indicator settings include only the period of the moving average.
In the screenshot below, red SMA 14 compared to DEMA 14:
How to use? Let's compare DEMA and EMA - one of the best moving averages available in the MetaTrader 4 terminal:
Both here and there - period 20. I think - here everything is clear that DEMA (yellow) reacts much faster to price changes, it is much closer to the price than EMA (red). For example, if you use DEMA as a third-party indicator for trailing a profitable position with an auxiliary advisor, the transaction will be closed earlier and the profit will be greater than if using EMA. Of course, here we must not forget about the market, but it will not be superfluous to have all the tools for all occasions.
In addition, the DEMA indicator itself can be used to smooth the readings of other indicators based on moving averages, for example Makdi - DEMA_MACD (you can see it in the corresponding topic). According to the results of tests by Patrick Malloy, it was discovered that the same Makdi using DEMA, although it gives fewer signals, but their processing has increased significantly. Thus, the double EMA is a very interesting instrument worthy of close examination.
FRAMA
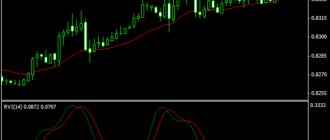
FRAMA – Fractal Adaptive Moving Average – indicator developed by John Ehlers . Ehlers is the author of several books and technical indicators (for example RVI).
Comparison of the FRAMA indicator with SMA14:
The indicator is based on the EMA algorithm. The main advantage of the indicator is that it reacts well to large trends, and during a flat it stops abruptly - as can be seen from the screen. As for the calculation formula, it looks like this:
FRAMA(i) = A(i) * Price(i) + (1 – A(i)) * FRAMA(i-1)
Where:
FRAMA(i) — current FRAMA value; Price(i) — current price; FRAMA(i-1) — previous FRAMA value; A(i) is the current exponential smoothing factor.
The exponential smoothing factor is calculated using the formula:
A(i) = EXP(-4.6 * (D(i) – 1))
Where:
D(i) — current fractal dimension; EXP() is a mathematical exponent function.
The fractal dimension of a straight line is equal to one. The formula shows that if D = 1, then A = EXP(-4.6 *(1-1)) = EXP(0) = 1. Thus, if the price changes linearly, exponential smoothing is not used, because the formula in this case looks like this:
FRAMA(i) = 1 * Price(i) + (1 - 1) * FRAMA(i - 1) = Price(i)
That is, the indicator exactly follows the price.
There are only two options for setting up the indicator: selecting a period and selecting a price for calculation (0 – closing price; 1 – opening price; 2 – maximum price; 3 – minimum price; 4 – average price; 5 – typical price; 6 – weighted price closing). As for the use of fractals for calculating moving average readings, this should not be confused with Bill Williams’ fractals - there is nothing in common.
How to use? In trading, FRAMA is used like all trend indicators. To filter false signals, you must use some kind of oscillator, as the indicator developer himself says about this. If you are tired of standard MT4 tools, then you can find something unusual and interesting here.
Content
- 1 Prerequisites for creating the indicator
- 2 Calculation method 2.1 Basic formula
- 2.2 Efficiency factor
- 2.3 Smoothing constant
- 2.4 Adaptive moving average
Hull Moving Average
The Hull Moving Average (HMA) indicator is the Hull moving average. The author is Australian trader, mathematician, financier
,
analyst Alan Hull .
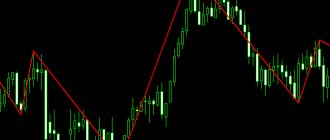
According to Alan himself, he was working on a completely different indicator when he became interested in the problem of the moving average lagging behind the price, as a result of which this indicator appeared (in 2005). The calculation formula looks like this:
HMA(n) = WMA(2*WMA(n/2) – WMA(n)),sqrt(n))
In order to understand how price lag is eliminated in HMA, let's look at this example: 0+1+2+3+4+5+6+7+8+9/10=4.5; As a result, the average value turns out to be 4.5 – which is quite far from the last price value (9). And in practice, we will see a fairly strong lag of the indicator from the candles on the chart. Alan Hull suggested reducing the gap this way: 5+6+7+8+9/5=7, which is much closer to the current price (7 is much closer to 9 than 4.5 to 9). Next, Alan added the difference between the two average numbers (7-4.5=2.5) to the number and ended up with (7+2.5=9.5) 9.5 - even a little more than the current price of 9 - a very good balance between lag and smoothing was obtained. The problem of the moving average lagging behind the price was practically eliminated. Compared to the regular SMA (14) from MT4 (red), the HMA gives a possible entry signal much earlier, and also changes its color for upward and downward trends - which can be convenient compared to a conventional indicator.
How to use? Let's look at the settings of this indicator:
What they mean is below:
- HMA _ Period – period of the Hala moving average (default 20);
- HMA _ PriceType – apply moving average calculation to the price value (Close by default). Entered as numbers (0 – Close; 1 – Open; 2 – High; 3 – Low; 4 – Median Price; 5 – Typical Price; 6 – Wieghted Close);
- HMA_Method – Hal moving average calculation method (linear weighted by default). Entered as numbers (0 – Simple; 1 – Exponential; 2 – Smoothed; 3 – Linear Weighted);
- NormalizeValues – normalization of values (this parameter can be ignored and left at default, since it does not greatly affect the indicator readings; the same applies to the NormalizeDigitsPlus );
- VerticalShift – shift of the sliding vertical, the value is specified in points.
The website has a detailed overview of this indicator, including a video lesson and examples of work. You can view it here.
Jurik Moving Average
The Jurik Moving Average (JMA) indicator was developed by Mark Jurik in 1998. Mark Jurik, the founder of Jurik Research, managed to work for the US Army in the late 1980s and early 1990s, and since the Cold War ended, his work and research were useful in the financial sector, where he mainly works now. Actually, he is the author of technical indicators, for example RSX and some others.
Compared to the red SMA 14, the JMA 14 signals a trend change earlier:
Unfortunately, it was not possible to find a formula for calculating the JMA indicator anywhere - apparently this is a secret. But it’s worth mentioning the indicator settings.
There are only three of them:
- Len – indicator period, default 14;
- Phase – using this parameter you can try to find a compromise between two opposite properties of the indicator: lag or departure beyond the price limits – values can be from -100 to +100 (see screenshot below);
- BarCount – number of bars to calculate readings.
Once again regarding the Phase parameter - what it affects and how it is visually visible on the graph:
The screen shows two JMAs: the white one has a Phase +100 setting - moving closer to the price during a trend movement, but when the trend ends and a reversal occurs, this “machine” flies far beyond the price movement - the market is already moving in a different direction, and the indicator continues to show the old. Unfortunately, no one has been able to solve this problem yet. The yellow JMA has a Phase -100 setting and is slower to react to price changes. Thus, the trader has a choice - either use the earliest signal, and at the same time observe “false” indicator readings during the end of the trend, or use the opposite approach. If both situations are not important, then this parameter can not be touched at all.
How to use? JMA is one of the best technical indicators in its class. No, of course, it is not the grail that allows you to earn 100500% profit per day, but the problems with lag and the indicator’s response to unnecessary noise are solved here as well as possible. A small GIF animation from the author’s website showing how different types of moving averages react to the gap:
Let's not be lazy and install all the shown moving averages in our terminal (while preserving the colors) and see (period 14 everywhere):
Indeed, Mark Yurick's moving average is generally always closer to price than other MAs. Well, in some places there is “rivalry” of the double exponential EMA (green color).
If we compare the popular exponential moving average (red) with the JMA (white), then the advantage of the latter will be here too:
Another example of why it is better to use JMA rather than standard MT4 moving averages:
If you take into account the MA readings when exiting a trade, then it is better to exit earlier with a larger profit (in points) than to wait for four whole (!) weeks and lose part of the profit (time frame W1 on the screen). In the right hands this will be a very powerful weapon.
Triple Exponential Moving Average
The Triple Exponential Moving Average (TEMA) indicator is a triple exponential moving average, also developed by Patrick G. Mulloy and published in the journal “Technical Analysis of Stocks & Commodities”. The calculation principle is similar to the DEMA indicator. In general, the TEMA formula looks like this:
First, DEMA is calculated, then the error of price deviation from the DEMA indicator values is calculated:
err(i) = Price(i) — DEMA(Price, N, ii)
Where:
err(i) — current DEMA error; Price(i) — current price; DEMA(Price, N, i) — current DEMA value from the Price series with period N.
Add the exponential mean error to the DEMA value and get TEMA:
TEMA(i) = DEMA(Price, N, i) + EMA(err, N, i) = DEMA(Price, N, i) + EMA(Price – EMA(Price, N, i), N, i) =
= DEMA(Price, N, i) + EMA(Price – DEMA(Price, N, i), N, i) = 3 * EMA(Price, N, i) – 3 * EMA2(Price, N, i) + EMA3(Price, N, i)
Where:
EMA(err, N, i) — current value of the exponential average of the error err; EMA2(Price, N, i) — current value of double sequential price smoothing; EMA3(Price, N, i) — current value of triple sequential price smoothing.
And, which is an important feature, the indicator is calculated only based on the closing price of the candle. On the chart the TEMA indicator:
As an example, the normal SMA (14) from the terminal is shown (red), and the blue line is the TEMA (14). Even from this example, it is clear that the signal from the triple exponential MA arrives much earlier than from the simple moving average. This task was pursued by the author-developer, and it should be noted that he succeeded quite well in this matter. In addition to the TEMA indicator, a modified version is included in the download archive, where you can select the average smoothing method and apply the calculation to different prices. The only settings for the basic indicator are the selection of the MA period.
How to use? Let's look at the TEMA (white line) and exponential moving average (red line) from MetaTrader 4:
The period in both cases is set to 21. I think that no comments are required anymore - everything is clear from the picture. It would be useful to compare the double (purple DEMA line) and triple (white TEMA line) exponential moving averages:
The difference between them is not very fundamental. As a conclusion, you can use/apply any one in trading. A small nuance is that the MetaTrader 5 terminal has these indicators, but for MT4 they are simply not there by default.
Literature
- Perry J. Kaufman
Smarter Trading: Improving Performance in Changing Markets - McGraw-Hill, Inc. — 1995—257 p. — ISBN 0-07-034002-1.
| : Incorrect or missing image | To improve this article it is desirable:
|
| Charts | Kagi • Tic-Tac-Toe • Renko • Japanese Candlesticks |
| Indicators | KST • Trix • Williams %R • Kauffman Adaptive Moving Average • On-Balance Volume • Arms Index • Money Flow Index • Mass Index • Accumulation/Distribution Index • Relative Strength Index • Commodity Channel Index • Negative and Positive Volume Indices • MACD Indicator • Ichimoku Indicator • Donchian Channel • Keltner Channel • Coppock Curve • Ease of Movement • Bollinger Bands • Advance/Decline Line • Momentum • Ultimate Oscillator • McClellan Oscillator • Parabolic Time/Price System • Directional Movement System • Moving Average • Stochastic Oscillator • Sum of Open Interests • Trend prices and volume • Japanese candles |
| Software | CQG • MetaTrader • NetTradeX • QUIK • TraderStar |
| Analysts | Edward Davis Jones • Richard Donchian • Charles Dow • Edward Thorpe • Ralph Nelson Elliott |
Variable Index Dynamic Average
Technical indicator Variable Index Dynamic Average (VIDYA) is a moving average with a dynamic averaging period. Its author is an American trader and analyst of Indian origin , Tushar Chande .
Born in 1958, he is known for his engineering inventions (he has nine patents), which are used in one way or another in the Forex field (well, first of all, these are technical indicators, for example the Aroon Oscillator, there are also modifications of the stochastic and some other indicators). Author of books and scientific articles on Forex topics. Well, in 1994, he proposed his own version of the moving average with a dynamically changing averaging period - VIDYA. The EMA averaging in its indicator depends on price volatility, and the oscillator of the same author, Chande Momentum Oscillator (CMO), was chosen as a measure of volatility. The VIDYA calculation formula looks like this:
The Variable Index Dynamic Average value is calculated similarly using CMO:
VIDYA(i) = Price(i) * F * ABS(CMO(i)) + VIDYA(i-1) * (1 – F* ABS(CMO(i)))
Where:
ABS(CMO(i)) — absolute current value of Chande Momentum Oscillator; VIDYA(i—1) — previous value of VIDYA.
The CMO value is calculated using the formula:
CMO(i) = (UpSum(i) – DnSum(i))/(UpSum(i) + DnSum(i))
Where:
UpSum(i) = current sum of positive price increments for the period; DnSum(i) = current sum of negative price increments for the period.
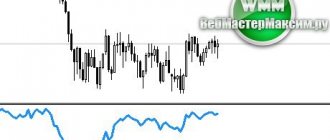
VIDYA 14 (compared to red SMA 14):
As you can see from the screen, one of the features of the indicator is that it assumes an almost horizontal position after the completion of an upward/downward trend. This feature can be used as a signal to exit a position.
How to use? As is often the case in the world of indicators, there are many different versions and modifications, especially if an item becomes popular. And here is just such a case:
The VIDYA indicator is also known in this form. As you may have guessed, it is very similar to Bollinger Bands or the Keltner Channel. Both VIDYA options are included in the selection, which you can download at the end of the article.
How can you use the Tushar Chend indicator in trading? The simplest and most basic thing is for the price to cross the indicator downwards - for sales, and upwards - for purchases. However, as can be seen even from the above screen, in this case we are guaranteed many small unprofitable transactions. This is a common problem for all trend systems (as traders say – we make money on a trend, but lose money on a flat). And here, as mentioned above, it is worth applying one of the properties of VIDYA - when the trend movement loses its strength - the indicator takes on an almost horizontal position, signaling that if you are in the market, it’s time to get out, if you are outside the market, then you should not trade now .
A typical example of work is a signal for sales before noon (terminal time), after noon - no one will doubt that they need to buy. And towards the evening (closing of the American session), the indicator takes on an almost horizontal position - there is nothing for intraday traders to do in the market. Of course, such good trend days will not always exist; there will also be days with a series of losing trades, this should not be forgotten either. As a trader develops and improves, his intuitive understanding will grow as to when it is not worth getting into the market.
Trading Strategies
Trading strategies based on Kaufman's adaptive moving average are common to all trend indicators[1]:
- Open a long position (close a short one) when the price chart crosses the AMA chart from bottom to top.
- Close a long position (open a short one) when the price chart crosses the AMA chart from top to bottom.
It is important to note that the AMA changes the direction of its movement exactly at the point of intersection of its chart with the price chart, that is, for trading it is enough to compare the current and previous indicator values[2]:
- Open a long position (close a short one) when the current AMA value becomes greater than its previous value.
- Close a long position (open a short one) when the current AMA value becomes less than its previous value.
Volume Weighted Moving Average
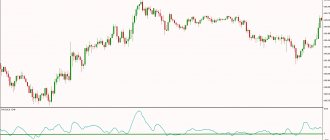
Volume Weighted Moving Average (VWMA) – volume-weighted moving average. The indicator implements the following principle: the larger the volume of the candle, the more weight this candle has. The author, unfortunately, is unknown. In the settings you can set the number of bars (candles) for calculation. On the screen, as usual, 14 SMA (red) and VWMA (14):
A volume indicator has also been added to the picture - it illustrates well - when there is increased volume in the market - VWMA 14 is ahead of the moving SMA 14; when volumes fall (during the Asian session), it’s the other way around. Thus, this moving average gives more weight to volumes - on which its “pattern” will depend. The calculation formula looks like this:
How to use? The indicator settings have two parameters: selection of the moving average period and selection of the price calculation type (entered as a number in the settings: 0 – CLOSE price; 1 – OPEN price; 2 – HIGH price; 3 – LOW price; 4 – MEDIAN price; 5 – TYPICAL price ; 6 – price WEIGHTED – everything here is similar to other indicators, without translation into Russian).
As is already clear from the name, any volume indicator can be applied as a filter to this moving average - Better Volume, for example. If you are a supporter of the VSA method in Forex, then you will definitely be interested in this moving average.
Original parameter values
Kaufman used [1] as original parameters:
- n = 10 (for the efficiency coefficient calculation window),
- f = 2 (for fast moving average),
- s = 30 (for a slow moving average).
When substituting the indicated parameters into the formulas, we obtain (with original rounding):
\textit{direction}_{t,10} = \textit{close}_t — \textit{close}_{t-9}
\textit{volatility}_{t,10} = \sum_{i=0}^{9} |\textit{close}_{ti} — \textit{close}_{ti-1}|
\textit{EfficiencyRatio}_{t,10} = \frac{\textit{direction}_{t,10}}{\textit{volatility}_{t,10}} = \frac{\textit{close}_t — \textit{close}_{t-9}}{\sum_{i=0}^{9} |\textit{close}_{ti} — \textit{close}_{ti-1}|}
\textit{fastest} = \frac{2}{2 + 1} = \frac{2}{3} = 0.6667
\textit{slowest} = \frac{2}{30 + 1} = \frac{2}{31} = 0.06452
\textit{smooth}_{t,10,2,30} = \textit{EfficiencyRatio}_{t,10} \cdot (\textit{fastest} - \textit{slowest}) + \textit{slowest} = \ textit{EfficiencyRatio}_{t,10} \cdot 0.6021 + 0.0645
c_{t,10,2,30} = \textit{smooth}^2_{t,10,2,30} = (\textit{EfficiencyRatio}_{t,10} \cdot 0.6021 + 0.0645) ^2
\textit{AMA}_{t,10,2,30} = c_{t,10,2,30} \cdot \textit{close}_t + (1 - c_{t,10,2,30}) \ cdot\textit{AMA}_{t-1,10,2,30}.
Welles Wilder moving average
Trading guru Welles Wilder (eng. J. Welles Wilder ) was also noted for creating his own variation of the moving average. In general, he is, without exaggeration, a legendary and outstanding personality in the field of trading.
Let's just look at the list of technical indicators that he developed and which many traders have been using for decades. These are ADX (ADMI), ASI, ATR, Parabolic SAR, RSI. Impressive, right? And then there is WWMA - Welles Wilder's Moving Average - Welles Wilder's moving average. She looks like this:
The screenshot shows, as usual, a comparison with the 14 SMA (WWMA indicator taken from AllAverages_v2_5). The WWMA calculation formula looks like this:
The formula shows that the Wilder moving average is nothing more than an exponential moving average – WWMA(n)=EMA(2n−1). They are actually quite similar:
How to use? We can immediately recommend one of the Wilder indicators as a filter for filtering out false signals. There is no need to tell you how they work. Everyone knows the good old RSI.
Filtration
Despite the dynamic adjustment of the adaptive moving average to market volatility, Kaufman believed that his indicator gave too many false signals[1]. Therefore, he proposed an additional filtering technique based on estimating the standard deviation of the difference between the adaptive moving average in adjacent periods [1][2].
To do this, the change in AMA between periods is taken as the random variable being studied:
\Delta_{i} = \textit{AMA}_{i} — \textit{AMA}_{i-1}.
Then, the standard deviation of this change is calculated:
\sigma_{t} = \sqrt{\frac{1}{d}\sum_{i=0}^{d-1}\left(\Delta_{ti} — \bar{\Delta_{t}}\right )^2},
where \sigma_{t} is the standard deviation of the AMA change in neighboring periods - \Delta_i, \bar{\Delta}_{t} = \frac{1}{d}\sum_{i=0}^{d-1} \Delta_{ti} — mathematical expectation of \Delta_i for d periods.
The fraction of the resulting standard deviation is used as a filter:
\textit{filter}_{t} = K \cdot \sigma_{t},
where \textit{filter} is the filter value based on the standard deviation of the indicator movements, K is the percentage coefficient.
All moving services in one
If it is inconvenient to take a separate indicator, you want to quickly and efficiently compare different types of moving averages and choose the best one among them - then a solution to this problem has been found. There is such a series of indicators - All Averages . Why a series - because there are a lot of such indicators - with all sorts of modifications - both for working on a chart and for basement placement. One of them implements almost twenty types of different MAs - which you can set in the indicator and see what will be better on the chart.
There are 14 SMAs represented. In the settings you can see all types of MAs that you can select. Here is the same indicator (14 SMA), but in the form of a basement histogram:
Trading Recommendations
- We strictly follow the risk management system . When the moving average is actively moving in the profitable direction, beginners may succumb to the feeling of euphoria by not setting a Stop Loss at all or opening too large a lot. The market always punishes such “optimists” with a sharp reversal, up to the complete loss of the deposit.
- The moving average can only be used during trend periods . In a sideways market it does not give the correct signals, but one should not think that during flat periods it is completely useless. A “corridor” of two moving averages underlies such a profitable indicator as Bollinger Bands and other channel tools (Envelopes, Keltner indicator, etc.).
- Any Moving Average indicator is extremely unstable on lower time frames , so for a scalping strategy it is better to choose another solution, such as overbought/oversold oscillators, various price levels (Pivot Points, Murray levels and others) in combination with tick and market volume data. Like any other technical analysis tool, the moving average does not have data from visual analysis and the market situation as a whole. It works only on prices of previous periods and cannot give a 100% correct forecast!
- From the previous paragraph it follows that you should not try to fit the Moving Average to the chart based on historical data. You should not look for non-existent entry points, which beginners often do by setting the period too short and opening at every intersection.
- Don't use just one indicator. The moving average will always lag, even if it is an HMA - always look for additional confirmation or a leading signal on the oscillators such as divergence.
- The moving average indicator must be confirmed by tools that analyze the market according to other principles. Therefore, the MACD indicator or the TRIX indicator built on its basis will not be particularly effective - they will move synchronously with the main average, even if with a different lag. It is recommended to monitor the dynamics of changes in the volumes and balance of Bull Power/Bear Power.
The moving average and strategies based on it will be relevant for a long time, despite the increasing dominance of high-frequency HFT trading. They provide an opportunity for traders with any deposit and level of training to earn money; it is only important to follow the rules and not forget about proper money management.