- How to draw a trend line?
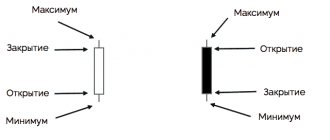
- Line or bar charts and closing price
- A breakout of a trend line may indicate a reversal or consolidation
- Advanced Trend Lines
- Logarithmic or arithmetic graph
- Significance of trend lines
- 1. Trend line length
- 2. Number of times the trend line is touched or approached
- 3. Tilt angle
- Measuring trend lines
- Trending channels
- Exhaustion: When a trend runs out of steam
- Let's sum it up
Trend lines, kotans, are the simplest and most basic concept of technical analysis; the only thing simpler could be a hole in the wallpaper of a one-room apartment and the trousers of your loser dad. This same tool, paradoxically, is one of the most... effective.
Since almost all price patterns require the use of trend lines, the latter are the basic element of both pattern definition and use. Now we will discuss what trend lines there are, how to work with them and how to determine how effective they are.
A trend line is a specific straight line connecting the downward lows in a rising market or the highs in a falling market. The lines that connect the lows are called rising trend lines, and those that connect the highs are called falling trend lines.
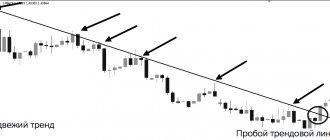
To make a falling trend line, we connect the first maximum with the subsequent ones. When the price breaks the trend line, this is a hint that the trend may change. The same is true for a growing line.
Rice. 4-1. Descending trend line
How to place trend lines on a chart?
In an uptrend, a trend line is drawn by connecting two lows (price retracements).
In a downtrend, a trend line is formed by connecting two highs (price pullbacks).
Thus, drawing trend lines is quite simple. All you need to do is:
- Identify the two lowest or highest points on the graph.
- Draw a line that would connect them.
Even though we can draw a trend line based on two lows or highs, the trend line remains unconfirmed until the price touches it a third time.
Once a trend line is drawn and price bounces off it a third time, it becomes active. Now the price should meet support or resistance at the marked trend line. If the price breaks the trend line, it means the trend has ended.
Trend lines can be placed on all time frames, but they are most effective on higher time frames. In addition, the more time a trend line is active, the stronger it becomes.
How to use trend lines in your trading?
Trend lines have many uses, but the main ones are for trading rebounds or breakouts.
The price bounced off this trend line three times, so we can take it into account. Now that the price is approaching the trend line again, what could happen next? The price will either bounce off our trend line again, or it will break out.
The bullish pressure was too strong and the downtrend is interrupted. The price rises by 200 points, and this means a change in trend.
Now let's look at the price rebound from the trend line.
The price approaches the trend line for the fourth time and bounces off it by 150 points.
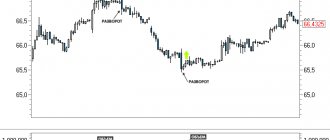
We can see that a pin bar has formed on the trend line.
A breakout of a trend line can be interpreted in different ways:
- The candle breaks the trend line only with its shadow. In this case, the trend breakout has not yet taken place, and we can consider opening trades for a rebound.
- The body and shadow of the candle must close outside the trend line. At the opening of the next candle, you can consider opening breakout transactions.
Trade
To make a profit, a trader needs to know where the market is moving.
Trend lines will help him with this, and the trend itself can be of the following types:
Basic. This is the price movement over a period from 1 year to several years. Such intervals are used by investors who prefer to make long-term investments, but for speculative trading in the market it is better to use other time periods.- Intermediate. It lasts from 1 to several months, being a correction of the general trend.
- Short. Its duration ranges from several days to several weeks. The direction of price movement in a short time period is the most difficult to analyze, but most traders work on such short intervals. The price of an asset is influenced by economic news and events occurring in the world.
You need to start trading by studying the charts of currency pairs. A trend line can be drawn easily. For it you need to take 2 points, connect them with a line, and then extend it.
If the trend is up, the chart goes up, with each high being higher than the previous one. In a downward trend, the situation is reversed, and each low is lower than the previous one.
Trend lines help determine in which direction the price will move. You can tell by appearance whether this is a sustainable trend.
To do this, experts study the schedule, paying attention to the following:
The longer the price goes in one direction, the more likely it is that the movement will continue.- It is necessary to pay attention to the angle formed between the axis and the line. If the trend is strong, then the angle is large. Acute indicates that the trend is becoming weaker and a reversal is possible.
- You need to look at how many times the price bounces from the support and resistance line. The more, the stronger the dynamics.
- To find out long-term trends, you need to study daily charts. Short-term and medium-term trends are determined on hourly or four-hour intervals.
Specialists working on Forex often trade with the trend, setting a large take profit, periodically purchasing additional currency. This leads to the fact that the potential profit far exceeds the loss that can be achieved with a stop loss.
An example of a Forex strategy on trend lines:
Line breakout
If, when looking at the chart, it is clear that there will be a breakdown soon, this indicates that large players have entered the market and are showing interest in the growth or fall of the asset. In this case, there is no need to move against them; the easiest way is to trade with them.
Not all beginners understand what breakout trading is. Most of the strategies are classic techniques that have been used for several decades. They are based on the idea that a price that has fluctuated in one range for a long time will eventually break through the level, moving up or down.
But beginners using such strategies have difficulty identifying breakout levels. Noise can interfere with the analysis, so you need to get rid of it so that it does not contribute to making an erroneous trading decision.
An example of a trading strategy based on graphical analysis (in particular, breakout and rebound from trend lines, levels, channels) - our forecasts for the Safe Forex strategy ⇒ (and an example of one of the forecasts):
And here is an example of a video on how to trade correctly using these free signals:
It is best to use breakout strategies on those currency pairs that are characterized by high volatility. When working, experienced specialists recommend using time frames no lower than hourly, but it is better to focus on four-hour, then there will be little noise.
Trading on a rebound
When sell or buy orders accumulate near the price mark, resistance or support levels arise. The price, having reached the border, rebounds due to the fact that market participants close orders. Traders use this moment in trading. Using Price Action patterns and other tools, you can determine when is the best time to enter the market.
How do trend lines work?
You know that support and resistance levels are horizontal areas on a chart that indicate potential buying or selling pressure.
The same applies to trend lines. The only difference is that the trend line is not horizontal, but inclined.
An uptrend line is an area on a chart with potential buying pressure.
A downtrend line is an area on the chart with potential selling pressure.
Before diving into specific trend line trading strategies and techniques, you must first learn how to draw them correctly.
Construction rules for upward movement
When constructing an ascending trend line, you need to use successively increasing minimum points along which the line is drawn from left to right. An ascending trend line connects the minimum points on the price chart. Such a line can be constructed through at least two points; it is believed that a third point on the chart is required for confirmation as a rule for constructing a trend line during an upward movement.
The more times the price tests such a line, the higher the probability that the next time it touches the price will push off from the line; the trader already receives a buy signal when touching an ascending trend line, or a sell signal when testing a descending one. When buying from an ascending trend line, you should expect that the price will at least test the local maximum and be more likely to overcome it. Therefore, the rules for constructing a trend line in an uptrend are quite simple: we draw a line through the extreme lower points, indicating simply support on the chart, and do not limit the growth potential of the financial instrument quotes.
How to draw trend lines correctly?
First of all, understand the best way to avoid drawing trend lines.
The graph above looks like garbage.
Which trend lines are important and which ones should be ignored?
- Focus only on the major turning points (price pullbacks against the main movement) and ignore all the others.
- Connect at least two main pivot points.
- Adjust the slope of the line in such a way as to get the maximum number of touches of the price line, no matter whether it is the shadows of the candles or their bodies.
Here is an example of a trend line.
Just like trendline support and resistance levels represent zones on the chart, not specific levels. Therefore, you can draw two lines to indicate a possible area of potential price reversal.
Unlike support and resistance levels, which you can simply draw once and leave there forever, trend lines need constant adjustment. This occurs when the price breaks the trend line and then goes beyond its boundaries again. In this case, you need to adjust the trend line so that it matches the latest price movement.
Effective use
Beginners who have only recently started working in the foreign exchange market should not rush. When determining a trend, you need to be scrupulous, look carefully at where the support zone is on the chart and where the price has encountered resistance.
It is necessary to look at whether there were rebounds, in what situations the boundaries of the corridor were broken. It's helpful to write out all the scenarios and then use different methods to confirm or refute your assumptions.
Most often, Japanese candlesticks and Price action patterns are used as confirmation methods. It is useful to use indicators and technical analysis methods.
For example, it is worth looking at what candles were there when the price broke through the level. What happened during the rebound and false breakout, what candles preceded these events.
It is useful to study how the price behaved on different time frames. On some of them, breakdowns and rebounds may occur more often, while on others - less often. The economic calendar is also worth studying. With its help, you can find out whether news came out at that moment and what impact they had on the currency.
Many traders use indicators in their work, but there is no need to mindlessly drag them onto the chart. Before you start working with them, you need to test them. This is necessary so that the trader knows whether he can make a correct forecast with their help.
Beginners must understand that there is no one method by which one can determine how price will behave in the future. Nobody knows whether the candle will break the level or make a rebound. You can only guess how events will develop and then plan your work.
To better understand what is happening in the market, you can use technical analysis. There are many techniques that can help novice traders determine in which direction the price is moving.
How can you use trend lines?
Trend lines help us determine the direction of the current trend. All you have to do is draw a trend line. If the price is above the trend line and the trend line is directed diagonally upward, then the trend is upward. The opposite is true for a downtrend.
But that is not all. A trend line can also alert you when market conditions are changing. To do this, we need to pay attention to the steepness of the trend line.
For example, if your trend line becomes flatter, it means the market is entering a consolidation state. And if your trend line gets steeper, that means the trend is getting stronger (or perhaps it's reaching its climax and reaching its final stage).
If you know that market conditions are changing, you can adjust your trading strategy accordingly.
Types of channels in markets
Like the Forex trend lines, several types of channels can be distinguished: ascending, descending and sideways, all of these channels will characterize the current trend in the market. For example, if we are talking about an ascending channel, then a trend line is drawn from the lows and applied to the peaks on the price chart, thus we get an ascending channel; traders believe that inside such a channel it is better to trade in the direction of growth, and moreover , if the ascending channel breaks upward, we get an acceleration of the current trend. We first build a downward channel along the tops and apply the channel line to the lows on the price chart; here traders try to trade in the direction of the fall, but do not try to sell at the time of testing the lower boundary, since there are risks of an upward movement developing. In a side channel, you can try both buying and selling financial instruments, since there is no clear direction here, and any of the transactions as a whole will be of high quality.
Trend lines help us determine the entry point
If you want to find good trading opportunities, you should look for an entry point near the trend line. This will allow you to use a tighter stop loss, which will improve our risk to reward ratio.
If you combine a trend line with a support or resistance level, you will find the best entry point.
A price action pattern can serve as a signal to enter a trade. For example, a pin bar or engulfing mode. You will only enter a trade when the market bounces off the trend line and is likely to move further.
Trend line trading strategies
When the pullback is very strong and deep, it can be difficult to open a trade along the trend line. If you enter the market too early, your stop loss will be triggered. If you enter a trade too late, you may miss out on a significant portion of the move. Therefore, in this case, it would be best to trade the trend line for a breakout.
- We are waiting for a pullback in the uptrend.
- We draw a trend line connecting the rollback highs.
- If the price breaks the trend line drawn at the highs, we open a trade.
If the price breaks the trend line, it tells you that buyers have gained control of the market and the trend is likely to continue. If this does not happen, then the sellers are in control of the situation, and the best thing to do is to stay out of the market.
What is Forex?
The word Forex literally means “international currency exchange”. All trading operations on this over-the-counter foreign exchange market are carried out through dealing centers and commercial banks. To work successfully in Forex, you need to know its laws and understand the processes occurring in it. Its active participants today include a multi-million army of individuals - citizens of different countries. The daily currency turnover of the Forex market exceeds the turnover of all world markets and amounts to 3 trillion dollars.
The concepts of “trend”, “price”, “tendency”, “trend line” are fundamental in the work of a trader. The behavior of market players depends on market trends and price behavior. The stock exchange players themselves are the force that moves the market in one direction or another. To build an effective trading system, it is important to take into account the relationship between the behavior of the market and its participants.
How to take big movements using a trend line?
- Draw a trend line.
- We use it to move our stop loss.
- We exit the trade when the price closes outside the trend line.
This method does not work when the strength of the trend changes and we have to draw a new trend line. In this case, you risk losing your profit.
How can we determine that a trend will change and become stronger?
- The trend line becomes steeper, almost turning into a vertical line.
- The range of candles increases.
In such cases, we can move our stop loss below the level of the new trend line.
How to use a trend line to determine market reversals?
Has a similar situation happened to you? You see a trend line break and you think, “The trend is about to change because the trend line is broken.” But then the market continues to grow, and the trend resumes.
Therefore, a breakout of a trend line does not mean that the trend is complete. As we already know, trend lines need to be adjusted regularly as the market tends to break through the trend line.
Here is a technique we can use to detect a change in trend direction:
- We wait for the price to break the trend line.
- Next, we wait until a lower high is formed (this indicates that the buyers’ power has exhausted itself).
- If the price breaks the previous low, the market is likely to change direction (sellers are now in control).
Trend phases
It is important to understand that long-term trends do not form and are interrupted suddenly. As a rule, the market develops in certain phases.
The primary phase – accumulation – is characterized by high rates of purchase and sale of assets by market players and investors.
The second phase - distribution - is a period when new players enter the market, as a result of which long-term impulses in the direction of the trend and short-term corrections against it appear on the trend chart.
The third phase – the final one – characterizes the period of time during which the price reached its highest values. During this period, serious players decide to fix positions and withdraw funds.